This article is only a personal opinion on the market and does not constitute investment advice. If you act based on this, you are responsible for your gains and losses.
Economist Fisher proposed a famous formula, MV=PQ, where:
M=Money supply
V=Velocity of money circulation
P=Price level, which can also be the average price of all goods and services
Q=Real output, the total output in the economy
When applying this formula to the economy, PQ=GDP, V=GDP/M. When applying this formula to the stock market, PQ represents the total market value of the stock market, and V=total market value of the stock market/M.
Similarly, we can apply it to the cryptocurrency market. Then V=total market value of the cryptocurrency/M. For the cryptocurrency market, we can simply consider M as the total supply of stablecoins (due to the emergence of spot ETFs, BTC and future ETH have added some statistical M calibers. But the principle is the same. For the convenience of analysis, I will only analyze the altcoin group as the analysis object, as much as possible to exclude the impact of external funds, and simplify the analysis process). V can also be understood as the macro leverage ratio of the entire cryptocurrency market, that is, the multiple of the total market value to the total supply of stablecoins—the rise in total market value depends on the continuous increase in the circulation of funds in the cryptocurrency market.
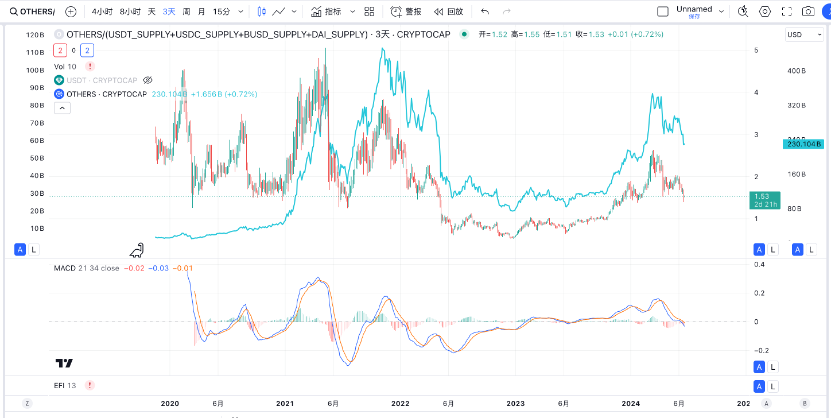
As shown in the figure below, the candlestick chart in the figure is the trend chart of "V" since the beginning of 2020. In terms of the statistics of M, it is combined with the total amount of USDT, USDC, BUSD, and DAI. The market value is selected as the total market value of all currencies except the top 10, that is, the total market value of altcoins. The blue line in the figure below is the trend of the total market value of altcoins.

Combining the information in the figure, let's make a simple summary and correlation of the past trends. V reached its peak at 5 in early May 2021, at which time the total market value of altcoins also reached the first high of the year. In early November 2021, the market value reached a new high, but "V" only reached a secondary high of 3.8. The macro leverage ratio of the cryptocurrency market did not reach a new high with the rise in the market in the second half of 2021, forming a deviation, indicating that the buying power was significantly insufficient compared to May, and the market value was relatively "empty". The market eventually ended here.
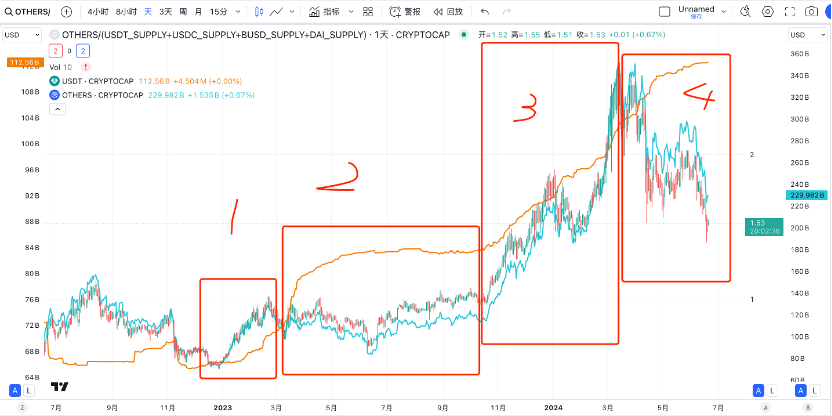
Now let's take a look at the current trend. The figure below is the trend chart since June 2022. The blue line still represents the trend of the total market value of altcoins, and the orange line represents the total market value of USDT (currently, USDT has dominated the stablecoin market in the cryptocurrency market, so using its trend for comparison will not affect the conclusion), used to observe the trend of M in the cryptocurrency market for comparison. The K line "V" still represents the macro leverage ratio of the cryptocurrency market (when calculating V, a relatively comprehensive M total amount is still used).

It can be seen that there are a total of 4 stages in the figure:
From the end of 2022 to March 2023, M (yellow line) and V (K line) increased rapidly at the same time, so the total market value of altcoins (blue line) also increased rapidly.
From the end of March 2023 to the middle of October 2023, M remained flat for a long time, and V also oscillated repeatedly, resulting in the total market value of altcoins lingering for a long time.
Starting from the middle of October, M increased significantly again, and V also rose rapidly. Altcoins ushered in a vigorous market, rising from October 2022 to the middle of March 2023, with many coins increasing by tens or hundreds of times.
However, since the middle of March, M has once again remained flat, while V has decreased significantly, indicating a significant weakness in altcoins since the middle of March.
Looking back at Fisher's formula, MV=PQ, if PQ represents the total market value of altcoins, the premise of the altcoin market is that M and V rise simultaneously. M is easy to observe, just pay attention to the issuance of stablecoins. Since we have constructed the K line about V through Fisher's formula, we now have a basis for predicting the future trend of "V"—judging whether the trend of V is rising or falling through technical analysis.
Therefore, by observing the growth of stablecoin total supply in the cryptocurrency market and the changing trend of V, we can predict the changes in the total market value of the cryptocurrency market in advance, and thus predict the price trend of the cryptocurrency market.

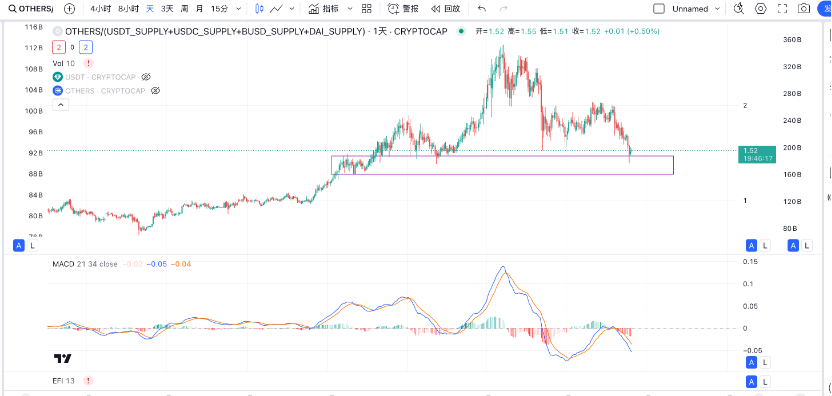
Next is to analyze the future trend of V separately. It is obvious that it is currently in a downtrend. As for how far it will fall, it is hard to say. However, this is not our focus. What we need to focus on is when V will show an upward trend or when the downtrend will end.
But so far, it is temporarily impossible to conclude that the downtrend has ended from the chart and technical indicators. The best case may be to stop falling and oscillate within the support area in the box in the chart, waiting for the technical indicators to recover to a bullish state.
You can also construct this indicator in TradingView for long-term observation and take action at the right time.
To copy the following symbol into TradingView, and feel free to leave a message for discussion: CRYPTOCAP:OTHERS/(GLASSNODE:USDT_SUPPLY+GLASSNODE:USDC_SUPPLY+GLASSNODE:BUSD_SUPPLY+GLASSNODE:DAI_SUPPLY)
Follow me and maximize trend profits with minimal actions.

免责声明:本文章仅代表作者个人观点,不代表本平台的立场和观点。本文章仅供信息分享,不构成对任何人的任何投资建议。用户与作者之间的任何争议,与本平台无关。如网页中刊载的文章或图片涉及侵权,请提供相关的权利证明和身份证明发送邮件到support@aicoin.com,本平台相关工作人员将会进行核查。


