This article is only a personal market view and does not constitute investment advice. If you operate according to this, you are responsible for your own gains and losses.
In the article on the 11th, the views on BTC, SOL, and ETH were mentioned. Today, let's review and update the opinions in the article.
During the night's pullback, all three varieties temporarily stopped falling at their respective support levels. The key going forward is whether they will break through today's support levels.
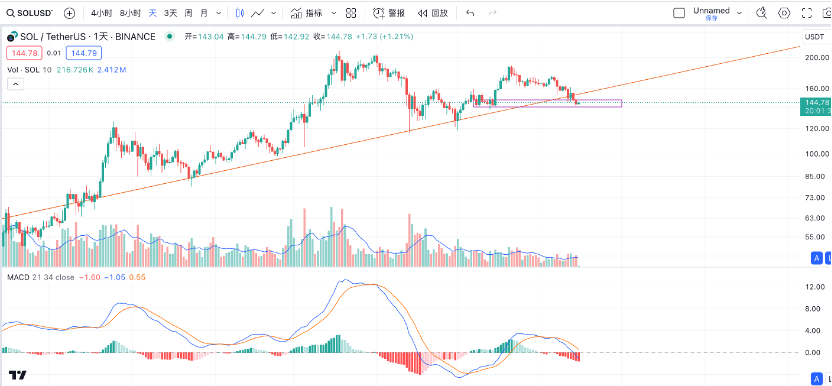
Sol's pullback during the night is close to the target position, currently finding temporary support in the dense trading area near the beginning of May (see the box in the image below). The concerning factor is that the decline has not yet seen a significant increase in trading volume and has already broken the uptrend line. The MACD is still in a bearish state, so if it breaks through this support range, it is likely to continue to pull back further, with the next level to watch being around 120.
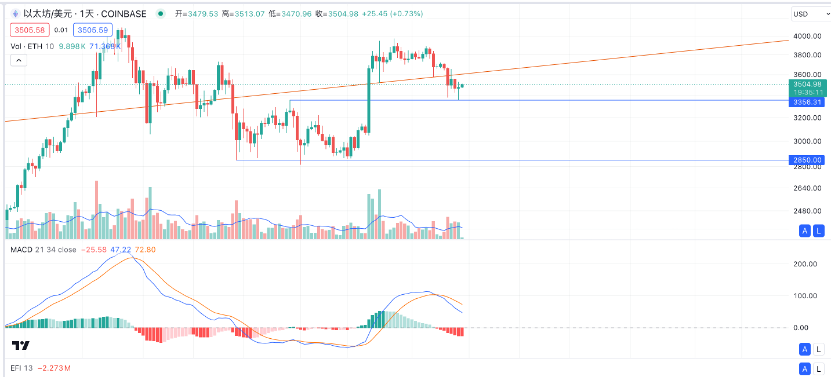
Next, let's look at ETH, which is also showing weak performance. It recently formed a daily head and shoulders pattern. On the night of the CPI announcement on Wednesday, it rebounded briefly with the help of positive data but was quickly pushed back down. Currently, the price continues to run below the neckline of the head and shoulders pattern, and the daily technical indicators are bearish. During the night's pullback, the price found support around 3360, which is also the high point of the rebound on April 28. If it falls below this level again, it will likely erase the large bullish candlestick from May 20. According to the head and shoulders pattern, the corresponding pullback position is likely to be below 3200.
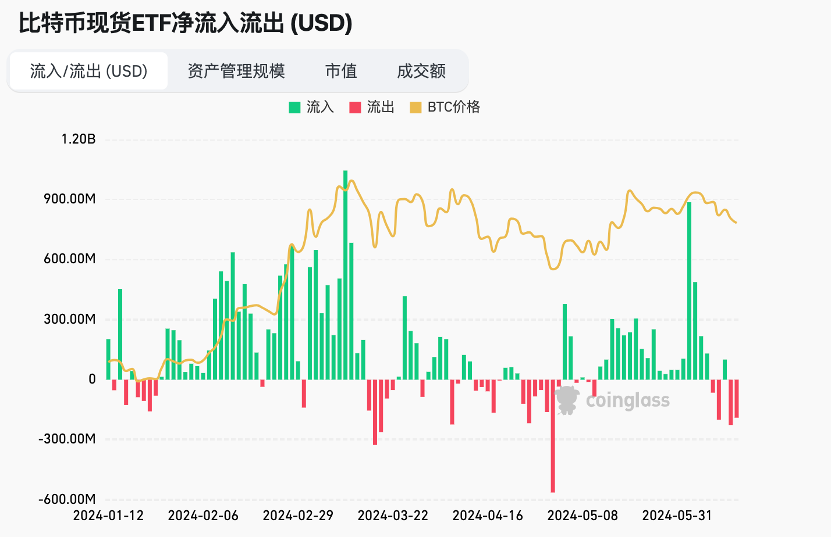
Finally, let's focus on BTC. Since the approval of BTC's spot ETF, its price trend has been highly correlated with the net inflow of BTC. In recent days, the ETF has once again shown a net outflow, and the total amount of stablecoins within the crypto community has remained relatively unchanged since the end of April. Therefore, in the absence of incremental funds, it is understandable that BTC's price trend is noticeably weak.
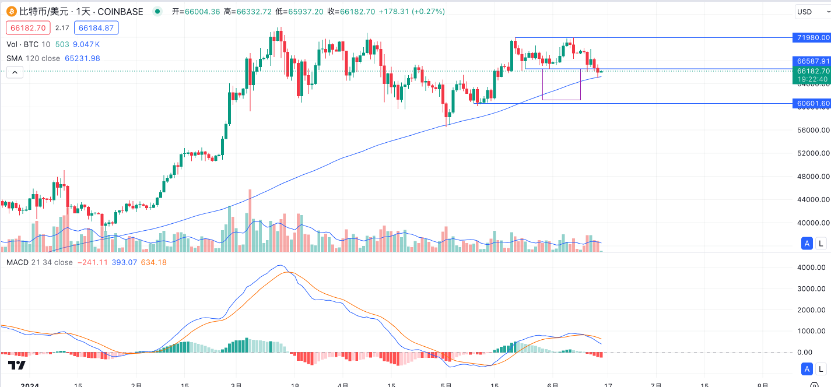
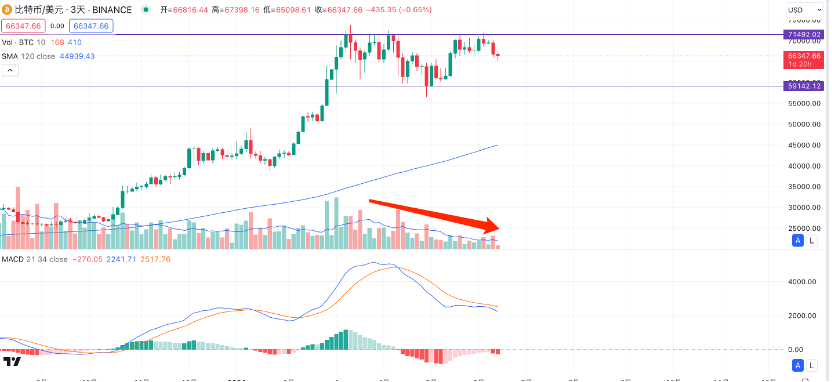
As mentioned in the article on the 11th, the area around 66,000 is a key level, and breaking below it would form a short-term M-top pattern. From the chart below, the corresponding pullback position is around 61,000. The night's pullback found support at the 120-day moving average. If it cannot hold here, then the 61,000 level is likely to be tested.
In the past few months, weekends have generally seen relatively quiet market conditions. We will have to wait until the opening of next Monday to see BTC's subsequent trend. However, I personally believe that the 120-day moving average is unlikely to hold.
Since the end of February, the trend has clearly shown a wide-ranging oscillation. Trading volume has gradually decreased, and the daily and 3-day indicators are currently bearish. Therefore, I believe that this range-bound trend will eventually tend towards perfection—meaning the price will once again pull back to near the lower boundary of the range to find support. Once there is a surge in trading volume near the lower boundary, it will be a clear buy signal. Looking upwards, a surge in volume breaking through this range-bound trend would be a strong signal to add to positions. And due to the prolonged oscillation, once it breaks through, it will surely initiate a new and vigorous market trend.
Furthermore, I believe many investors have high hopes for altcoins in this round, but the market in the past six months has been torturous for those heavily invested in altcoins. From the perspective of BTC's market dominance, let's take a look at when altcoins might have an opportunity.
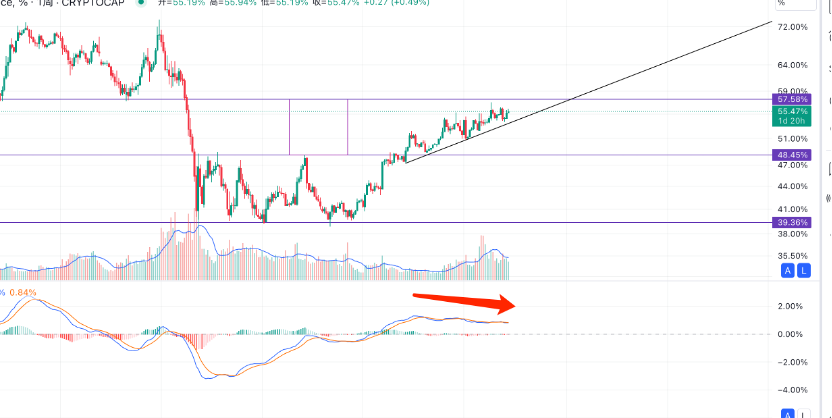
The chart below shows BTC's market dominance. From the chart, BTC's market dominance has shown a rectangular trend from May 21 to May 23 over the past two years, with the bullish target market dominance level around 57.58%. The current trend in market dominance is showing a divergence uptrend on the weekly level, gradually moving towards the target level.
Based on this, I have two judgments:
1. The market dominance level of 57.58% will definitely be reached, and perhaps slightly exceeded. Once reached, BTC's market dominance will peak, and the bull market will officially enter the second half.
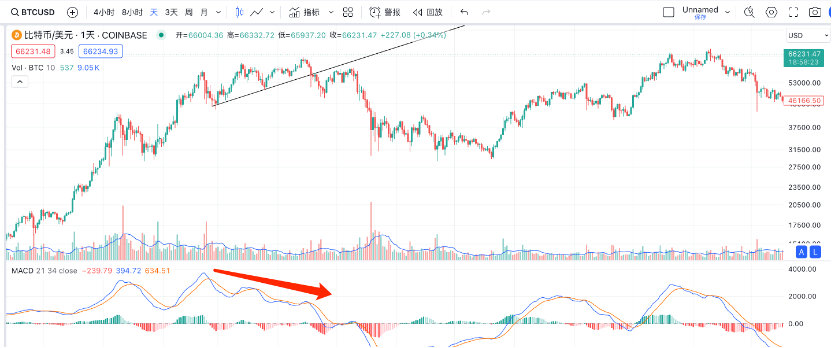
2. Once BTC's market dominance falls below the uptrend line, it will be unable to recover subsequently. This kind of long-term divergence uptrend, once it breaks the trend line, will basically lead to a rapid decline. This corresponds to the rise in altcoin market dominance. The chart below shows the long-term divergence uptrend at the top of BTC in 2021, and the subsequent trend after breaking the trend line. Take a look and see if it sparks some anticipation. For those heavily invested in altcoins, it's too torturous if there's no anticipation at all.
Follow me and maximize trend profits with minimal operations.

免责声明:本文章仅代表作者个人观点,不代表本平台的立场和观点。本文章仅供信息分享,不构成对任何人的任何投资建议。用户与作者之间的任何争议,与本平台无关。如网页中刊载的文章或图片涉及侵权,请提供相关的权利证明和身份证明发送邮件到support@aicoin.com,本平台相关工作人员将会进行核查。


