
Source: Techopedia
Compiled by: WEEX Exchange
In the fast-paced world of digital currency, Bitcoin has become a phenomenal presence, attracting the attention of global investors. The core of this revolutionary cryptocurrency is a process called "mining," which drives the operation of Bitcoin and has a significant impact on the entire blockchain ecosystem. This article will delve into the statistics of Bitcoin mining and energy consumption, and why "mining" is crucial for the development of both Bitcoin and the environment.
Whether you are an experienced investor or a newcomer to the cryptocurrency field, understanding the ins and outs of Bitcoin mining is essential to grasp the true potential of this digital asset. Therefore, let's delve into the fascinating world of Bitcoin mining, elucidate its importance, and provide you with the key information you need to know.
Compilation of Bitcoin Mining Statistics
- In May 2023, the annual electricity consumption of global Bitcoin mining was approximately 95.58 terawatt-hours (TWh).
- It is estimated that Bitcoin consumes 60%-77% of the global electricity used for cryptocurrencies.
- Bitcoin mining has a total market value of $81.1 billion.
- Miners earn a daily income of $27.7 million.
- The United States has the largest Bitcoin mining industry globally, accounting for over 38% of the Bitcoin network's hash rate.
Bitcoin Mining Energy Consumption Statistics
Bitcoin mining energy consumption has become a widely scrutinized topic of concern. With the widespread adoption and soaring value of Bitcoin, the energy required for mining new coins and maintaining the blockchain has also increased.
According to The New York Times, in the early days of Bitcoin, when its followers were limited, a desktop computer could effortlessly mine cryptocurrency in a matter of seconds. However, today, mining a single Bitcoin requires approximately "9 years of typical household electricity consumption." In May 2023, Bitcoin mining was estimated to consume around 95.58 terawatt-hours of electricity, surpassing Finland's national electricity consumption for the entire year of 2022.
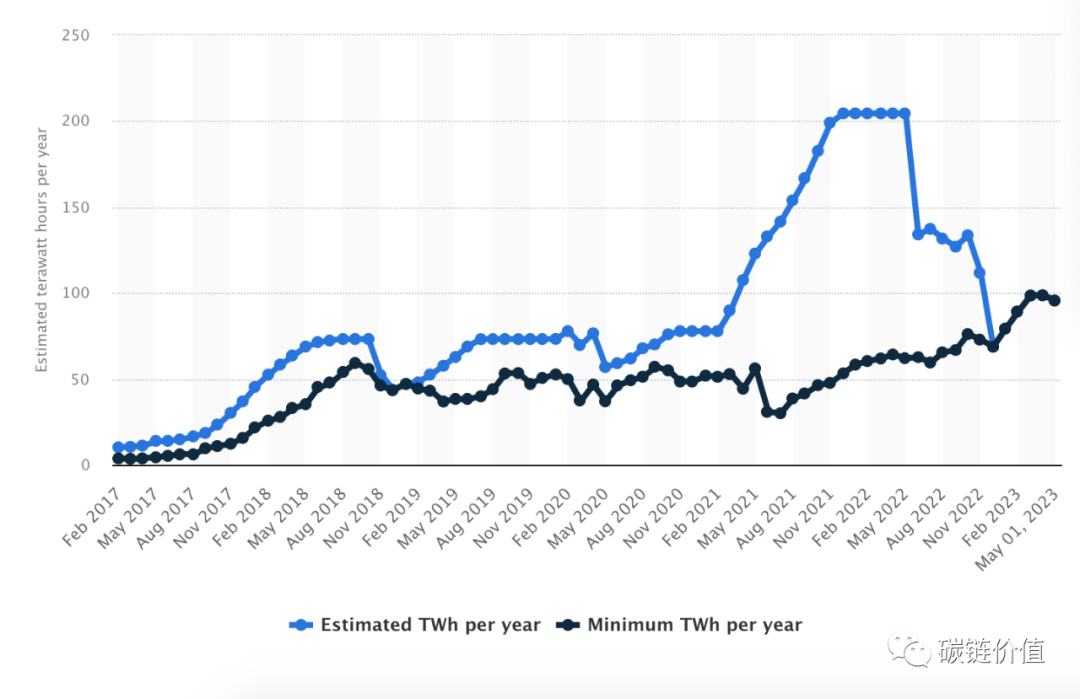 Figure 1: Estimated electricity consumption of Bitcoin mining, minimum electricity consumption (TWh/year)
According to a White House report, the energy consumed by Bitcoin mining in the United States in 2022 amounted to 500 billion kilowatt-hours (kWh), highlighting the immense scale of energy usage. The electricity consumed by Bitcoin mining exceeds the total energy consumption of all computers running in the United States. Of course, the electricity consumption of Bitcoin mining itself is also included in the national electricity consumption data.
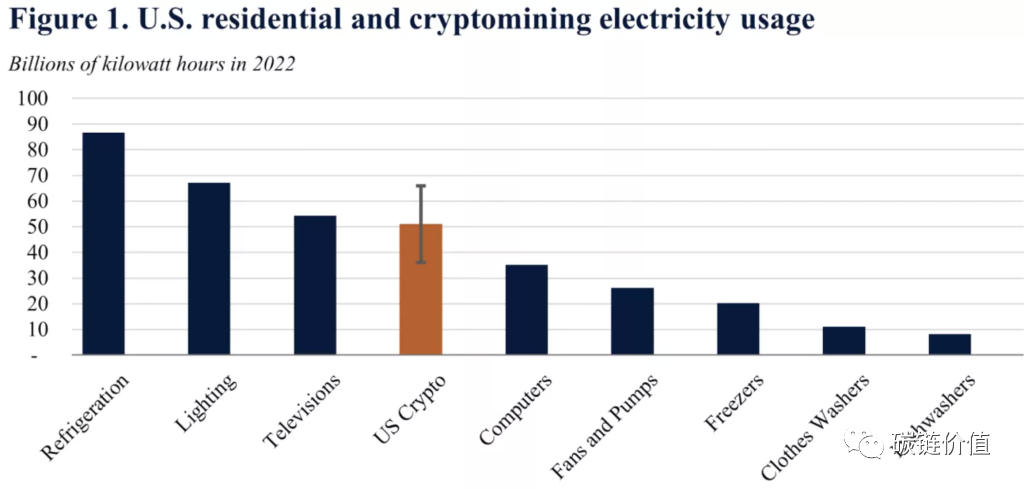 Figure 2: A comparison of household electricity consumption and cryptocurrency mining electricity consumption in the United States
The above figure shows the ranking of different household electricity consumption scenarios in the United States, from highest to lowest: cooling, lighting, television, Crypto, computer, fan and pump, freezer, washing machine, dishwasher (as of August 2022, Bitcoin is estimated to account for 60%-77% of all Crypto electricity consumption, as noted by WEEX).
It takes 1,449 kilowatt-hours of electricity to process (mine) a single Bitcoin transaction, roughly equivalent to the electricity consumption of an average U.S. household for 50 days. In monetary terms, the average cost of 1 kilowatt-hour of electricity in the United States is 12 cents, meaning that processing a single Bitcoin transaction requires approximately $173 in electricity costs.
The energy consumed by Bitcoin mining accounts for approximately 0.5% of the total global energy consumption, more than 7 times higher than the total energy consumption of Google's global operations. When comparing the energy consumption of the Bitcoin network with the electricity consumption of various countries, it ranks 34th globally (just behind the Netherlands and ahead of Kazakhstan, as noted by the editor).
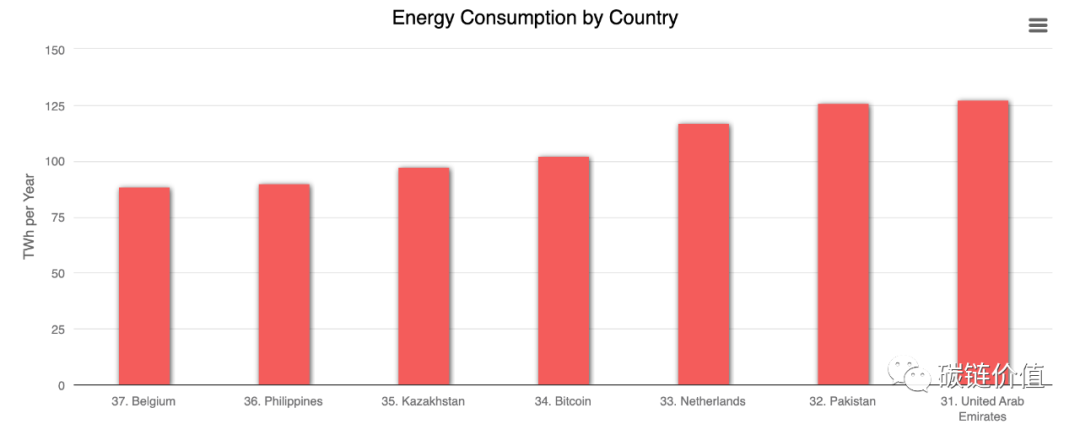 Figure 3: Ranking of energy consumption by country
The energy consumption of a single Bitcoin transaction is equivalent to the energy consumption of nearly 100,000 Visa card transactions. In May 2023, the electricity consumption per Bitcoin transaction reached 703.25 kilowatt-hours, while the electricity consumption of a Visa card transaction was only 148.63 kilowatt-hours.
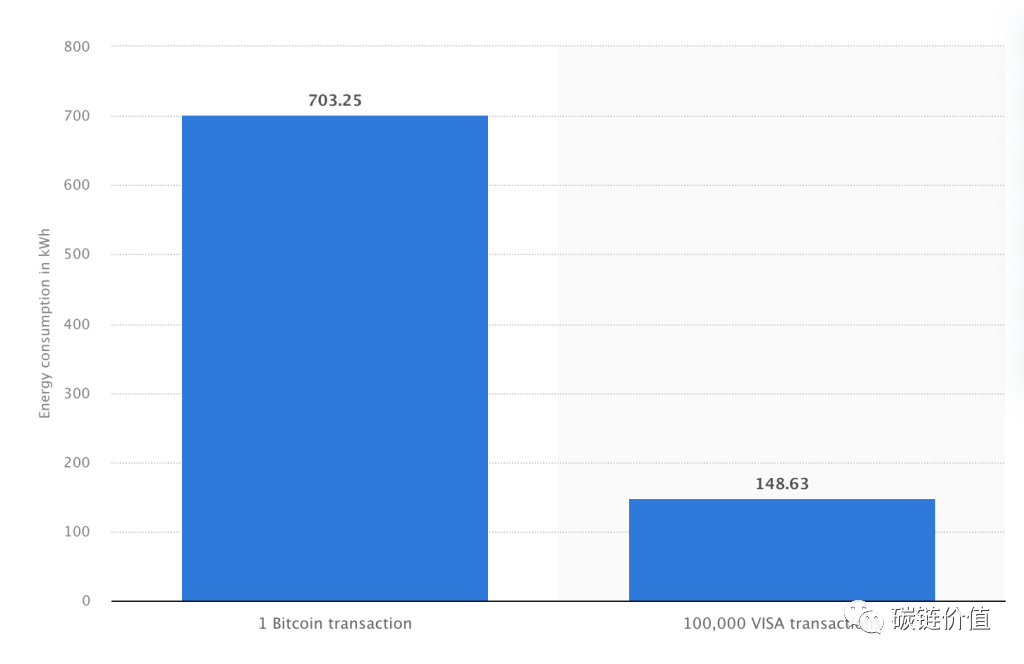 Figure 4: Energy consumption of Bitcoin transactions vs. Visa card transactions
1) How to Calculate the Energy Consumption of Bitcoin Mining?
Determining the exact energy consumption of Bitcoin mining is challenging due to many influencing factors, including:
- The decentralized nature of Bitcoin mining
- Lack of standardized reporting requirements
- Dynamic and constantly changing mining patterns
- Different sources of electricity used by miners
- The private and confidential nature of mining operations
Accurately estimating energy usage often relies on assumptions, approximations, and statistical models based on available data. An infographic published by Digiconomist reveals the challenges of accurately measuring Bitcoin energy consumption. Given that electricity costs are a significant ongoing expense, the total power consumption of the Bitcoin network is closely related to miners' income.
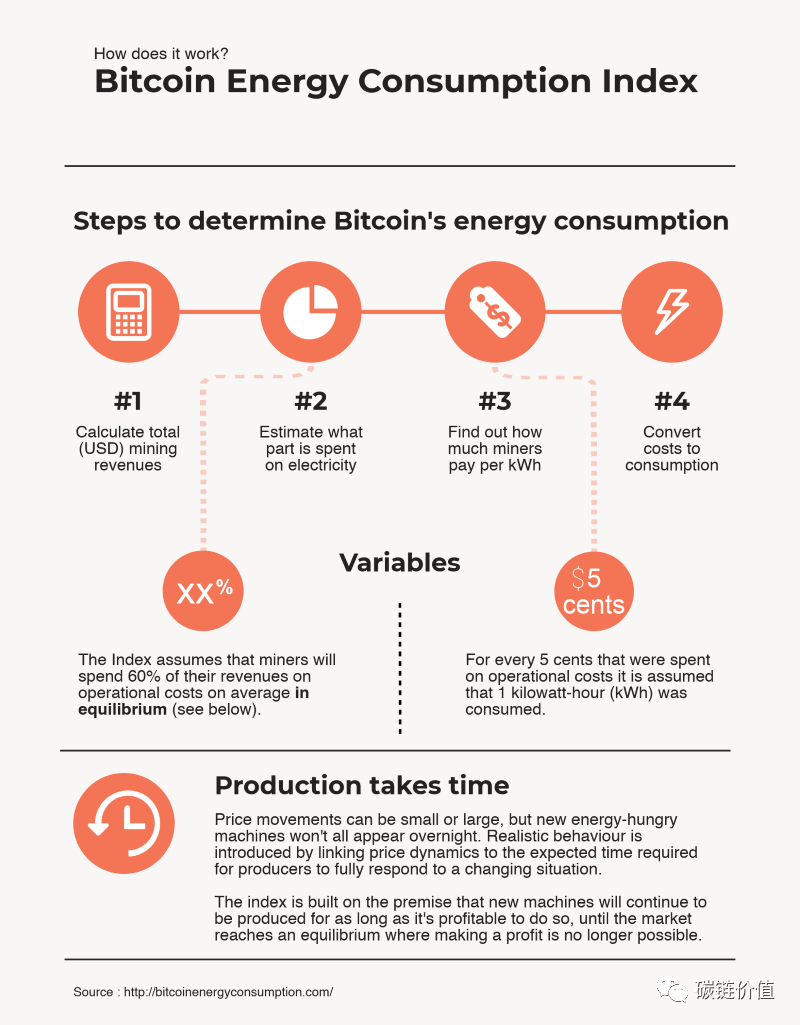 Figure 5: Steps to determine the energy consumption of Bitcoin mining
2) U.S. Bitcoin Mining Facilities and Energy Data
The New York Times listed 34 large Bitcoin mining facilities in the United States, all of which consume significant amounts of energy. The operation of these facilities generates costs, such as increased electricity bills and substantial carbon emissions, affecting nearby individuals. Among these 34 mining projects, the electricity consumption of each project is at least 30,000 times the average electricity consumption of U.S. households. These businesses collectively consume over 3,900 megawatts of electricity, nearly equivalent to the electricity consumption of around 3 million households in the vicinity.
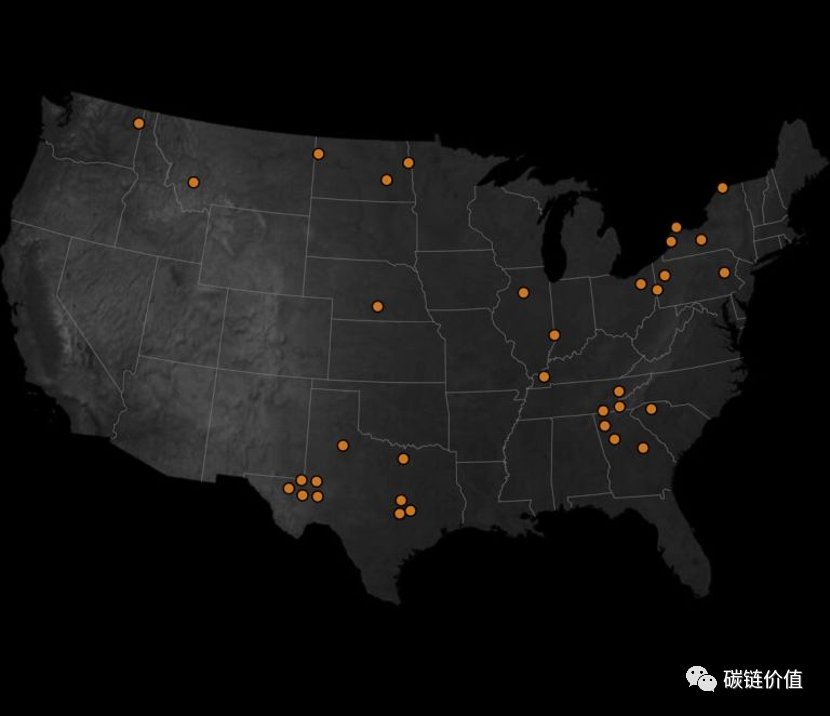 Figure 6: Distribution of large Bitcoin mining facilities in the United States
A Bitcoin mining facility in Kearney, Nebraska, consumes the same amount of electricity as approximately 73,000 nearby households. A mining facility in Dalton, Georgia, consumes electricity equivalent to approximately 97,000 nearby households. The Riot Platform mining facility in Rockdale, Texas, is the largest Bitcoin mining facility in terms of electricity consumption in the United States, with its electricity consumption equivalent to that of approximately 300,000 households in the vicinity.
The Riot facility is located near the Bitdeer mining facility, and their combined electricity consumption exceeds the total electricity consumption of all households within a 40-mile radius.
Cryptocurrency miners in Texas have secured long-term contracts, ensuring significant discounts on electricity prices for up to ten years.
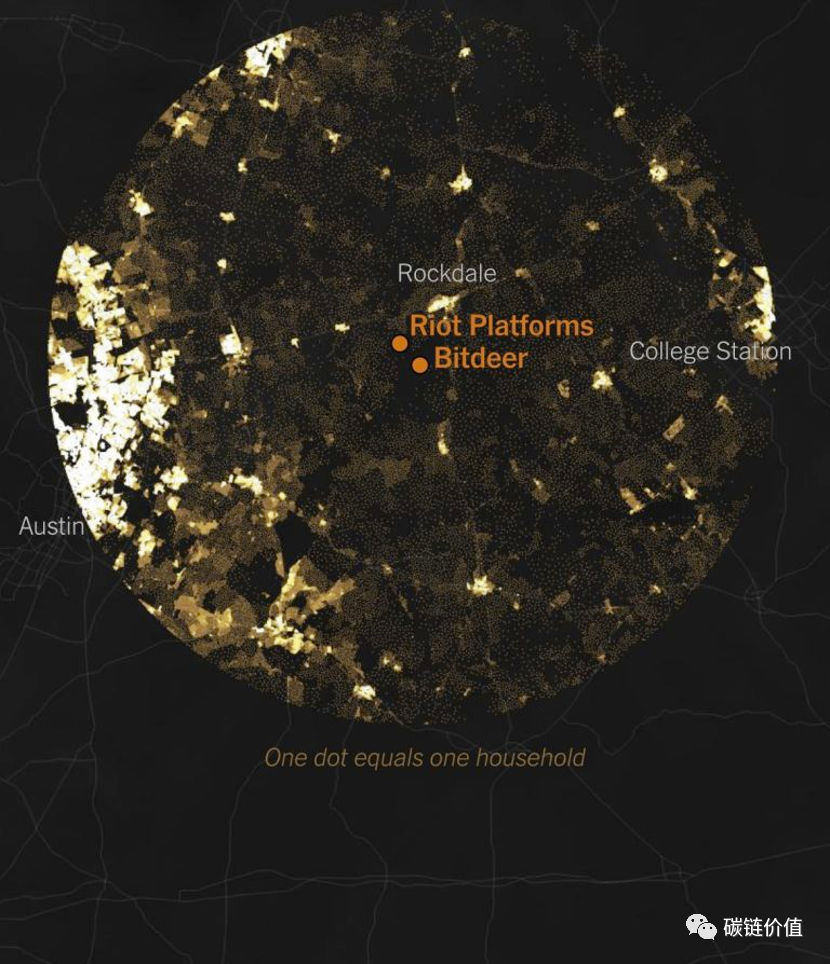 Figure 7: Distribution of Bitcoin mining facilities in Texas
3) Climate Change and Bitcoin Mining and Energy Consumption
As of August 2021, the average emission factor of the Bitcoin network is 557.76 grams of CO2 per kilowatt-hour (gCO2/kWh), with an estimated power load demand of 13.39 gigawatts (GW), resulting in an annual emission of approximately 65.4 million tons of carbon dioxide (MtCO2) from Bitcoin mining.
The carbon footprint of Bitcoin mining can be estimated based on the electricity sources used by miners. The following figure represents the global carbon footprint of Bitcoin mining, which is comparable to the emissions of countries such as Greece (56.6 MtCO2 in 2019), accounting for 0.19% of the total global emissions.
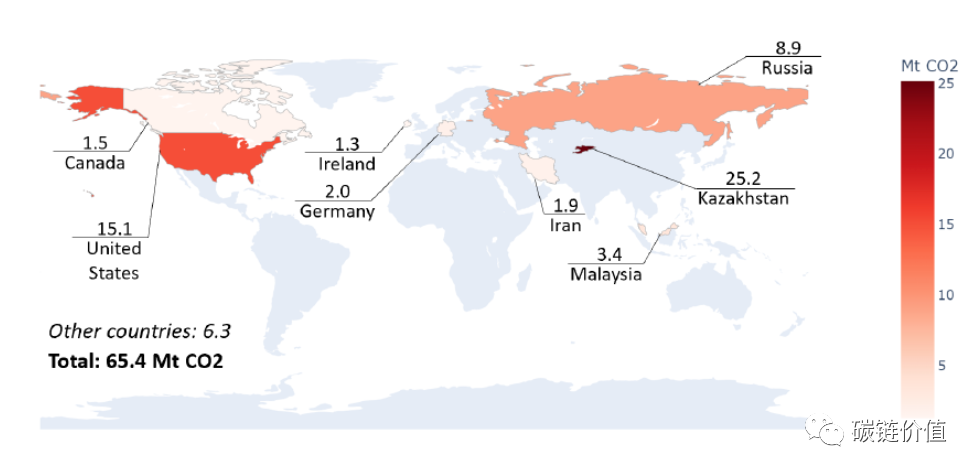 Figure 8: Carbon footprint of Bitcoin mining
As of May 2021, Bitcoin mining generated approximately 31,000 tons of electronic waste annually. By June 2022, this figure had risen to 35,000 tons per year, equivalent to the annual electronic waste output of the entire Netherlands.
For example, the Greenidge LLC natural gas power plant in New York, when conducting behind-the-meter Bitcoin mining, emits approximately 88,440 tons of carbon dioxide equivalent annually. Assuming that all the electricity generated by the power plant is used for Bitcoin mining, the annual emissions would reach 656,983 tons of carbon dioxide equivalent.
Approximately 79% of total greenhouse gas emissions come from electricity generation, making it the primary source of emissions. If a power plant operates at full capacity, its annual emissions are equivalent to the emissions from approximately 140,000 cars or the emissions produced by burning 600 million pounds of coal.
4) Benefits Behind the Energy Consumption of Bitcoin Mining
To address the adverse impacts of Bitcoin mining, the Bitcoin Mining Council (BMC) – a global forum composed of mining companies representing 48.4% of the Bitcoin network's hash rate – revealed that operational data for the fourth quarter of 2022 showed that renewable energy accounted for 58.9% of Bitcoin mining electricity consumption. This marks a significant increase compared to the estimated value of 36.8% reported in the first quarter of 2021.
Furthermore, a research paper released by the Bitcoin Clean Energy Initiative memorandum reports that Bitcoin mining machines are an ideal complementary technology for renewable energy and storage. Other key highlights of Bitcoin mining emphasized in the research paper include:
- Bitcoin mining can accelerate the global transition to renewable energy.
- Bitcoin mining can encourage investment in solar energy, with electricity costs potentially remaining unchanged.
Market Size and Revenue Statistics of Bitcoin Mining
Bitcoin mining, the process of verifying transactions and securing the network, has evolved into a fiercely competitive industry, leading to exponential growth in its market size and revenue. This market has become highly profitable, with a large number of global participants, including individual miners and large mining operators.
At the same time, the price of Bitcoin broke through $65,000 in November 2021, reaching a historic high for cryptocurrencies. As of June 2023, the market value of Bitcoin reached $597.8 billion.
The maximum supply of Bitcoin is set at 21 million coins, ensuring scarcity, which is an important factor in promoting the value of Bitcoin. As of March 2023, over 19 million Bitcoins have been mined, leaving approximately 2 million yet to be mined. Once the threshold of 21 million coins is reached, no new Bitcoins will be mined.
This scarcity, in turn, supports the total market value of Bitcoin mining, which currently stands at $81.1 billion.
1) Data on the Largest Bitcoin Mining Companies
A list compiled by CompaniesMarketCap includes the valuations of the 16 largest publicly traded Bitcoin mining companies. Among them, Marathon Digital Holdings is the largest Bitcoin miner, with a market value of $2.27 billion.
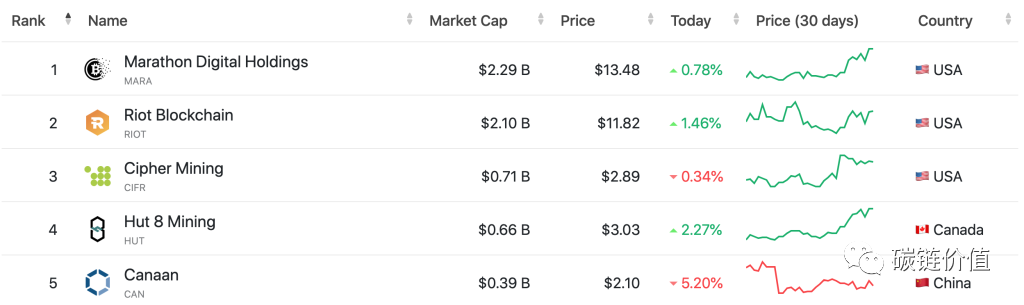 Figure 9: Market value of Bitcoin mining companies Top5
It is worth noting that this list does not include some smaller publicly traded mining companies and many unlisted cryptocurrency mining companies.
In terms of revenue, Canaan is the top-ranked publicly traded mining company, reporting a total revenue of $650 million in 2022. The revenue of Chinese Bitcoin mining companies mainly comes from Bitcoin mining machine sales.
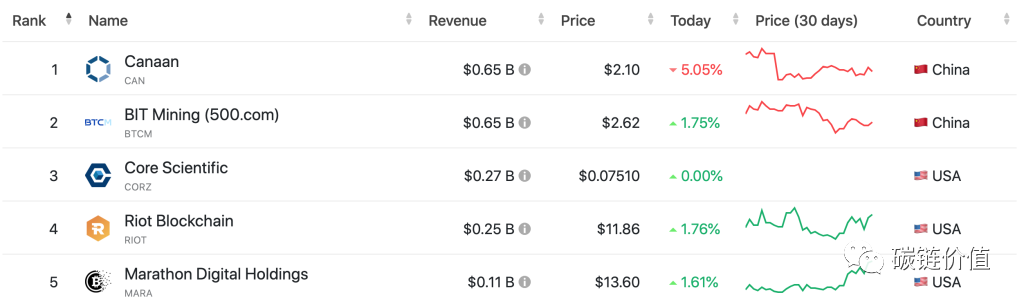 Figure 10: Revenue of Bitcoin mining companies Top5
In terms of earnings (EBITDA), Canaan is also the top-ranked publicly traded mining company, with total earnings of $92.33 million in 2022. In 2021, the company's profits significantly improved, reaching $300 million, a significant improvement from the loss of $31.20 million in 2020.
2) Bitcoin Mining Revenue Data
As of June 26, 2023, Bitcoin miners generated a daily income of $27.7 million, a significant increase of 52.20% from the same period last year, when it was $18.2 million. In April 2021, Bitcoin miners achieved their highest daily income since 2018, reaching $80.12 million (mainly due to the increase in BTC Gas fees from Ordinals and BRC20, as noted by WEEX).
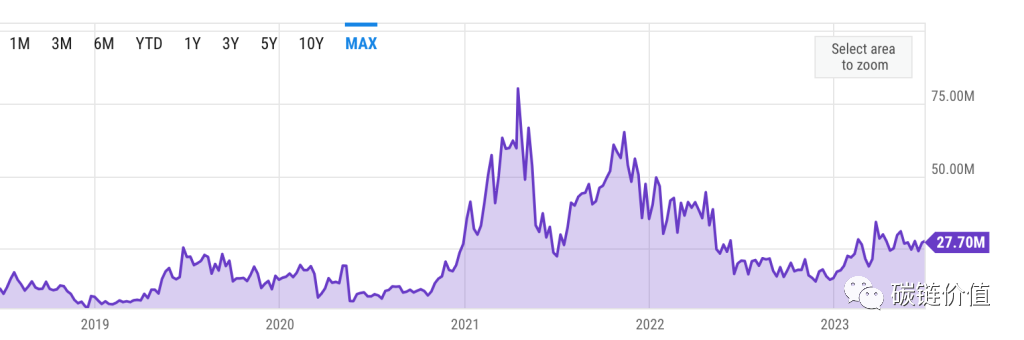 Figure 11: Change in Bitcoin miner income
According to Glassnode, on June 27, 2023, Bitcoin miners transferred a record $128 million worth of BTC to exchanges.
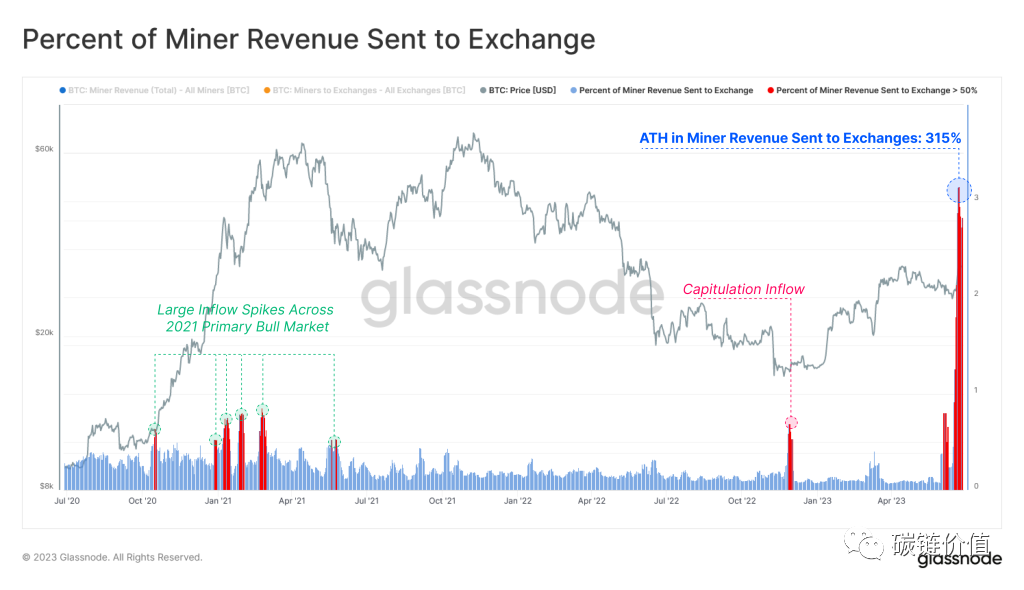 Figure 12: BTC transferred to exchanges by miners
3) Sources of Bitcoin Mining Income
Miners' income comes from two sources: Bitcoin block rewards and transaction fees.
Bitcoin rewards are obtained by miners who successfully mine blocks in the blockchain system. Miners add them to the head of the block to claim the rewards.
Approximately every four years, the reward for successfully mining a new block in the Bitcoin network is halved. When Bitcoin was first introduced, the mining block reward was 50 Bitcoins. As of June 2023, the mining reward for a new block is 6.25 Bitcoins, with a new block being produced approximately every 10 minutes. The next halving is expected in 2024, when the block reward will decrease to 3.125 BTC.
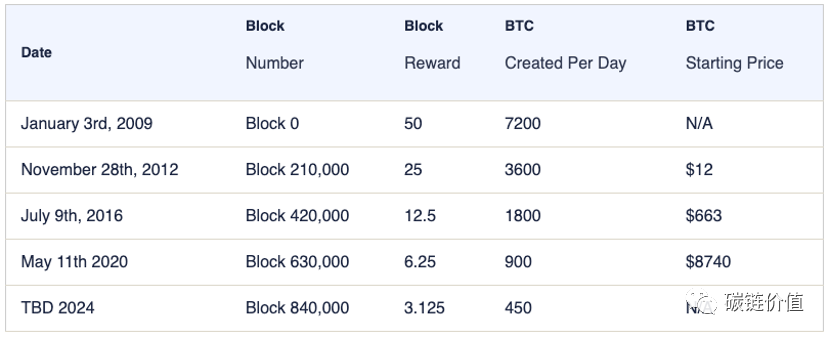 Figure 13: Bitcoin halving events
Bitcoin undergoes a halving approximately every 210,000 blocks, until around 2140, when all 21 million Bitcoins will have been mined. Once the block reward reaches 0, miners will only receive transaction fees as a reward. Users pay transaction fees to have miners include their transactions in the Bitcoin blockchain. Users can also incentivize miners to prioritize their transactions by increasing the transaction fees.
As of June 28, 2023, the average Bitcoin transaction fee is $2.226, higher than $1.168 12 months ago. This data has the potential for further growth, similar to the peak in April 2021, when it reached close to $62.79.
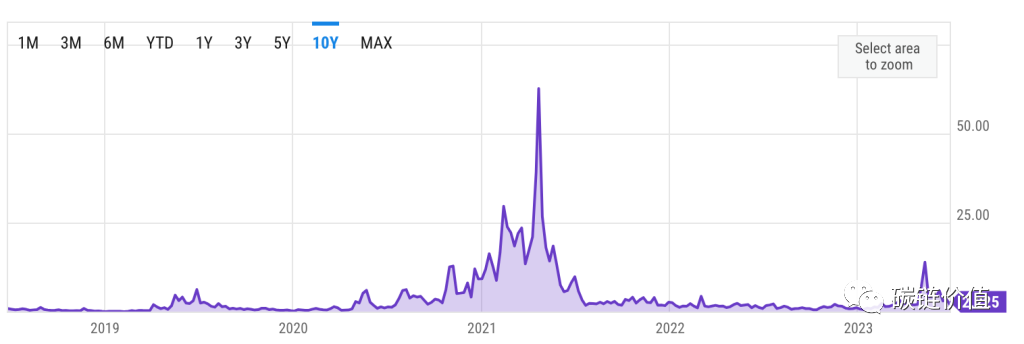 Figure 14: Bitcoin Gas fees
Bitcoin transaction fees may depend on several factors:
- Network congestion
- Transaction data size
- Required confirmation time
Fee calculations are usually based on transaction size (in bytes) rather than transaction amount. As of June 28, 2023, the average block size is 1.69 MB. Miners with higher hash rates have a better chance of adding new blocks to the blockchain, thereby earning block rewards and transaction fees.
In the context of Bitcoin mining, hash rate refers to the computing power or speed at which mining equipment or networks can perform cryptographic calculations (known as hash operations).
Driven by profit and returns, miners typically choose which coins to mine based on financial criteria, including factors such as daily reward amounts or the prices of different cryptocurrencies.
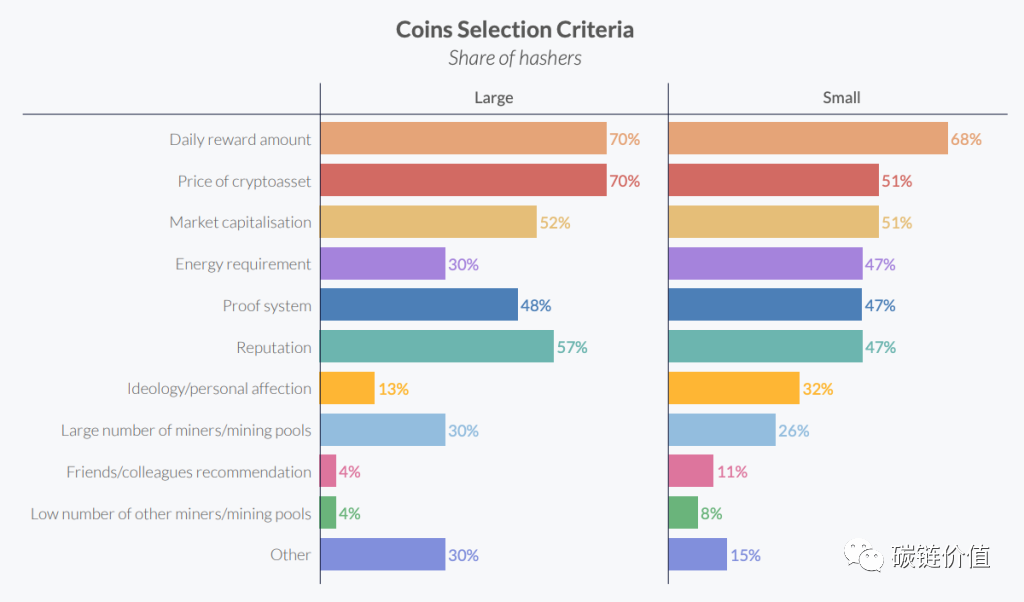 Figure 15: Token selection criteria
In May 2023, the hash rate index report showed an average hash rate price of $82.23/PH/day (equivalent to 0.00298 BTC/PH/day), a 5.6% increase from the average of $77.87/PH/day (equivalent to 0.00270 BTC/PH/day) in April.
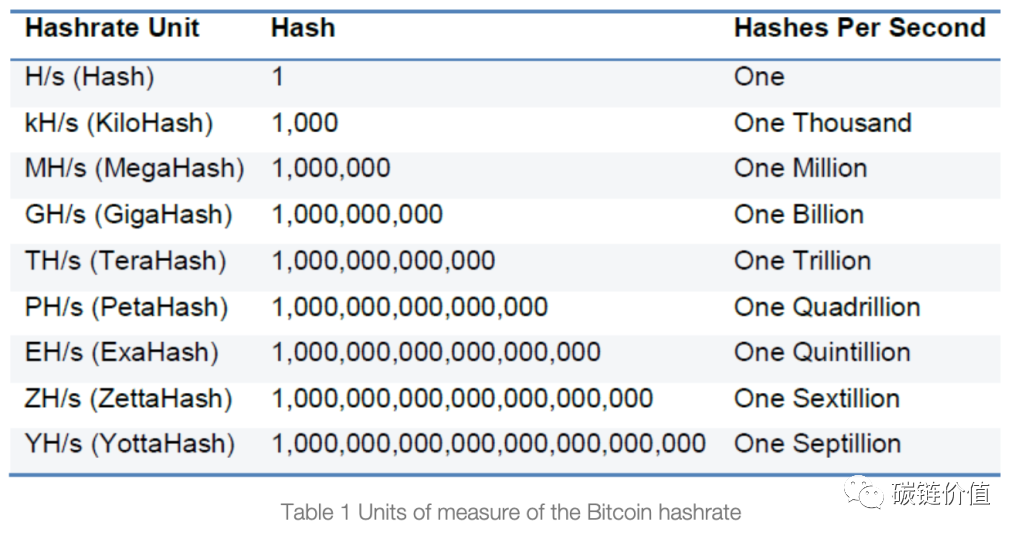 Figure 16: Bitcoin hash rate measurement units
In May 2023, miners collectively earned 33,365 BTC (equivalent to $9.185 billion), an increase of 20% from the 27,743 BTC (equivalent to $8.008 billion) earned in April. In these earnings, transaction fees contributed 4,540 BTC (equivalent to $1.258 billion), a 459% increase compared to 812 BTC (equivalent to $23.5 million) in April.
Bitcoin Mining Country Statistics Data
From major countries like China and the United States to countries like Kazakhstan and Russia, different nations have complex influences on the global Bitcoin mining landscape.
1) Bitcoin Mining in China Using Hydropower
Before banning Bitcoin mining in June 2021, China was an undisputed leader in providing hash power and consuming electricity, with nearly 50% of the network's hash power. This ban significantly impacted mining activities from China, leading to a substantial decrease in hash power.
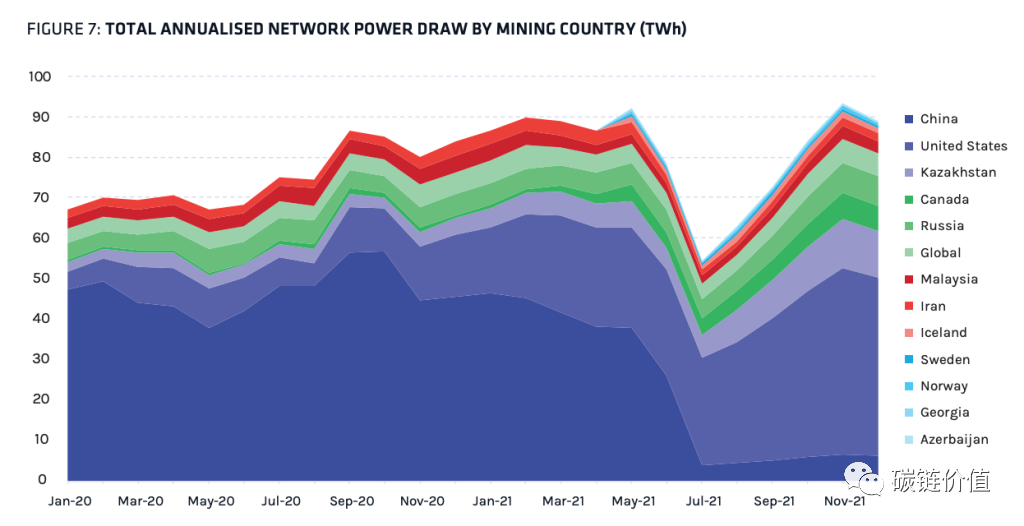 Figure 17: Electricity consumption for mining by country (terawatt-hours)
According to the Cambridge Bitcoin Electricity Consumption Index (CBECI), China was once the world's largest cryptocurrency mining center, accounting for 65% to 75% of the total hash power of the global Bitcoin network at its peak. China's monthly average hash rate share decreased from 75.5% in September 2019 to 22.3% in September 2021, a decrease of over 50%.
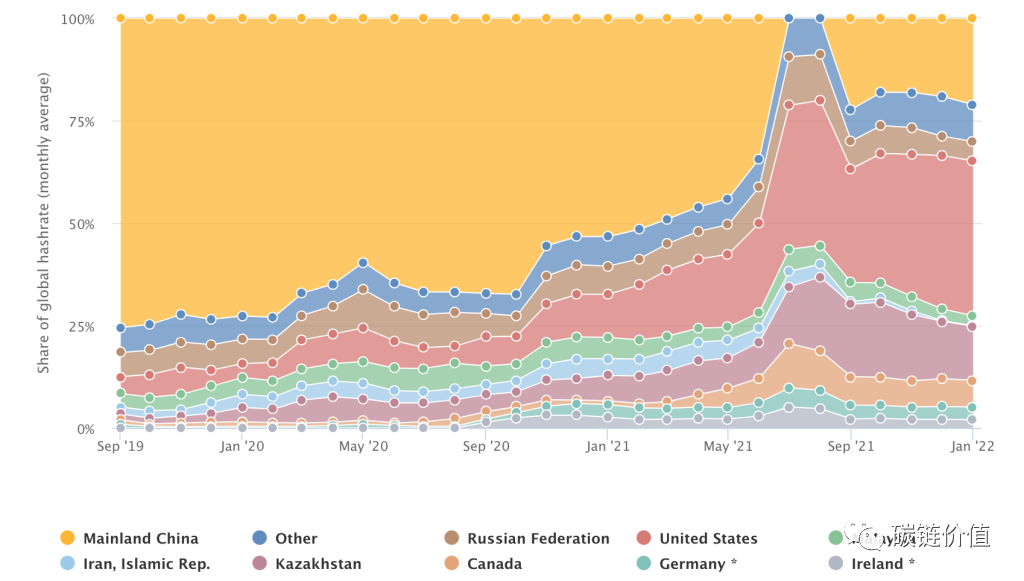 Figure 18: Evolution of the Bitcoin mining market landscape
During China's summer flood season, some regions have abundant hydropower resources, leading to lower electricity costs. Miners took advantage of this and shifted or expanded their operations to regions with abundant hydropower resources, such as Sichuan. At the start of the flood season in 2020, Sichuan accounted for 14.9% of China's total hash power, a number that peaked at 61.1%. In contrast, Xinjiang, which mainly relies on coal power, saw its hash power share decrease from 55.1% at the start of the rainy season to a low of 9.6% during the same period.
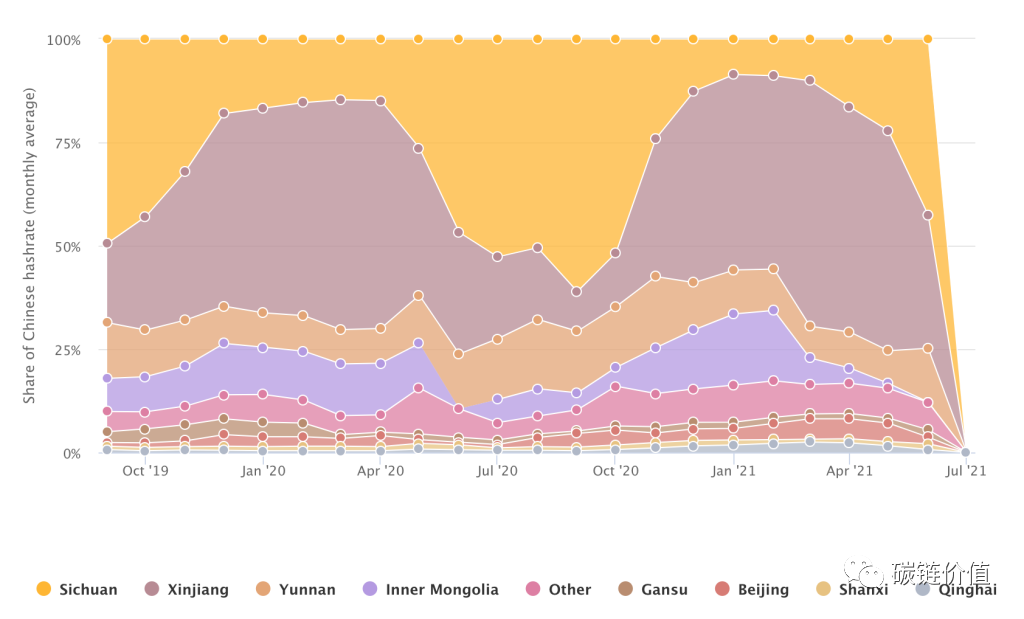 Figure 19: Bitcoin mining areas in China
2) Bitcoin Mining Statistics in the United States
The United States is the largest Bitcoin mining region globally, accounting for over 38% of the total hash power of the Bitcoin network. From January 2020 to January 2022, the share of Bitcoin mining in the United States saw a significant increase, rising from 4.5% to 37.8%.
The share of hash power in Georgia is the highest in the United States, accounting for 30.8% of the national total in December 2021. Texas ranks second with a share of 11.2%, and Kentucky ranks third with a share of 10.9%.
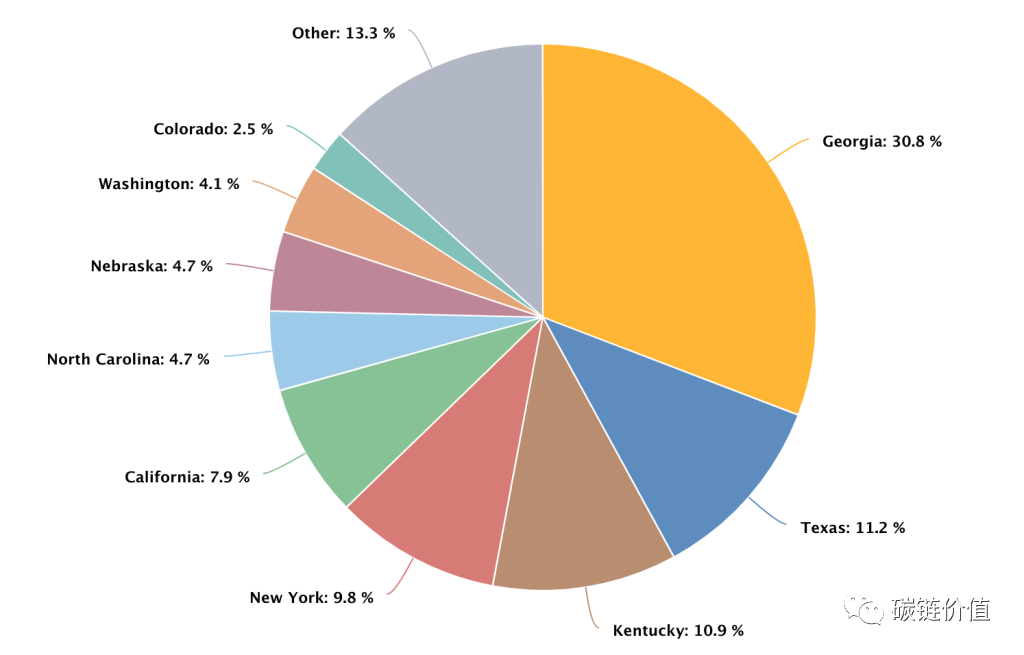 Figure 20: Bitcoin mining share by state in the United States
The mining cost in Hawaii is $54,862.05, with a profit of -$24,617.20, making it the most expensive state for mining Bitcoin.
The following chart shows the top 10 states with the most expensive cost to mine one Bitcoin (in order: Hawaii, Alaska, Connecticut, Rhode Island, Massachusetts, California, New Hampshire, Vermont, New York, New Jersey, as noted by WEEX).
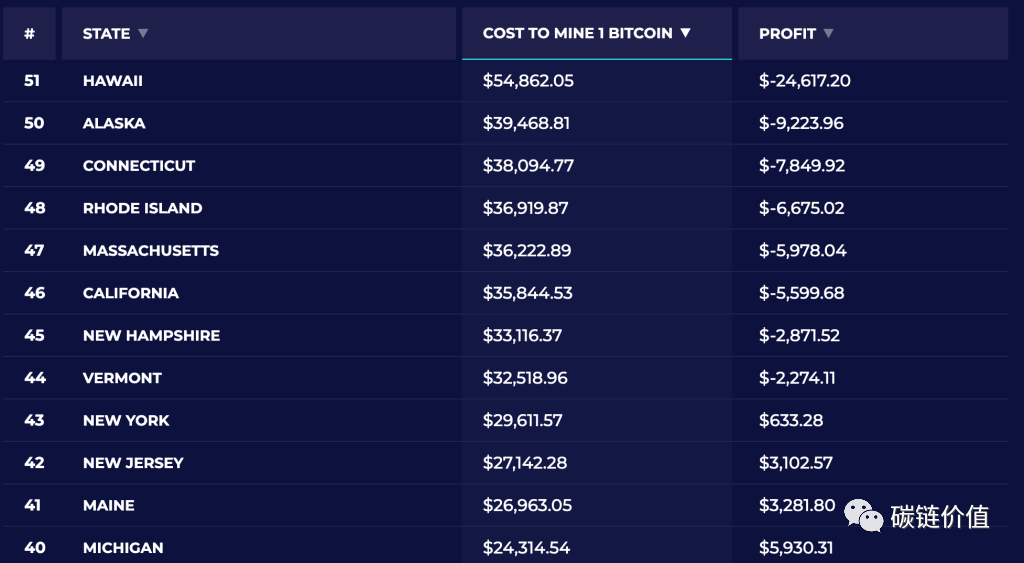 Figure 21: Top 10 states with the highest mining costs in the United States
Louisiana has the lowest cost, with a total cost of $14,955.14 and a profit of $15,289.71.
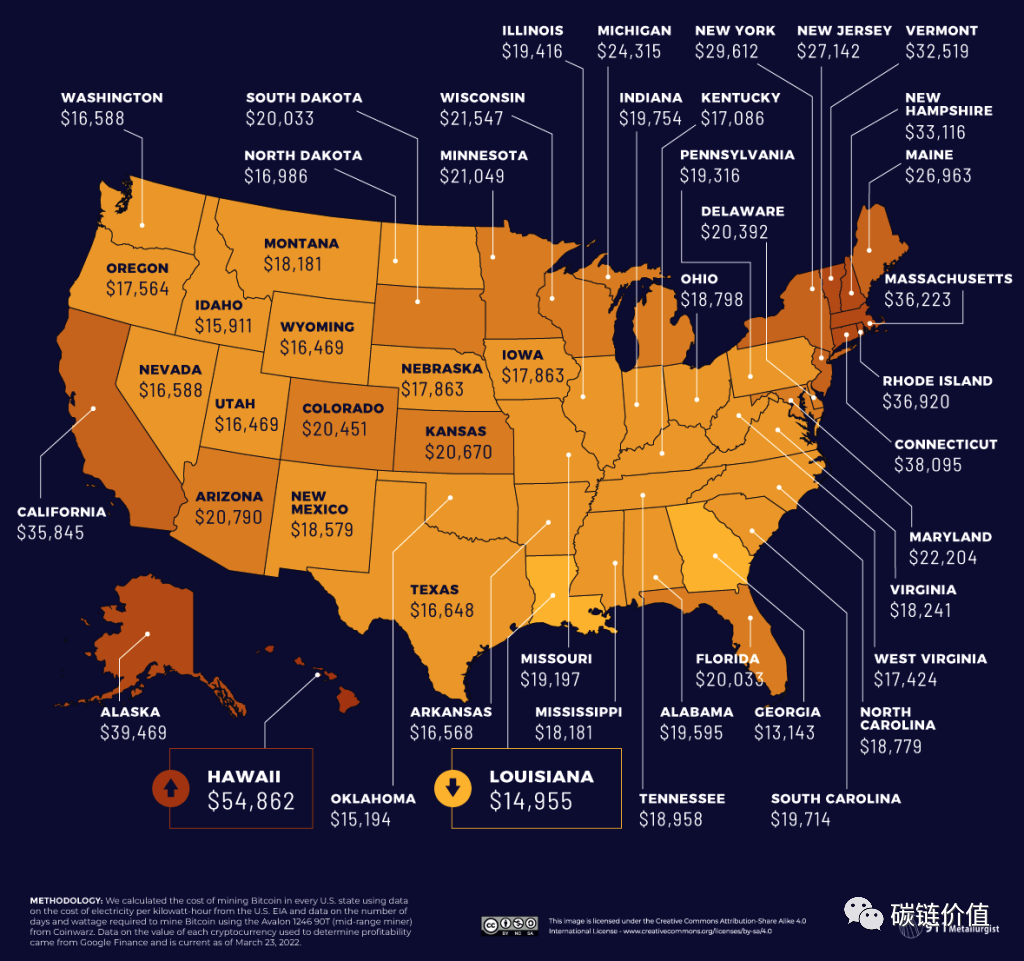 Figure 22: State with the lowest mining cost in the United States
3) Changes in the Global Bitcoin Mining Landscape
The shift in Chinese mining has changed the global mining landscape, leading to countries like Kazakhstan and Russia becoming major beneficiaries of the redistribution of hash power. According to data provided by the World Population Review as of 2023, the share of hash power in major Bitcoin mining areas is as follows:
- United States: 35.4%
- Kazakhstan: 18.1%
- Russia: 11.23%
- Canada: 9.55%
- Ireland: 4.68%
- Malaysia: 4.58%
- Germany: 4.48%
- Iran: 3.1%
After the ban, many Chinese miners relocated their operations to Kazakhstan due to its proximity and natural abundance of fossil fuels.
In 2019, fossil fuels accounted for 84% of Kazakhstan's electricity generation, while hydropower accounted for 12%, and solar and wind installations contributed to less than 2%. The abundant coal reserves in northern Kazakhstan power over 70% of the country's power plants.
Kazakhstan's electricity is provided by 155 power plants of different ownership models. As of January 1, 2022, the total installed capacity of the country's power plants reached 23,957 megawatts, with an available capacity of 19,004 megawatts.
During the period from September 2019 to September 2021, Kazakhstan's global Bitcoin mining share significantly surged from 1.3% to a remarkable 24.3%. Due to the self-sufficiency of coal and energy efficiency, the country's Bitcoin mining industry has flourished.
However, according to a report by the Russian media Kommersant in April 2023, Russia has become the world's second-largest Bitcoin mining region, second only to the United States.
The Bitriver data center of Russia's top cryptocurrency mining company is supported by Gazprom Neft, the country's third-largest oil producer. To meet the power needs of cryptocurrency mining, they directly use liquefied petroleum gas for power generation.
 Figure 23: Russian mining company Bitriver
While the United States maintains a significant mining lead with a power capacity of 3-4 gigawatts, Russia's power capacity reached 1 gigawatt in the first quarter of 2023. The change in Russia's ranking coincides with the implementation of tax and regulatory measures for cryptocurrency mining at the state and federal levels in the United States, creating an unfriendly policy environment for the mining industry.
Bitcoin Mining vs. Other Resource Costs
Due to its performance challenges, Bitcoin is often compared to "digital gold" rather than a payment system. Therefore, Bitcoin mining can be compared to gold mining.
Approximately 3,531 tons of gold are mined globally each year, resulting in a total carbon dioxide emissions of 81 million tons. Comparing the carbon intensity of Bitcoin mining to the carbon intensity of physical gold mining, it is clear that the former exceeds the latter.
However, it is worth noting that this calculation includes mining fees, which do not exist in physical gold mining. Additionally, the comparison is not ideal because we can stop mining physical gold, but Bitcoin mining cannot be stopped for a moment; it is an essential part of the entire Bitcoin network.
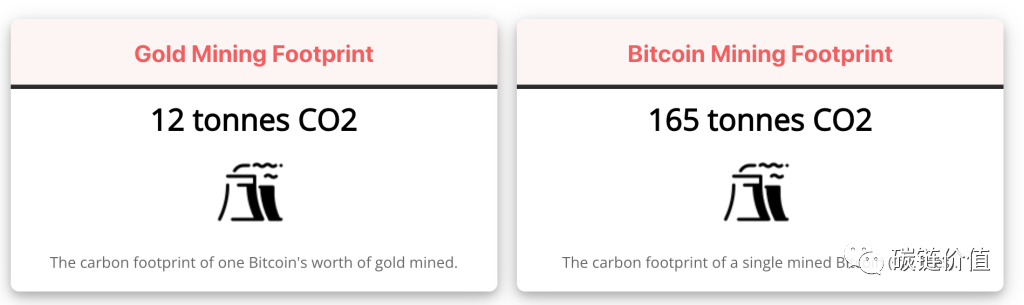 Figure 24: Gold mining vs. Bitcoin mining
The energy costs of resource extraction may vary greatly depending on the specific resources and extraction methods. For example:
According to data from the U.S. Geological Survey (USGS), the energy consumption for copper mining to produce one ton of copper (GJ/t) ranges from 0.2 to 1.5 gigajoules, with electrical uses accounting for about 3/4 of the total; producing one ton of aluminum requires approximately 17,000 kilowatt-hours (kWh) of electricity, which is typically sourced from coal-fired power plants with a maximum operating efficiency of about 30%.
In 2021, the production of 1 kilowatt-hour (kWh) of electricity by U.S. electric companies and independent power producers required: 1.12 pounds of coal, 7.36 cubic feet of natural gas, 0.08 gallons of liquefied petroleum gas, and 0.82 pounds of petroleum coke.
免责声明:本文章仅代表作者个人观点,不代表本平台的立场和观点。本文章仅供信息分享,不构成对任何人的任何投资建议。用户与作者之间的任何争议,与本平台无关。如网页中刊载的文章或图片涉及侵权,请提供相关的权利证明和身份证明发送邮件到support@aicoin.com,本平台相关工作人员将会进行核查。


