Bitcoin cash price is struggling below $340 against the US Dollar. BCH/USD is at risk of a downside push below $310 if buyers do not step in.

Key Points
Bitcoin cash price is trading in a range below the $320 level against the US Dollar.
There is a short term contracting triangle forming with resistance at $315 on the hourly chart of BCH/USD (data feed from Kraken).
The price remains at a risk of more declines as long as there is no close above $340-350.

Bitcoin cash price is struggling below $340 against the US Dollar. BCH/USD is at risk of a downside push below $310 if buyers do not step in.
Bitcoin Cash Price Resistance
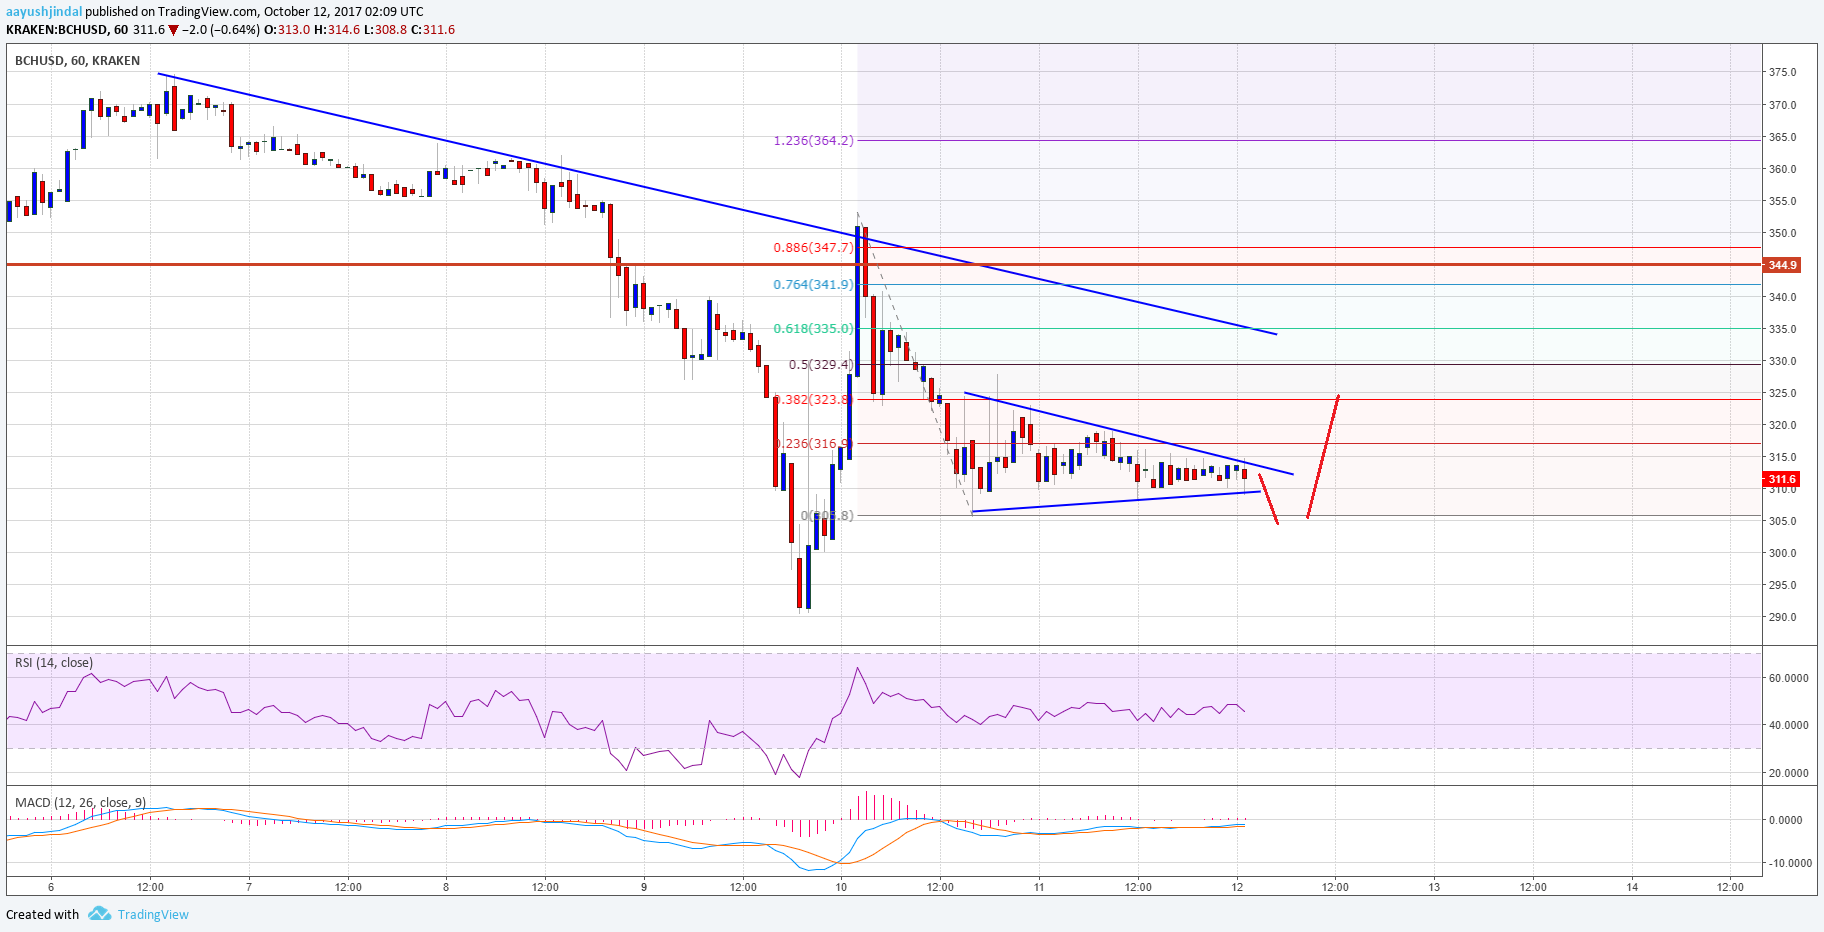
There was no major move in Bitcoin cash price above $325-330 against the US Dollar during the past 2-3 sessions. The price traded in a range above the $300 level and is currently preparing for a break. The most important thing is the fact that this week’s highlighted bearish trend line with resistance at $335-340 is still in place. It might continue to prevent gains above $350 until buyers are able to gain momentum for an upside break.
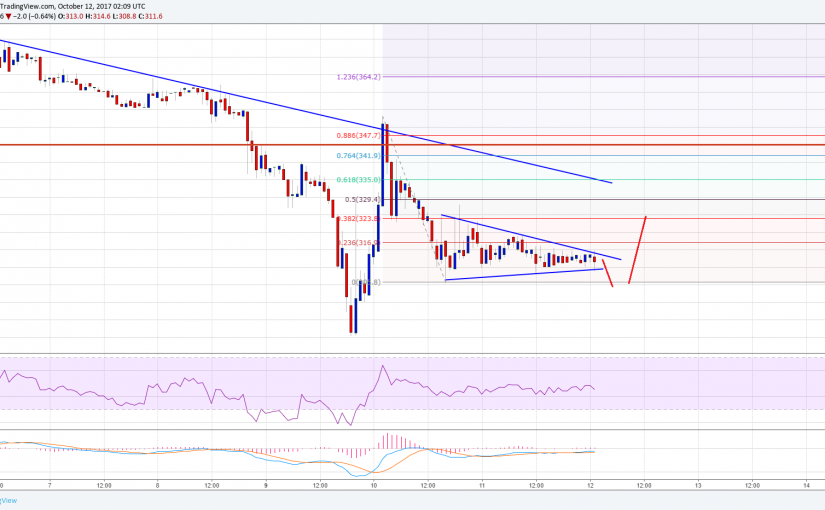
At the moment, there is a short term contracting triangle forming with resistance at $315 on the hourly chart of BCH/USD. The triangle resistance is near the 23.6% Fib retracement level of the last drop from the $354 high to $306 low. A clear break above the triangle resistance and the $320 level is needed for a push towards $335-340. The trend line resistance holds the key in the short term for a move above $350.
On the downside, the triangle support is near $310. A break below the last would take the price towards $300 followed by the last swing low near $290.
Looking at the technical indicators:
Hourly MACD – The MACD for BCH/USD is almost neutral in the bearish zone.
Hourly RSI (Relative Strength Index) – The RSI for BCH/USD is below the 50 level and heading south.
Major Support Level – $310
Major Resistance Level – $335
免责声明:本文章仅代表作者个人观点,不代表本平台的立场和观点。本文章仅供信息分享,不构成对任何人的任何投资建议。用户与作者之间的任何争议,与本平台无关。如网页中刊载的文章或图片涉及侵权,请提供相关的权利证明和身份证明发送邮件到support@aicoin.com,本平台相关工作人员将会进行核查。


