K-Line Pattern Analysis
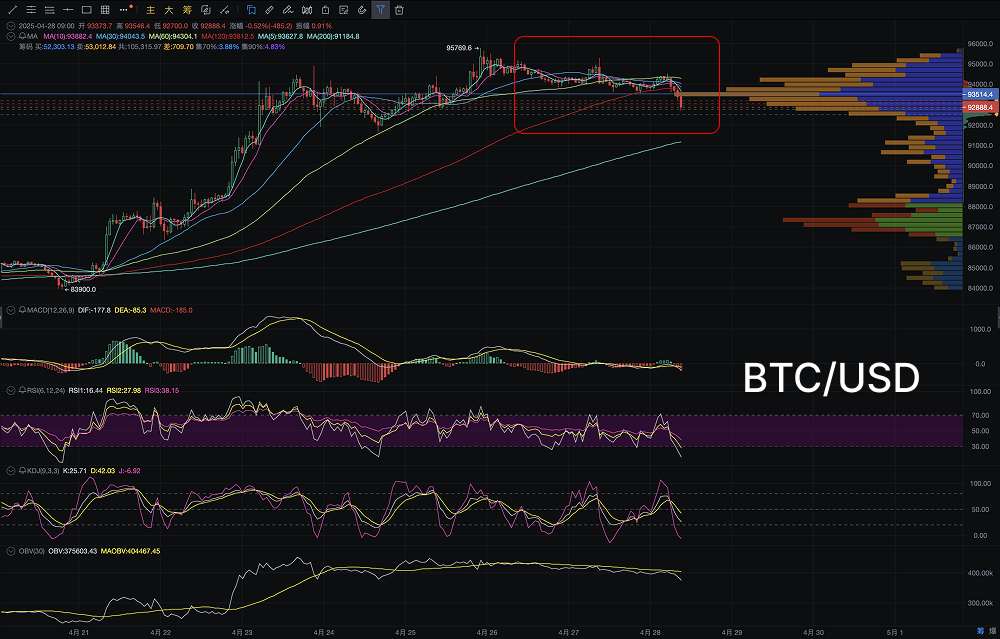
Currently, the price of Bitcoin has retreated to around $92,800, within an important support range on the 4-hour chart. Overall, since April 26, Bitcoin has repeatedly encountered resistance near $94,000-$95,000, forming a clear horizontal consolidation range. Yesterday, a small bearish candle with an upper shadow appeared, indicating heavy selling pressure above, and today there is a volume increase testing the lower support.
In terms of pattern, the price has fallen below the 4-hour 20EMA (approximately $93,000), and the short-term moving averages (5EMA/10EMA) are in a death cross state, suppressing the price downward, indicating a weak short-term trend with a downward bias.
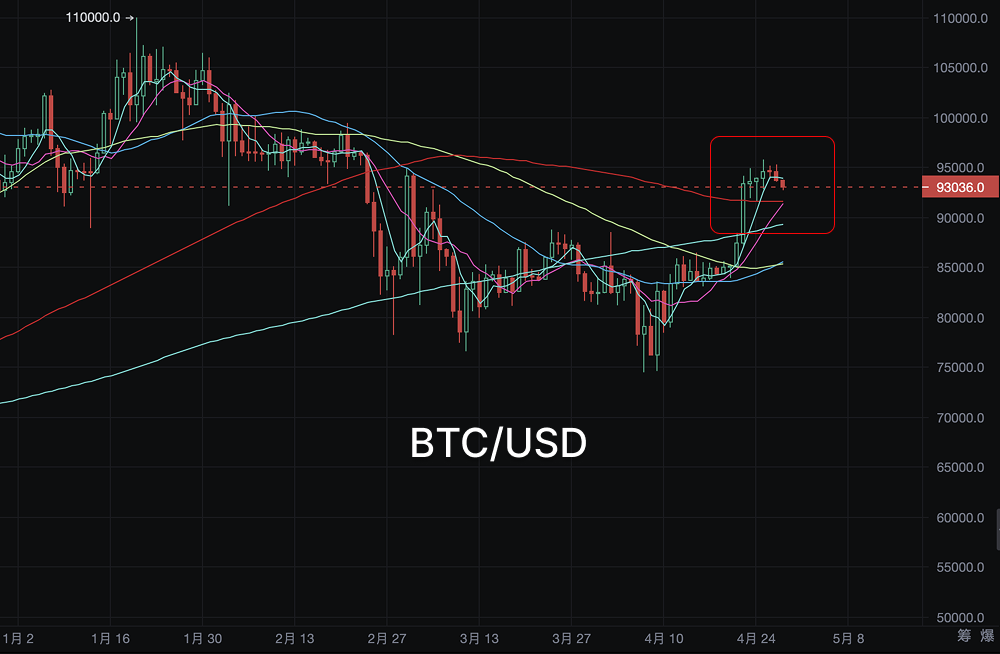
From a larger timeframe (1-day K-line), Bitcoin remains within a wide consolidation range, without forming a clear trend reversal. However, it is worth noting that the current price is testing the support zone of the past two weeks' trading volume (between $92,500-$93,500). If this support is lost, it will accelerate the decline towards the $90,000-$91,000 range.

Large Capital Movements (OBV, Trading Volume, Open Interest Analysis)
- OBV Indicator: Has declined for two consecutive days, and MAOBV has crossed below, indicating that funds are gently flowing out, and buying power is weakening.
- Trading Volume: The trading volume in the last 24 hours has moderately increased, but it is an increase in selling volume, indicating that the current market is primarily focused on selling.
- Open Interest Changes: Observing the latest BTC contract open interest data, the overall open interest has slightly decreased, suggesting that some funds are exiting the market, and short-term risk appetite is declining.
In summary, large capital has not shown any significant support actions, but rather is gradually selling off at high levels.
Key Technical Indicator Analysis
- MACD (4-hour): The dual lines have crossed downwards, with green bars continuing to expand, indicating bearish momentum and significant short-term downward pressure.
- RSI (4-hour): RSI has quickly fallen below 50, currently around 38, entering a weak zone, showing insufficient bullish momentum.
- KDJ (4-hour): The three lines have crossed downwards, with the J value falling below 0, indicating severe overselling, but there are no clear signs of a reversal yet.
- VPOC (Volume Point of Control): The current VPOC (maximum trading volume area) is around $93,500. If the price falls below this level, there will be a lack of strong support in the short term.
Overall technical conclusion: Multiple indicators are resonating weakly, and there is still a risk of further downward movement in the short term.
Today's Trend Prediction and Breakthrough Conditions
(1) Short-term Prediction
It is expected that Bitcoin will continue to show a weak low-level consolidation trend today, with the main range reference as follows:
- Upper Resistance: $93,500 → $94,000 (Yesterday's platform support turned into resistance)
- Lower Support: $91,500 → $90,000 (Important psychological level)
If the price retraces and is blocked in the $93,000-$93,500 area, it will further accelerate the downward test of $91,500.
(2) Breakthrough Conditions
To break through the current consolidation bottleneck and regain strength, the following conditions must be met: the price must stabilize and break through $94,500 with volume (breaking the recent small platform high). MACD must form a golden cross on the 4-hour cycle, with green bars shortening and momentum turning bullish. The OBV indicator must turn upwards again, indicating a reflow of funds.
Otherwise, Bitcoin will maintain a weak consolidation pattern at high levels, remaining in a short-term adjustment state.
Core Summary
Bitcoin is currently in a testing phase at the lower edge of the consolidation range, with overall momentum weakening, and large capital showing gentle outflows, while technical indicators are synchronously bearish. If it cannot quickly recover $93,500 today, it is expected to continue searching for support downwards, with $90,000-$91,500 becoming a key defense line.
To reopen the upward channel, Bitcoin needs to break above $94,500 with volume in the coming days; otherwise, it will still primarily consolidate at high levels in the short term, making effective breakthroughs difficult.
This article only represents the author's personal views and does not reflect the stance and views of this platform. This article is for information sharing only and does not constitute any investment advice to anyone.
Join our community to discuss this event
Official Telegram Community: t.me/aicoincn
Chat Room: Wealth Group
免责声明:本文章仅代表作者个人观点,不代表本平台的立场和观点。本文章仅供信息分享,不构成对任何人的任何投资建议。用户与作者之间的任何争议,与本平台无关。如网页中刊载的文章或图片涉及侵权,请提供相关的权利证明和身份证明发送邮件到support@aicoin.com,本平台相关工作人员将会进行核查。


