Original text from The Defi Report
Compiled by|Odaily Planet Daily Golem (@web3golem)_

Editor’s note: This week, Bitcoin's upward momentum continued to expand, with a weekly increase of 10.51%, peaking at $95,768. The main reason is related to Trump ending the tariff standoff and actively engaging in trade negotiations with various countries (Related reading: Bitcoin Breaks Through $90,000, Bull Market Returns). The net inflow of Bitcoin spot ETFs also reached the largest single-day net inflow since Trump took office on April 22. Market sentiment has generally shifted from fear to greed.
However, researchers at The Defi Report, combining on-chain momentum indicators, believe that in the short term, Bitcoin may soon face a pullback, with a key support area above $70,000. If the support holds, the bull market will continue; if it falls below $70,000, the downward trend will persist. Of course, they also believe that if Bitcoin's price stabilizes at $95,000, it will set a new historical high.
In the long term, as the U.S. budget deficit grows and global inflation rises, non-sovereign hard currencies like gold and Bitcoin will become the preferred choice for investors. Odaily Planet Daily compiles its views on the short-term and long-term prospects for Bitcoin and the crypto market as follows, enjoy!
Momentum Indicators and On-chain KPIs
After falling to a "death cross" on April 7, Bitcoin has now broken through all key moving averages. Its performance thereafter will provide key information to help us determine whether we are entering the long-awaited long-term bull market cycle or if the long-term downward trend will continue.
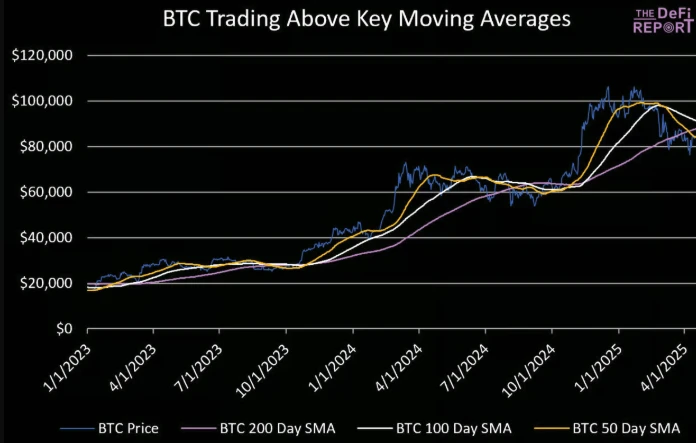
We expect Bitcoin's price to pull back at some point. At that time, Bitcoin is expected to drop to a low slightly above the previous low (breaking $76,000). If Bitcoin falls to a lower low (below $76,000), we expect support above $70,000. If the support holds, the bull market will continue. If it falls below $70,000, this will further confirm that Bitcoin is in a left-side cycle, and the downward trend will persist.
If Bitcoin's price breaks above $95,000 and stabilizes, it will set a new historical high.
To assess the upcoming market conditions, we delve into Bitcoin KPI data to see if we can find clues to predict Bitcoin's next move.
ETF Inflows
In February and March, Bitcoin spot ETFs saw a net outflow of $3.8 billion, with another $600 million flowing out in the first three weeks of April. However, on April 22, the trend reversed significantly, with a net inflow exceeding $1.54 billion, marking the largest single-day net inflow since Trump took office. We are monitoring whether this trend can continue; without participation from the U.S. market and ETF inflows, Bitcoin cannot return to historical highs.
Spot Trading Volume
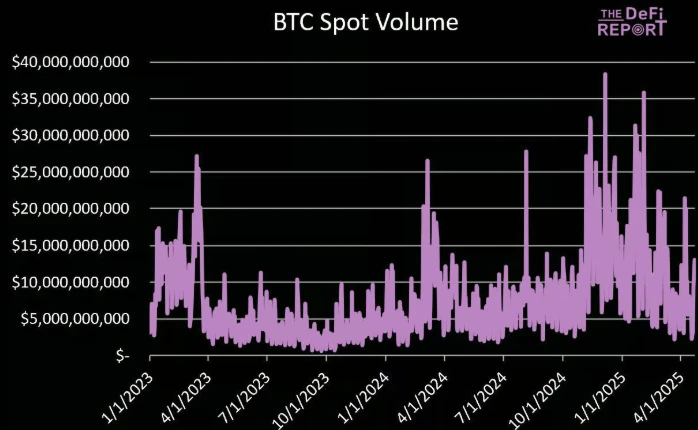
Data: Glassnode, DeFi Report
In April, Bitcoin's average daily trading volume was $8.7 billion, comparable to the levels at the beginning of the bull market in early 2023. During the rebound on April 22, trading volume reached $13 billion, but it was still less than half of the trading volume on high volatility days. Additionally, compared to November and December of last year, the average number of active addresses in April decreased by 22%.
That said, investors should recognize that Bitcoin and the cryptocurrency market are generally reflexive. Prices often fluctuate first, followed by changes in on-chain activity, so on-chain activity may change quite suddenly.
Short-term Holders Are Selling
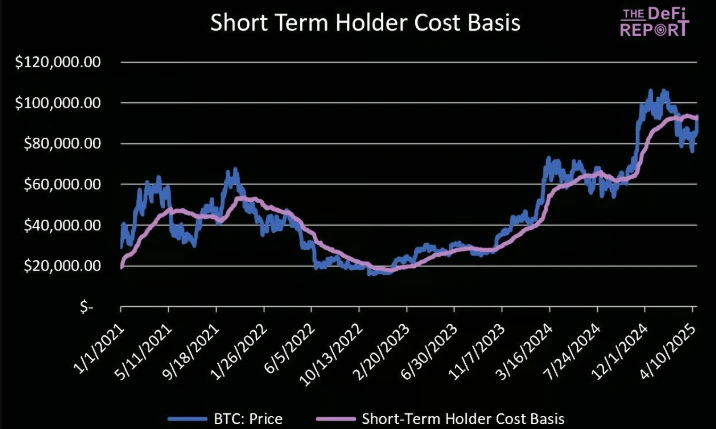
As shown in the figure above, Bitcoin has reached the cost basis for short-term holders ($92,500). This is a key support level that aligns with Bitcoin's key moving averages.
Long-term holders create support and lay the foundation for setting historical highs, but short-term holders bear the primary responsibility for volatility in the later stages of the cycle. Therefore, we are closely monitoring the on-chain behavior of this group, as their holdings are rebounding and becoming profitable.
Since early February, the Bitcoin holdings of short-term holders have decreased by 11.4%. In the chart below, we can see a significant increase in the amount transferred to exchanges on April 22 and 23, totaling $4.4 billion. This is not a good sign, as it indicates that "paper hands" are selling. This situation is similar to the early bear market in March 2022, when Bitcoin's price briefly rebounded to the cost basis level of short-term holders (who had previously sold from a high of $69,000). Therefore, this is a signal suggesting that the bear market may continue until the end of this year.
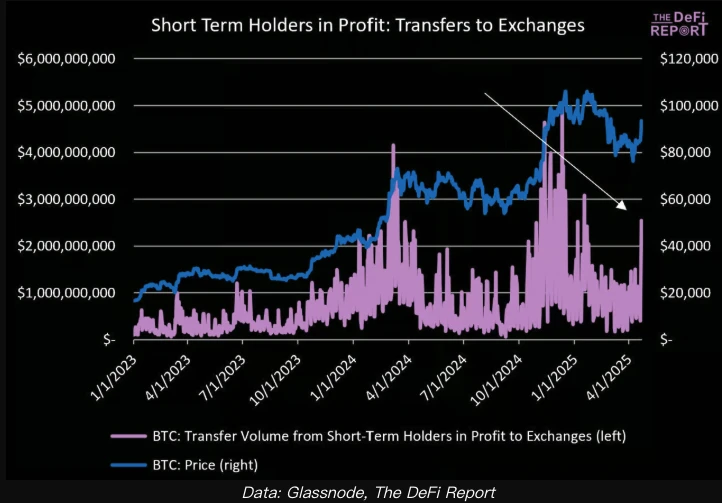
Data: Glassnode, DeFi Report
Long-term Holders Are Still Buying
Can long-term holders withstand the selling pressure from "paper hands"? In the chart below, we can see that long-term holders are returning to the market as buyers. They currently control 69% of the Bitcoin supply in the market, up from a low of 66% on February 1, 2025.
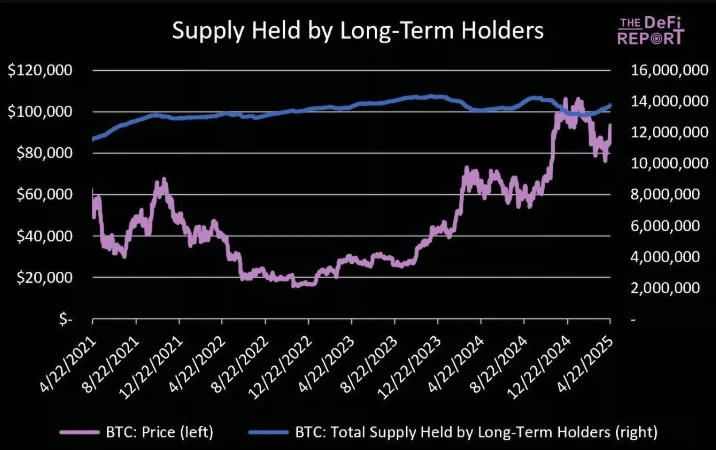
Historically, the changes in the proportion of Bitcoin held by long-term holders are as follows:
At the peak of the 2017 bull market, long-term holders held 51.6% of the Bitcoin supply;
At the trough of the 2018 bear market, long-term holders held 67.3% of the Bitcoin supply;
At the peak of the 2021 bull market, long-term holders held 69% of the Bitcoin supply (the second peak), while at the first peak, this ratio was 58.9%;
At the trough of the 2022 bear market, long-term holders held 69.5% of the Bitcoin supply;
At the peak in December 2024, long-term holders held 67.3% of the Bitcoin supply.
Our interpretation is that the current increase in the concentration of long-term holders is laying a solid foundation for the market. That said, we believe these data are always influenced by ETFs, as many retail investors are purchasing Bitcoin through ETFs.
Supply Ratio of Long-term Holders to Short-term Holders
It is clear that short-term holders are selling their Bitcoin to long-term holders. In the chart below, we can see that as prices peaked from December last year to January this year, this ratio seems to have bottomed out.
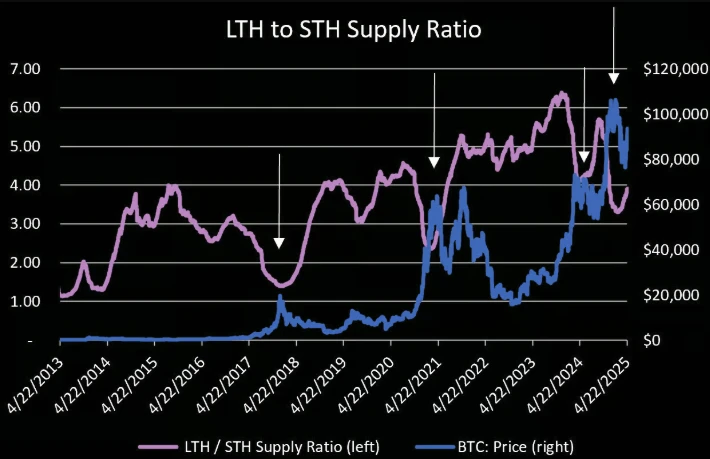
This is concerning, as it typically indicates that the cycle has reached a (local) peak, such as in December 2017, April 2021, March 2024, and December 2024.
That said, Bitcoin did experience a "double top" in the last cycle, primarily driven by long-term holders. This ratio bottomed out at the first peak in March 2021 and peaked at the second peak in November 2021 (the second peak was driven by long-term holders).
It is also possible that a similar situation will occur this year; if so, Bitcoin's second peak may be in the range of $110,000 to $130,000.
USDT Supply Has Not Increased Significantly
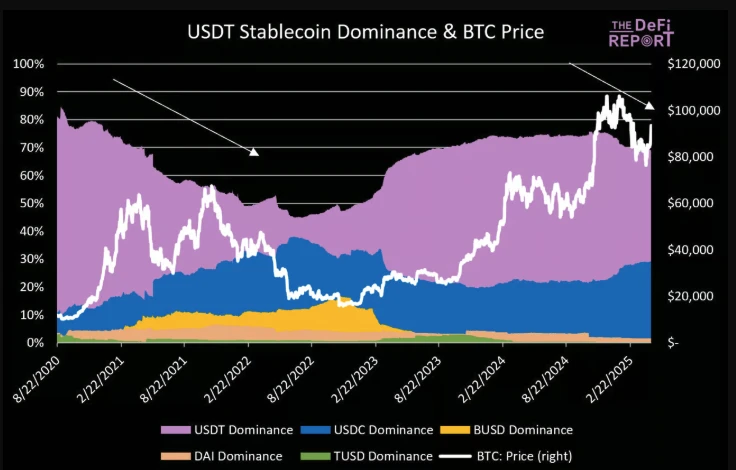
Bitcoin's price often correlates positively with the growth of the circulating supply of USDT (and its dominance).
Notably, since mid-December last year, the supply of USDT has hovered around $140 billion. Meanwhile, the supply of USDC is increasing (up 47% since mid-December last year). This is similar to the previous cycle, where the supply of USDC increased significantly during the bear market and then receded at the end of Q3 2022.
Funding Rates
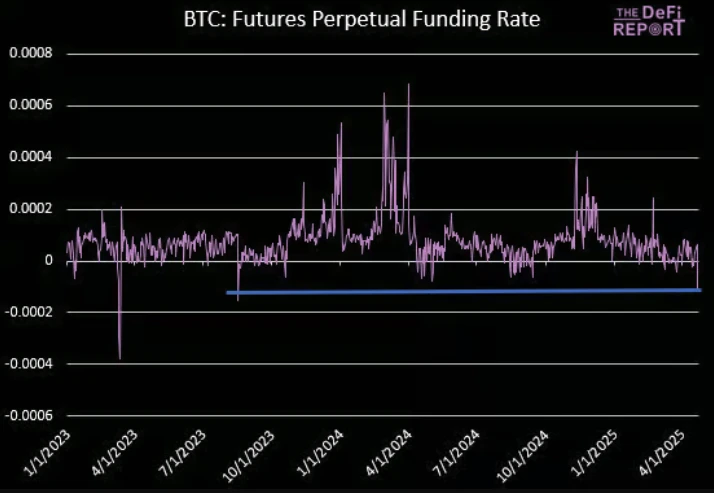
Due to short positions betting that Bitcoin will drop around $94,000, the funding rate for Bitcoin fell to negative on April 22. To maintain their positions, shorts have paid the highest amount since August 2023. This indicates the positions of traders and speculators, but it may also lead to a short squeeze, with Bitcoin's price potentially rising above $100,000 in the short term.
MVRV-Z Score Analysis
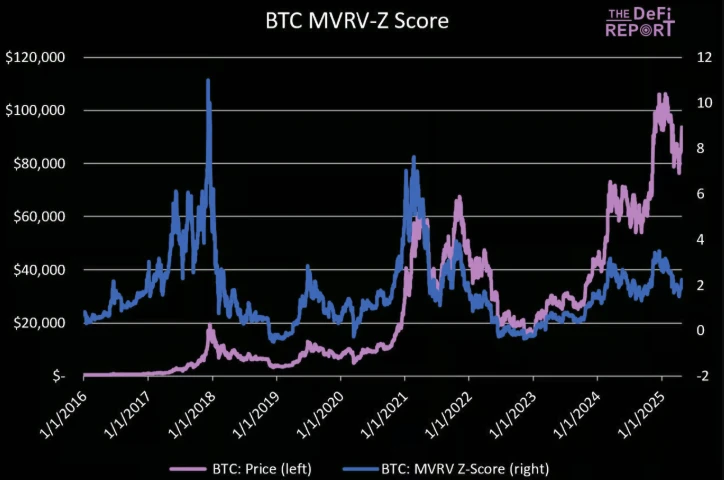
Bitcoin's MVRV-Z score is currently 2.2. This analysis standardizes data across different time periods and market conditions using z-scores. A z-score of 2.2 indicates that BTC's current trading price is 2.2 standard deviations above its average. Since January 1, 2017, it has been below this level 70% of the time and above it 30% of the time.
We analyzed the periods when the MVRV-Z score fell below 2 during an uptrend and isolated examples of it falling below this level for the third time or more within an 18-month period (as we see now). Here are the return rates for these periods.
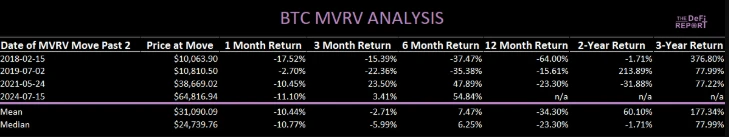
All examples above show negative return rates over 12 months. For completeness, we included all cases since January 1, 2017, where MVRV exceeded 2:
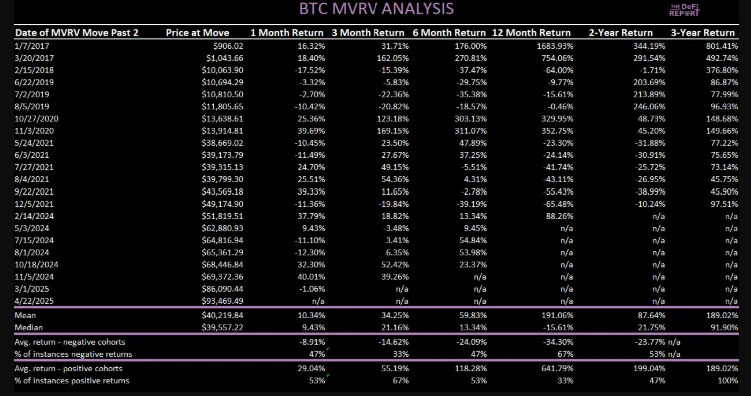
1-month average return: 10.34%, with 53% of cases showing positive returns.
3-month average return: 34.25%, with 55% of cases showing positive returns.
6-month average return: 59.83%, with 53% of cases showing positive returns.
12-month average return: 191% (84% if excluding the case from January 7, 2017), but only 33% of cases showed positive returns.
In general, buying when the MVRV-Z score exceeds 2 can yield substantial returns, but historically these results typically occur in the early stages of a cycle (early 2017, late 2020).
Summary: Bull Market Trend Remains Unclear
Over the past three months, on-chain activity has been on a downward trend. This is not only the case for Bitcoin, but Ethereum and Solana have also experienced this.
In the chart below, we can see that the Asia-Pacific region/China has been the dominant factor in most of this week's volatility, despite a significant inflow into ETFs on April 22 (Tuesday) (not included in the chart below). This is a positive sign, but we strongly believe that without significant participation from the U.S. market, Bitcoin cannot restore its bull market structure.
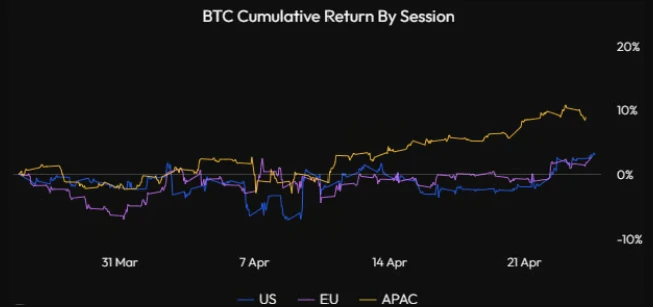
Data: Velo
The growth of stablecoins has begun to weaken, with USDT's supply hovering around $140 billion over the past four months. In the past, we found a correlation between the slowdown in USDT stablecoin supply growth and BTC's consolidation periods.
The ratio of long-term holders to short-term holders is a key focus. As mentioned earlier, long-term holders often lay the foundation for Bitcoin's price movements, but it is the strong entry of short-term holders that can push prices to new historical highs, which is currently difficult to see. A longer consolidation period will create a healthier environment for a new wave of capital inflow into Bitcoin.
The MVRV-Z score analysis shows that short-term return results are mixed, but the outlook for the next two to three years will be more positive. We prefer to buy when Bitcoin's score approaches 1 rather than now.
We acknowledge that our analysis is based on the past, and investors should understand that due to the reflexivity of the cryptocurrency market (prices often fluctuate first, driving narratives and on-chain activity), the market is ever-changing. Finally, please note that our on-chain data analysis does not include ETFs or Bitcoin from centralized exchanges (which account for about 18.7% of the supply).
Short-term Market Will Face Decline
With global capital withdrawing from the U.S. market, there has been much discussion about "Bitcoin decoupling." We do not endorse this notion, not because we believe Bitcoin cannot "decouple," but because Bitcoin is generally uncorrelated with the Nasdaq index (since January 1, 2017, the average correlation coefficient is 0.22, with a median of 0.23).
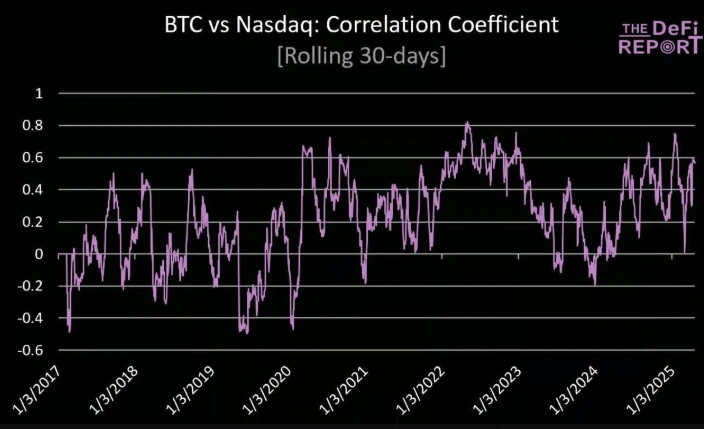
Correlation of Bitcoin with Nasdaq
That said, the correlation between Bitcoin and the Nasdaq index has increased this year (0.47), and the correlation tends to rise when the Nasdaq index is under pressure (since 2017, when the Nasdaq index falls by 2% or more, the correlation jumps to 0.4). This situation may not change yet, as the Nasdaq index is likely to continue to decline.
Despite investors continuously withdrawing from risk assets, the market is still trading at a forward earnings price of 19 times. Here’s a comparison with the lows from the past four major corrections:
2022 Bear Market: 15 times. Equivalent to the S&P 500 index's current 4,248 points.
COVID-19 Pandemic: 13 times. Equivalent to the S&P 500 index's current 3,682 points.
Financial Crisis: 17.1 times. Equivalent to the S&P 500 index's current 4,815 points.
Dot-com Bubble: 20 times. Equivalent to the S&P 500 index's current 5,665 points.
Analysts downgraded earnings expectations by 2.2% during the COVID-19 pandemic, by 4.2% during the 2022 bear market, by 64% during the global financial crisis, and by 38% during the dot-com bubble burst. However, so far, earnings expectations have only been downgraded by 0.3%.
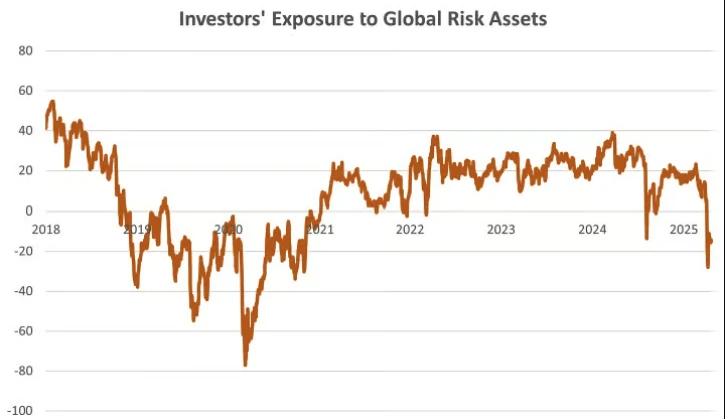
Data: Cross-border Capital
However, the current situation in the U.S. is not better than before:
The number of early layoffs in the U.S. has exceeded levels during the financial crisis (mainly government layoffs), which has not yet been reflected in labor market data;
Surveys show that soft data such as the Philadelphia Fed Manufacturing Index, new housing starts, Philadelphia Fed new orders, container ship bookings, and trade at the Port of Los Angeles are all showing weakness;
The Atlanta Fed predicts negative growth in the first quarter;
The Federal Reserve remains inactive (the likelihood of a rate cut in May is 5%);
Tariff negotiations are quite complex, taking longer than the market expects, and may further escalate tensions/increase rhetoric.
In summary, we believe the Trump administration is doing everything possible to gradually depress the stock market (to lower the dollar and interest rates), and the economy may have already suffered significant damage. Therefore, we believe the next round of declines may come when hard data starts to be released.
On the other hand, if the following conditions are met, the market may smoothly navigate through the uncertainty:
Progress on tariff agreements is faster than expected;
The bond market remains stable without serious issues;
The Trump administration successfully shifts the market's attention to the tax cuts and deregulation they are currently promoting.
Bitcoin's Long-term Outlook Remains Optimistic
But in the long term, the outlook for Bitcoin and the entire cryptocurrency market is very optimistic.
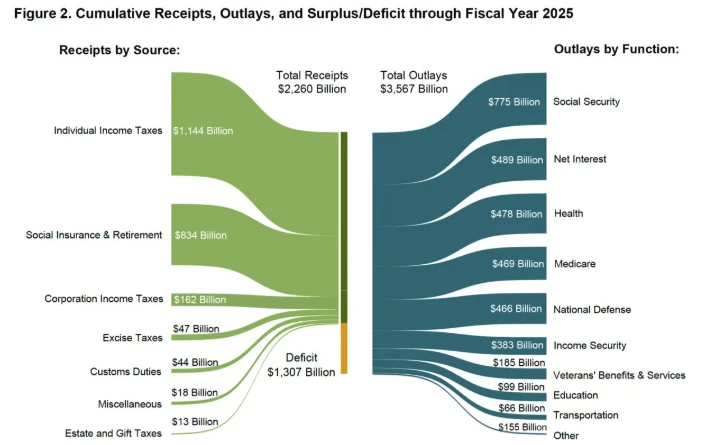
Data: U.S. Treasury. As of March, the fiscal year 2025 deficit is projected to be $1.3 trillion, expected to rise to $1.9 trillion.
The U.S. budget deficit is growing, not slowing. With Elon Musk announcing he will leave the White House in May, the government efficiency portion (DOGE) is clearly just a political farce, targeting only small fry.
The Treasury may continue to play a significant role in providing liquidity, and not just in the U.S. (as we have seen in the past few years), Europe is also increasing fiscal spending to cover defense and infrastructure costs. We believe the Federal Reserve will begin to expand its balance sheet again in the third/fourth quarter.
As the situation gradually clarifies, we expect to see monetary suppression/yield curve control globally, and inflation will also rise. In this environment, investors will favor non-sovereign hard currencies like gold and Bitcoin over stocks.
Risk Management and Conclusion
We prefer to wait for the "big pie" to drop in the market, and we are happy to hold cash until we see them.
Buying Bitcoin and other assets (like SOL) at the 2022 lows was a "big pie" drop. Increasing investments in Bitcoin (including meme allocations) last September, before the rate cuts and the expected Trump victory, was also a "big pie." We also believe that changing the portfolio to be cash-heavy from December to January was a "big pie." (Odaily note: Bitcoin broke through $100,000 in January 2025, setting a new historical high, before subsequently declining.)
So, is now a "big pie" opportunity to bottom out in cryptocurrencies? For us, the answer is no. While we remain optimistic about Bitcoin's long-term trend, we also prefer to keep it simple.
If you believe we are in a structural reset of the global trade and monetary system (which we do), then you can ignore Trump's statements and try to find buy signals amid the noise from people like Basant. But we believe it will take a long time to see the results, and currently, we haven't even made it through the end of the first round.
The Federal Reserve is currently inactive, so we can comfortably hold long-term Bitcoin while maintaining ample cash reserves. This may cause us to miss some upward opportunities in the short term, but we do not mind that.
Everyone needs to act within their comfort zone and risk tolerance. Cash is also a position, and given the ample opportunities in the cryptocurrency space, we can remain patient.
免责声明:本文章仅代表作者个人观点,不代表本平台的立场和观点。本文章仅供信息分享,不构成对任何人的任何投资建议。用户与作者之间的任何争议,与本平台无关。如网页中刊载的文章或图片涉及侵权,请提供相关的权利证明和身份证明发送邮件到support@aicoin.com,本平台相关工作人员将会进行核查。


