Comprehensive Analysis of Bitcoin and ETH Market Trends on April 25, 2025, Based on the Latest Market Dynamics and Relevant Analysis
Market Drivers
Institutional Demand and ETF Fund Inflows:
Recent net inflows into spot Bitcoin ETFs exceeded $900 million in a single day, reaching a new high since January 2025, indicating increased confidence among traditional financial institutions.
The stock of Bitcoin on exchanges has dropped to its lowest level since December 2016, showing that long-term holders (HODLers) are reluctant to sell, reducing market selling pressure.
Perpetual contract funding rates: Negative funding rates (shorts paying longs) may trigger a short squeeze, driving prices up rapidly.
Moving Averages: Bitcoin has stabilized above the 200-day moving average, with technical structures supporting a bullish trend.
Weakening Dollar Index: The dollar index recently plummeted to 98.30, with funds shifting towards non-dollar assets like Bitcoin.
Trade Policy Risks: The temporary policy of tariff exemptions under the Trump administration remains uncertain, which could lead to market volatility.
Sentiment Indicators: The Fear and Greed Index has recently risen to the "neutral" zone, indicating that investor sentiment is gradually turning optimistic, but has not yet entered the extreme greed phase.
Current Price and Key Resistance Levels
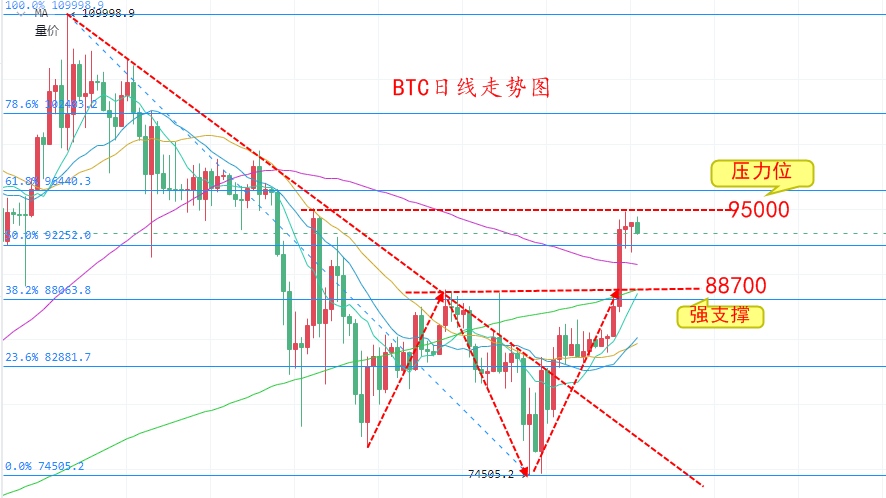
Price Level: As of April 24, Bitcoin's price has rebounded to around $90,000, a rise of about 21% from the mid-April low of $74,500. On April 23, it briefly reached $94,700, a new high since March, but then faced psychological resistance at $95,000, resulting in a pullback and consolidation.
Resistance and Support:
Resistance Level: $95,000 is the current main resistance; if broken, it may challenge the $100,000 mark. Further breakthroughs could bring it closer to the historical high of $109,000 from January.
Support Level: Short-term support is around $92,000, which has been tested and rebounded in the past two days. I have been advising everyone to go long at this level, and these long positions have yielded a profit of one to two thousand points, which is quite good, and those who followed have also benefited. Strong support at $88,690 (200-day moving average) is also a previous daily top-bottom conversion support level.
For intraday BTC trading, consider placing a long position in the range of $91,500—$92,000, with a stop loss at $91,000. If it goes above $94,000, a light short position can also be taken, with a stop loss at $95,000 and a target of $92,000. Once $95,000 is effectively broken, we can follow up with long positions, and Bitcoin may open the path towards $100,000.

Regarding ETH, it has also risen alongside Bitcoin in this round, but we can see that ETH's increase is relatively small, peaking around $1,840, and currently, with the pullback, it has come down to around $1,740. The support level below can be referenced around $1,700, which is also a support level for the daily top-bottom conversion. A pullback to around $1,700 during the day can be an opportunity to set up a long position, with a stop loss at $1,650 and a target of $1,800.
In the group chat, we will communicate with everyone in real-time regarding the current price orders. Friends who have not joined the group can message me directly. The evening live broadcast will also provide timely exchanges with everyone.
Market conditions change in real-time, and there may be delays in article publication. Strategy points are for reference only and should not be used as entry criteria. Daily real-time market analysis, experience in the group chat, and practical trading discussions are welcome for real-time guidance. Evening live broadcasts will explain real-time market conditions at irregular intervals.

免责声明:本文章仅代表作者个人观点,不代表本平台的立场和观点。本文章仅供信息分享,不构成对任何人的任何投资建议。用户与作者之间的任何争议,与本平台无关。如网页中刊载的文章或图片涉及侵权,请提供相关的权利证明和身份证明发送邮件到support@aicoin.com,本平台相关工作人员将会进行核查。


