
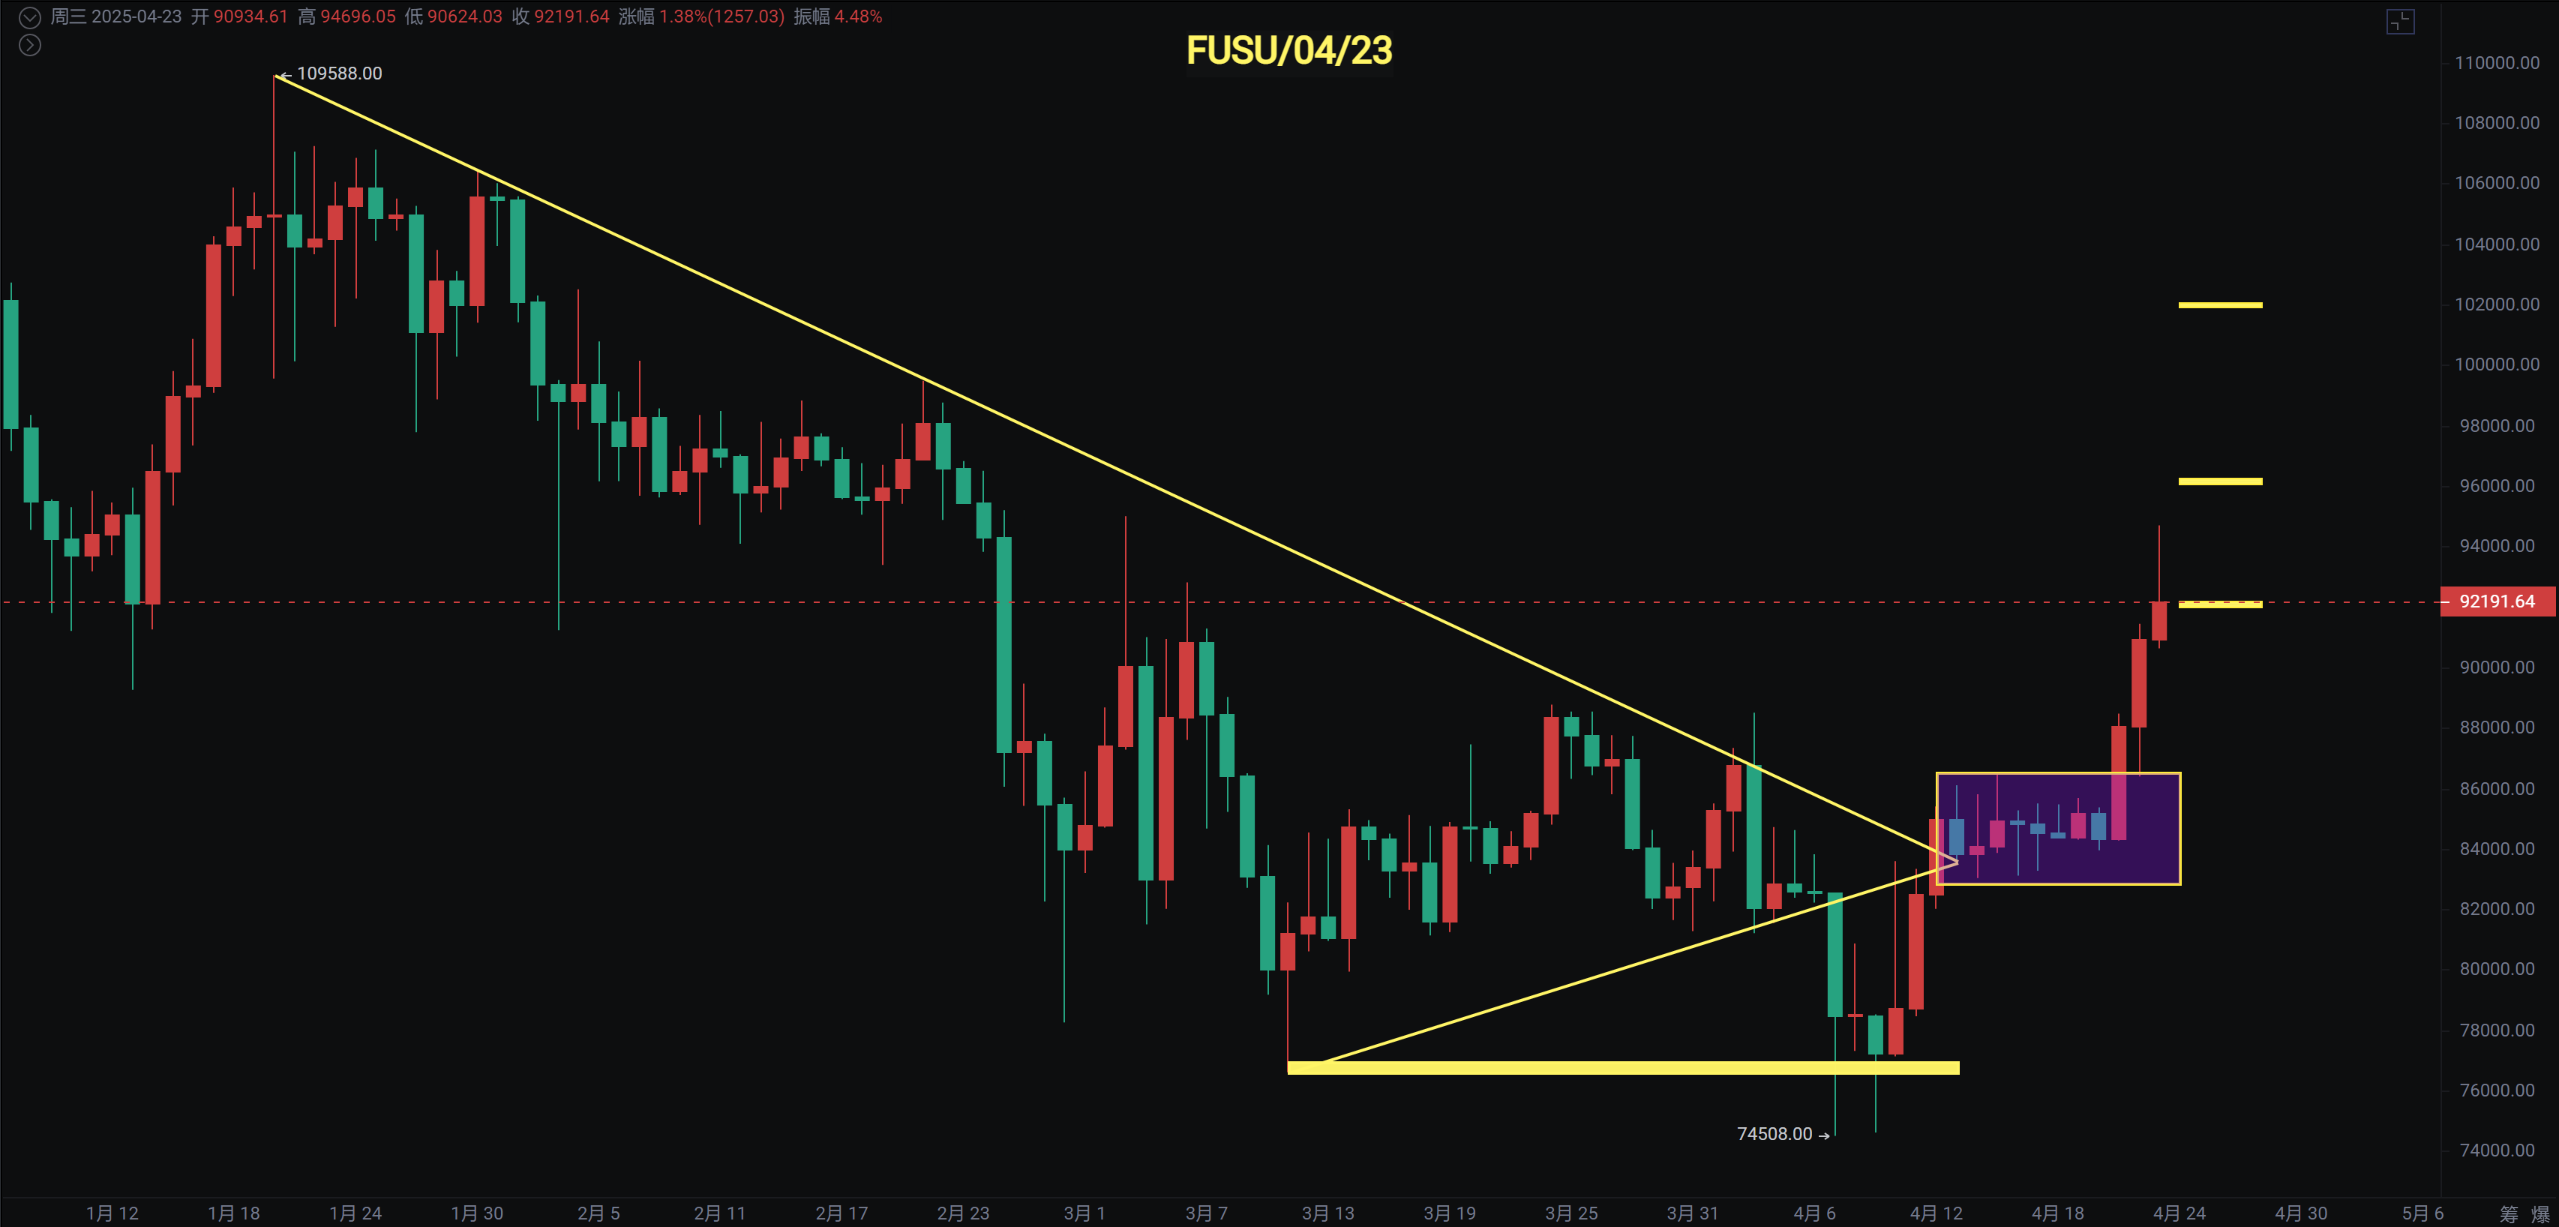
Bitcoin has rebounded for three consecutive days since breaking down, recovering with a rise of 20,000 points, an increase of 27%, and is now below 95,000. This is also the first time it has encountered a pin bar rebound resistance level. Currently, the price is between 0.5 and 0.618. If it can break through decisively, there is a chance to reach 100,000 to 106,000 to complete the shark pattern. If it cannot break through directly, it may still retest 88,000 to 89,000, which would be an opportunity to add positions.
The Beautiful Valley has seen a rebound, and as of the time of writing, the Nasdaq has rebounded by 3.95%, the Dow Jones by 2.55%, and the S&P 500 by 3%, showing a strong rebound. The U.S. stock market's rebound will depend on whether it can break through the high point of the 10th; if it does, there is a chance to complete the bat pattern and return to the upper formation. However, if it still cannot break through the previous high platform, it will continue to decline.
Bitcoin
The daily chart shows that Bitcoin has completed an upward three-wave movement. After a pullback, we are looking to see if it can complete a five-wave movement. In the short term, it faces pin bar resistance at 95,000, with support at 88,000 to 89,000. There is a divergence on the 1-hour chart, but some signs are showing on the 4-hour chart.
The daily chart has broken through a descending wedge and returned to a converging triangle, re-establishing above the MA120 and several other MAs, which is relatively strong. However, do not chase the rise; wait for a pullback to see if it can create new highs. If it rebounds back to the previous high around 103,000 to 106,000, I will consider reducing positions.
Support: 89,000—91,500
Resistance: 95,000—100,000
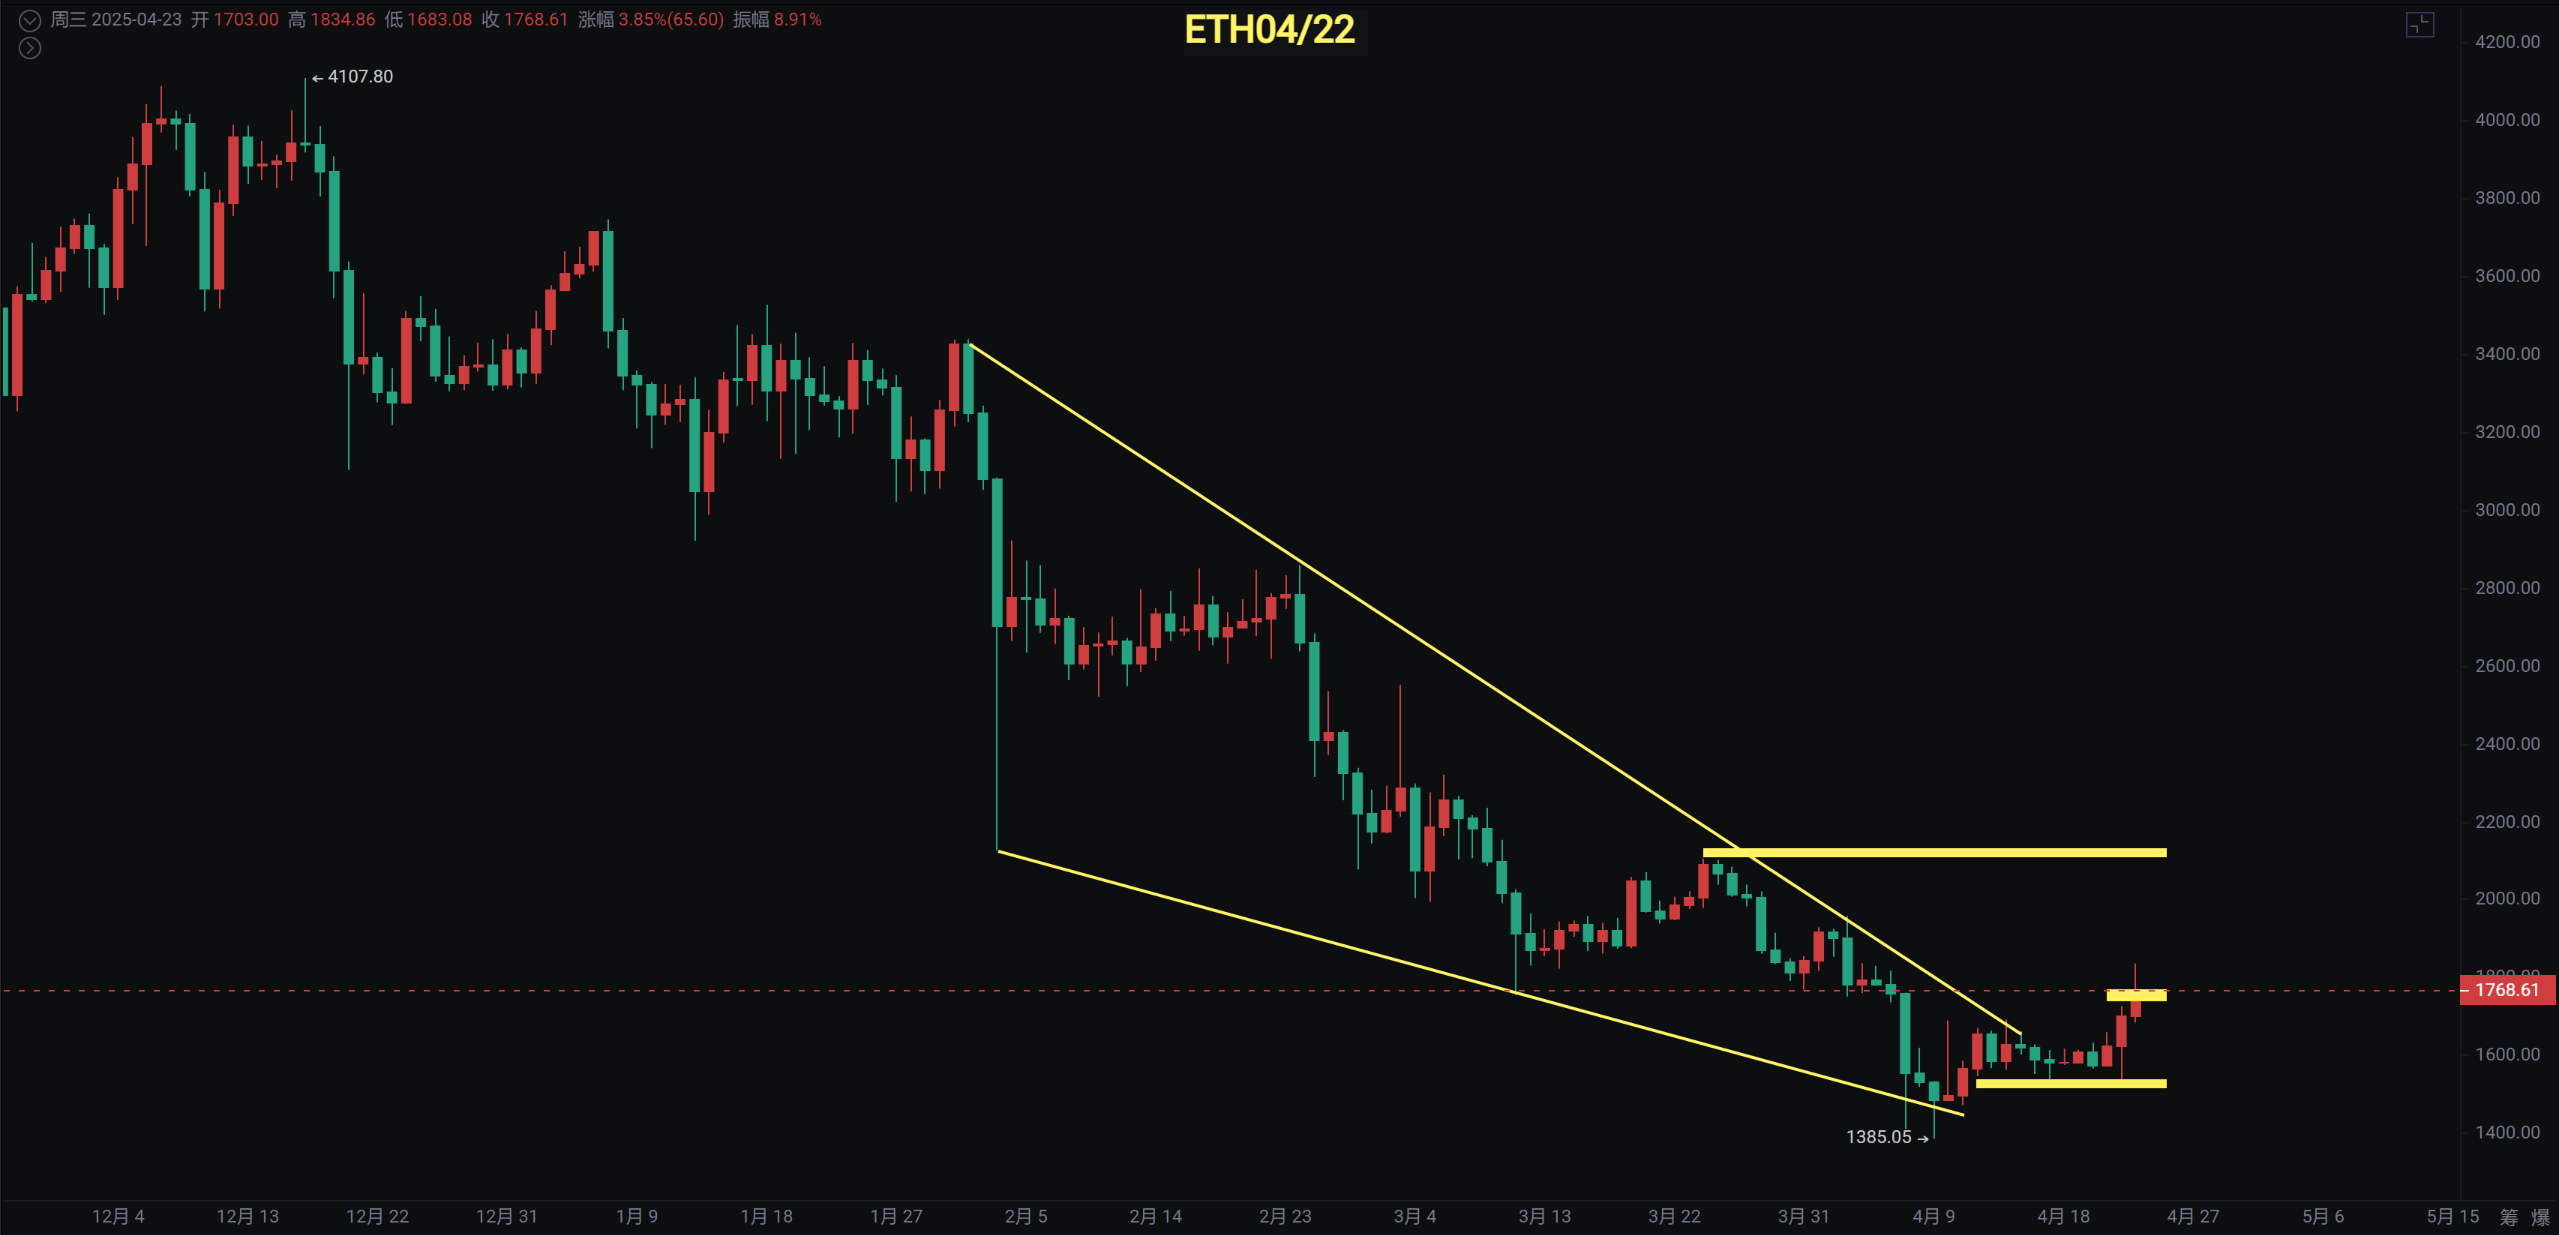
Ethereum
The daily chart has broken through 1754, with a maximum pin bar reaching 1834, also breaking through the previous large bearish candle on the 7th. The daily descending wedge breakout has the potential to reach 2000—2100.
Only if it returns to 2100 without breaking down can we be more optimistic. Currently, it can only be viewed as an oversold rebound. ETH/BTC is rebounding near historical lows, and it is temporarily uncertain whether the exchange rate has bottomed out.
Support: 1600—1690
Resistance: 1957—2100
If you like my views, please like, comment, and share. Let's navigate through the bull and bear markets together!!!
This article is time-sensitive and for reference only; it is updated in real-time.
Focusing on K-line technical research, sharing global investment opportunities. Official account: BTC Trading Prince Fusu

免责声明:本文章仅代表作者个人观点,不代表本平台的立场和观点。本文章仅供信息分享,不构成对任何人的任何投资建议。用户与作者之间的任何争议,与本平台无关。如网页中刊载的文章或图片涉及侵权,请提供相关的权利证明和身份证明发送邮件到support@aicoin.com,本平台相关工作人员将会进行核查。


