Key Signals in the Bitcoin Cycle
Author: Bitcoin Magazine Pro

Bitcoin in 2025 has not experienced the explosive start that many expected. After the price broke through $100,000, there was a significant pullback, leading investors and analysts to question our position in the overall Bitcoin cycle.
This article will delve through the market noise to analyze a series of key on-chain data and macro indicators to assess whether Bitcoin's bull market is still intact or if it will face a deeper correction.
01
Healthy Pullback or Cycle End?
A good starting point is the MVRV-Z score, a long-used valuation metric that compares market value to realized value. After peaking at around 3.36, the MVRV-Z score has dropped to about 1.43, coinciding with Bitcoin's decline from over $100,000 to a low of $75,000. At first glance, this 30% pullback seems severe.
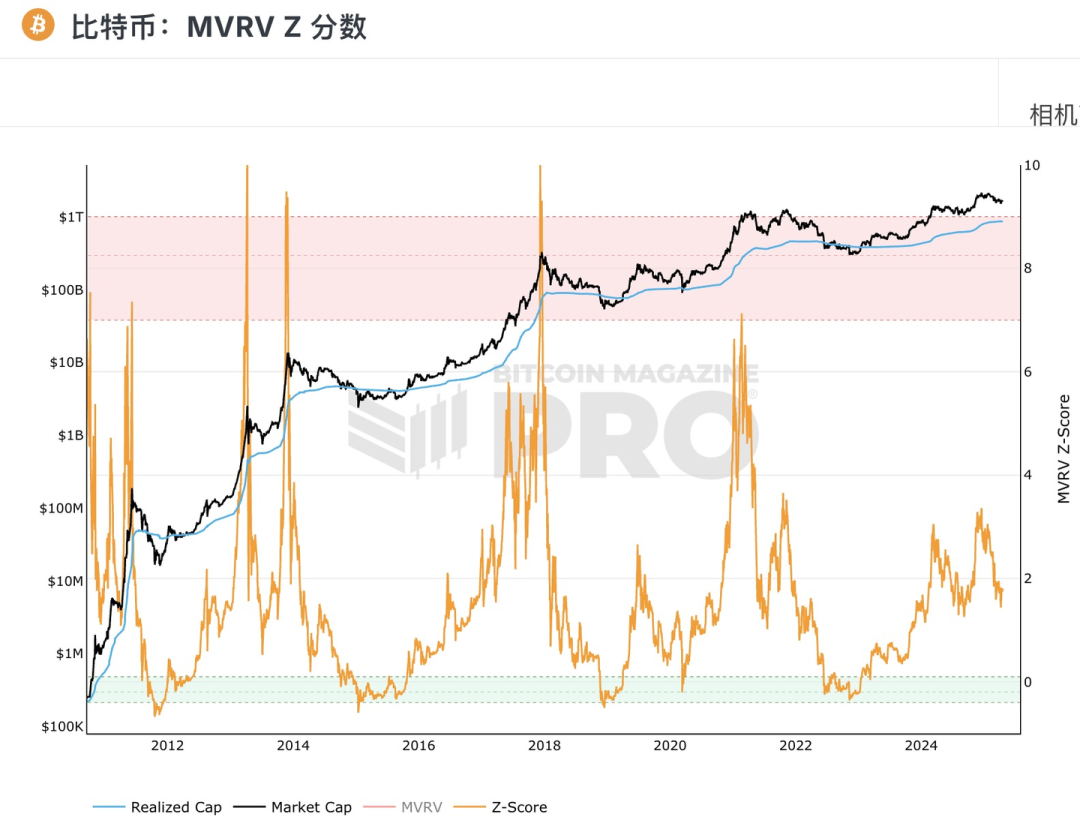
Figure 1: The recent MVRV Z score has rebounded from a low of 1.43 in 2025.
Historically, periods with MVRV-Z scores at similar levels often mark local bottoms rather than tops. Previous cycles, including 2017 and 2021, experienced similar pullbacks followed by price recoveries. In short, despite this drop shaking investor confidence, it aligns with historical pullbacks during bull markets.
02
Focus on Smart Money
Another key indicator is the Value Days Destroyed (VDD) multiple. This metric measures the velocity of Bitcoin movement, weighted by the time coins are held. Peaks in the VDD multiple typically indicate that seasoned holders are taking profits, while low levels suggest accumulation.
Currently, this indicator is at a low in the "green zone," similar to levels seen in the late stages of a bear market or early recovery phase. Given the sharp reversal in price from over $100,000, we may be witnessing the end of a profit-taking wave, with signs of long-term accumulation re-emerging, signaling expectations for higher prices.
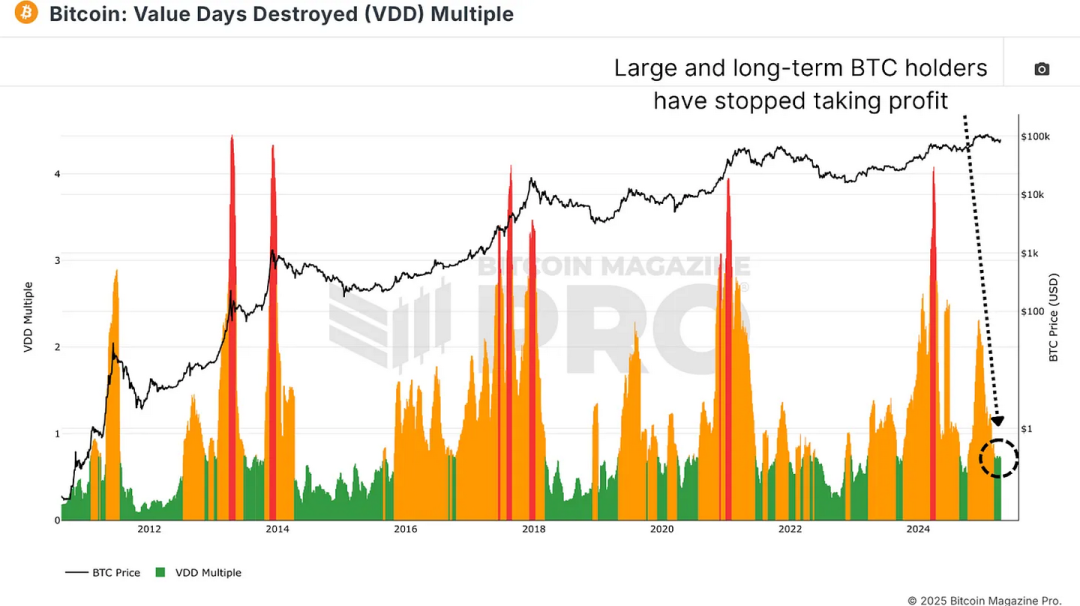
Figure 2: The current VDD multiple indicates that long-term holders are in an accumulation phase.
The Bitcoin Cycle Capital Flow Chart is one of the most insightful charts in on-chain data, breaking down capital flows by coin age. It distinguishes different groups, such as new market participants (holding for less than 1 month) and mid-term holders (1-2 years), to observe capital migration. When Bitcoin's price peaked at $106,000, the activity of the red band (new holders) surged, indicating that FOMO-driven buyers rushed in near the top. Subsequently, this group's activity significantly cooled, returning to levels consistent with the early to mid-stages of the bull market.
Conversely, the 1-2 year holder group (typically macro-sensitive accumulators) has begun to rise again. This inverse correlation is crucial: long-term holders accumulate at market lows, while newer participants capitulate or exit at lows. These dynamics resemble the accumulation-distribution patterns seen in earlier bull market cycles (especially in 2020 and 2021).
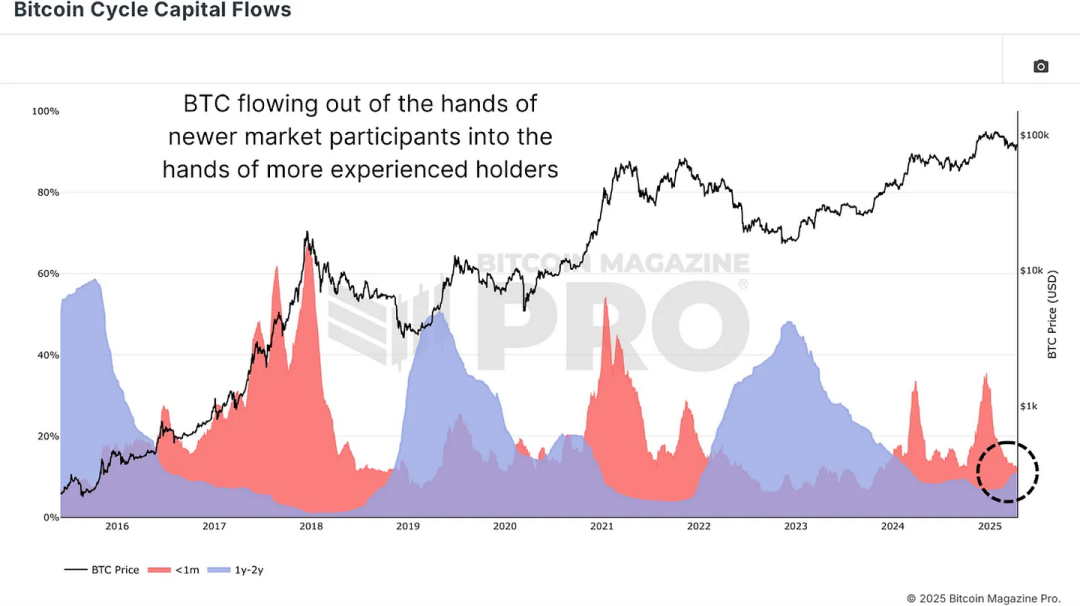
Figure 3: The Bitcoin Cycle Capital Flow Chart shows Bitcoin flowing to more experienced holders.
03
What Stage Are We In Now?
From a macro perspective, we divide the Bitcoin market cycle into three key stages:
Bear Market Stage: Deep pullback (70-90%)
Recovery Stage: Reclaiming previous highs
Bull Market/Exponential Stage: Parabolic rise after breaking previous highs
The bear markets of 2015 and 2018 lasted about 13-14 months. Our recent bear market cycle also lasted 14 months. The recovery stages of past cycles lasted about 23-26 months, and our current cycle is within this time window.
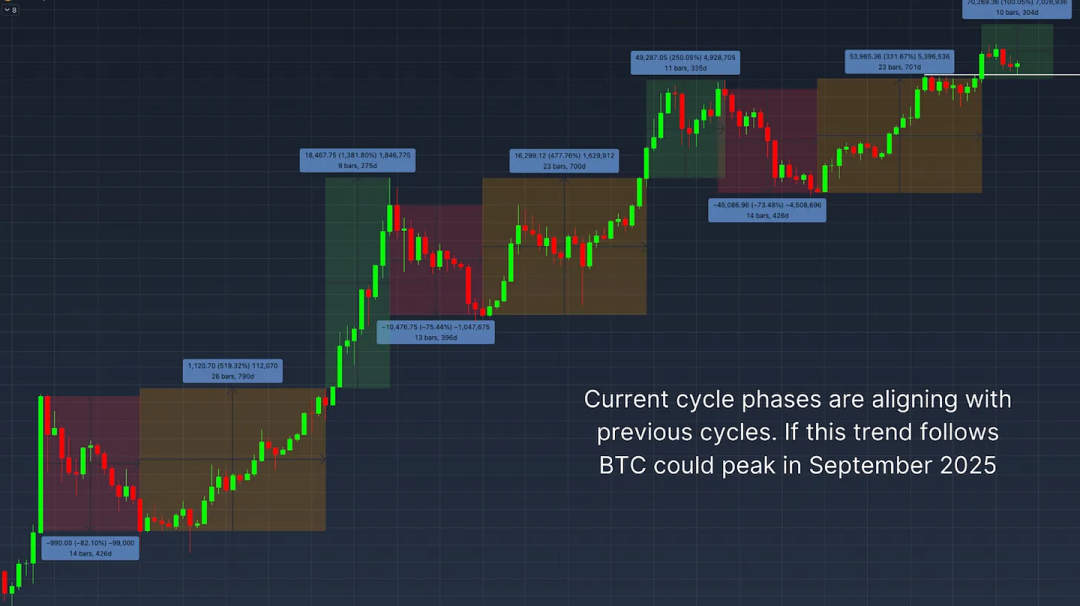
Figure 4: Estimating potential bull market peaks using past cycle trends.
However, this bull market phase is somewhat unusual. After breaking historical highs, the price did not immediately surge but instead experienced a pullback. This may indicate that we are forming a higher low before entering a steeper part of the exponential stage. If we take the average of 9 and 11 months from past cycle exponential stages, the bull market could peak around September 2025, assuming the recovery of the bull market phase.
04
Macro Risks
Despite encouraging on-chain data, macro headwinds remain. Analysis of the correlation chart between the S&P 500 and Bitcoin shows that Bitcoin remains highly correlated with the U.S. stock market. As concerns about a global economic recession grow, the continued weakness in traditional markets may limit Bitcoin's upward potential in the short term.
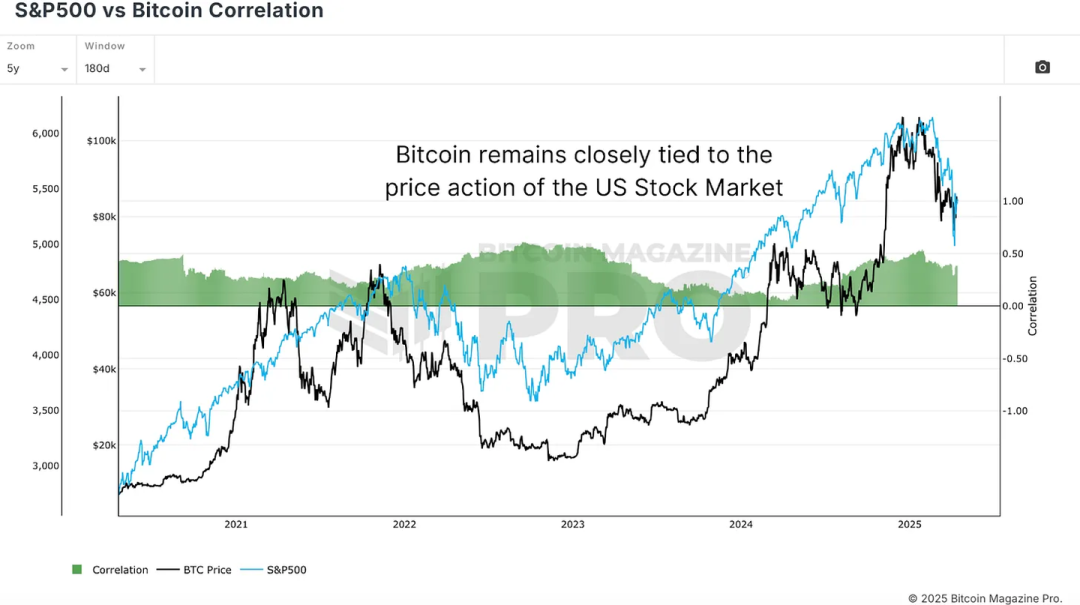
Figure 5: Correlation between Bitcoin and the U.S. stock market.
05
Conclusion
As we have seen in our analysis, key on-chain indicators such as the MVRV Z score, Value Days Destroyed, and Bitcoin Cycle Capital Flow show healthy and cycle-consistent behavior, along with signs of accumulation by long-term holders. However, significant macro uncertainty still exists in the market, which is a key risk to watch.
This cycle is slower and more uneven than past cycles, but it has not broken historical structures. If further deterioration in traditional markets can be avoided, Bitcoin seems poised for the next wave of upward movement, potentially peaking in the third or early fourth quarter.
Article link: https://www.hellobtc.com/kp/du/04/5752.html
Source: https://mp.weixin.qq.com/s/CGpbQeRBvR3Wcp0EPOHGqA
免责声明:本文章仅代表作者个人观点,不代表本平台的立场和观点。本文章仅供信息分享,不构成对任何人的任何投资建议。用户与作者之间的任何争议,与本平台无关。如网页中刊载的文章或图片涉及侵权,请提供相关的权利证明和身份证明发送邮件到support@aicoin.com,本平台相关工作人员将会进行核查。


