Original Title: Is Base "stealing" Ethereum's GDP?
Original Author: Michael Nadeau, Founder of The DeFi Report
Original Translation: xiaozou, Jinse Finance
Last month, Standard Chartered Bank released a report titled "Ethereum's Midlife Crisis," which sparked heated discussions. The report estimates that Base has caused a $50 billion evaporation of Ethereum's market value and "stolen GDP," leading to a reduction of ETH's year-end target price from $10,000 to $4,000. This raises a core question: Did Standard Chartered misjudge ETH at the bottom of the L2 "J curve"? Or is a structural recession indeed set to continue?
In this article, we will re-examine Standard Chartered's conclusions while offering our own insights.
1. The "Partnership" Between Base and Ethereum
Assuming you are Ethereum and I am Base. We are both building critical infrastructure for web3. One day, I propose to you: instead of competing with another L1, why not collaborate?
As Base, my collaboration needs are:
- Share Ethereum's security and settlement layer (the cost of building my own validators is too high)
- Establish a native cross-chain bridge to connect Ethereum users and assets
- Share liquidity and developer ecosystem
- Reduce operational costs
- Be compatible with EVM and surrounding infrastructure
As Ethereum, you hope to:
- Acquire new users through the Coinbase channel
- Increase ETH demand (transactions and on-chain services)
- Gain feedback from enterprise-level clients
- Create fee income for validators
- Enhance throughput and user experience
Both parties form a synergy of 1+1>3. Now, two years later, let’s verify the results with on-chain data.
2. Base's Economy and On-Chain Data
User Fees
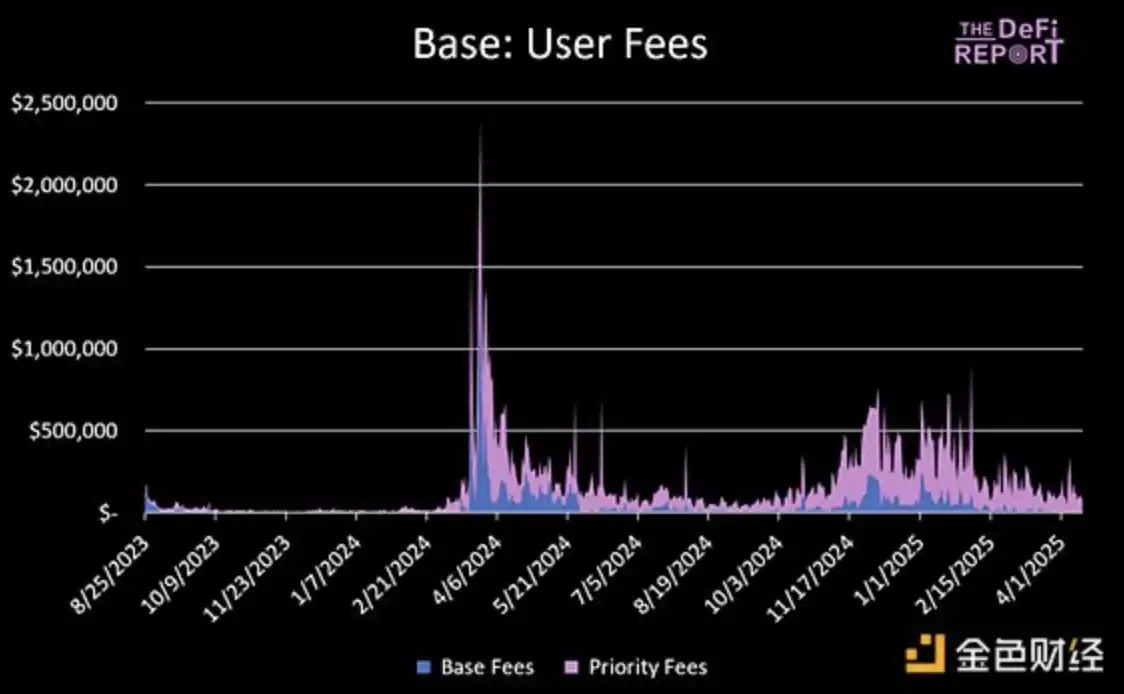
Since its inception, Base has generated a total of $24.8 million in base fees and $81.9 million in priority fees. In 2024, Base's revenue ($74 million) will account for 1.1% of Coinbase's total annual revenue.
Base is currently the fastest-growing and most profitable Ethereum L2, launching two years after its biggest competitor, Arbitrum.
Base GDP
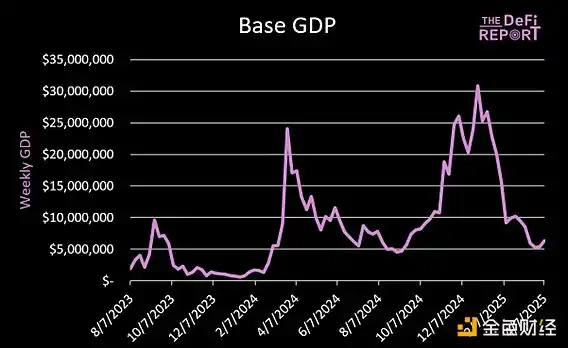
Base's on-chain applications have generated a total of $768 million in fees (cumulative "GDP"), with major contributors including DeFi protocols like Uniswap and Aerodrome.
The "GDP" measures the fees paid by end users for using on-chain applications (excluding gas fees).
Daily New Addresses
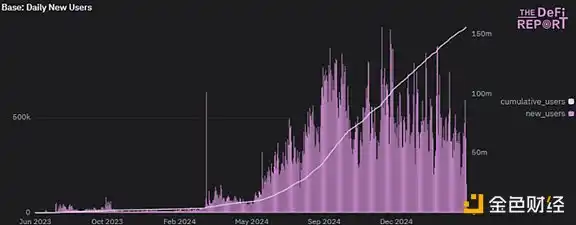
In the past 30 days, Base has seen an average of 412,000 new addresses daily. Since its launch in August 2023, Base has attracted a total of 155 million addresses interacting. Base is directing new users to the Ethereum ecosystem.
Base Bridging ETH
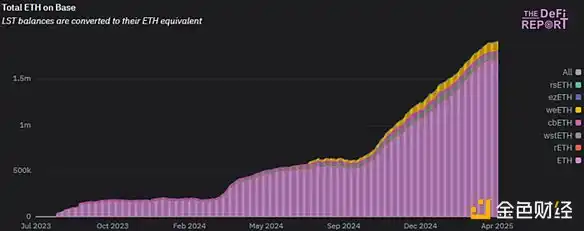
Currently, there are 1.917 million ETH (including LST) on the Base chain, accounting for 1.6% of the circulating supply, creating new demand for ETH.
Daily Bridged Assets

Through the native cross-chain bridge, $50 million to $200 million in assets flow between L1 and L2 daily (with ETH accounting for 80%). In the past 30 days, $503 million in assets flowed back from Base to Ethereum. Over the past 90 days, $3 billion in assets flowed back from Base to Ethereum, confirming that Ethereum remains a cross-chain hub.
Stablecoin Supply
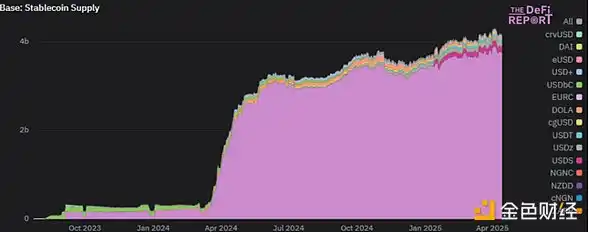
The stablecoin supply on Base has reached $4.2 billion (with USDC accounting for 91%), with a total locked value of $9.9 billion, of which $6 billion are native assets and $3.3 billion come from Ethereum cross-chain. This creates more application scenarios for Ethereum.
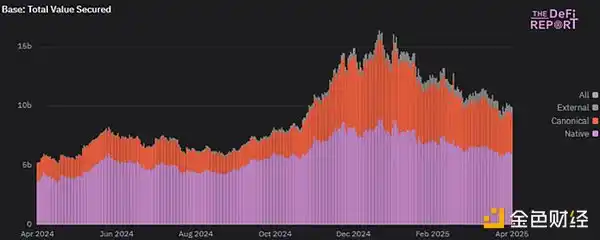
Base's current valuation is $9.9 billion. Of this, $6 billion are "native" assets, meaning these assets were issued on Base. $3.3 billion are "canonical" assets, meaning these assets were bridged from Ethereum. $600 million are considered "external" assets, meaning these assets were bridged from other chains.
Similarly, Base has created net new demand for ETH through native tokenized assets.
In summary, in less than two years, Base has leveraged Ethereum to:
- Become the largest and fastest-growing L2, earning $106 million in user fees.
- Introduce 157 million new addresses to Ethereum (including some L1 user migrations).
- Build an application ecosystem that generates $768 million in fees.
- Bridge 1.91 million ETH, creating additional on-chain service demand.
- Increase stablecoin value by $4 billion (Coinbase holds about 50% of USDC).
- Issue $6 billion in native assets while bringing in $3.3 billion in Ethereum assets.
We believe Ethereum has achieved a collaborative value of 1+1=3 here. But how does Ethereum benefit itself?
3. Base's Contribution to Ethereum's "Security Franchise"
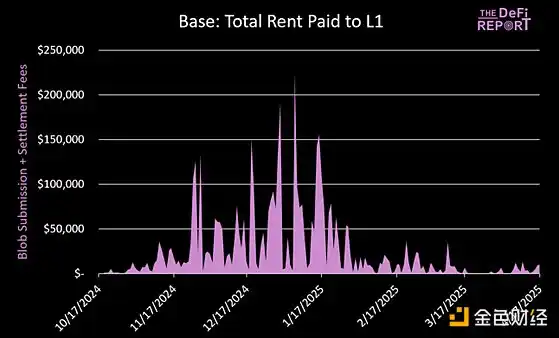
Base has cumulatively paid $4.5 million in blob and settlement fees to L1 (which are burned), with an on-chain profit margin of 91% over the past six months (excluding off-chain costs). It is important to note that Base has paid a total of $24 million in L1 fees, of which 80% occurred before the implementation of EIP4844 (cheaper blobs); our analysis does not include the previous call data phase.
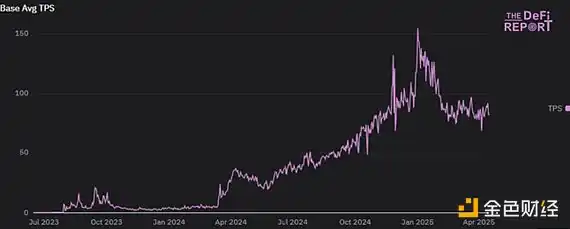
Currently, Base processes an average of 93 TPS, effectively expanding Ethereum's capacity.
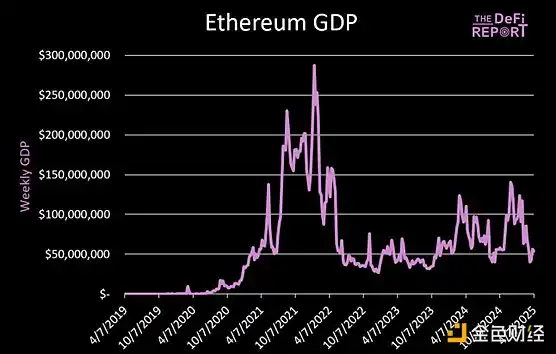
Since Base's launch in August 2023, Ethereum's weekly GDP has grown by 75%, but it is still 80% lower than the peak in early 2022. Currently, the daily GDP of L1 applications is $57 million, while the weekly GDP of Base applications reaches $6.8 million.
Returning to the core question: Is Base "stealing" Ethereum's GDP?
The answer is affirmative!
This is precisely the significance of the L2 roadmap. Top applications (like Uniswap, Aave) are expanding to Base, and new projects (like Aerodrome) are directly choosing Base over L1. The migration of users to L2 has led to a decrease in L1 fees and ETH burn, and Ethereum is shifting towards a more enterprise/B2B-oriented business model.
Only when L2 can no longer make up the gap through blob fees in the future will this constitute a "bug" for Ethereum.
4. Base Growth Forecast and ETH Value Capture
Based on current data, we believe Ethereum is investing in its long-term future through the L2 roadmap, sacrificing GDP, fees, and ETH burn in the short term, hoping that Base can scale, establish a replicable template (traditional finance?), and drive the ecosystem in a positive direction.
Current Situation Analysis:
- L2 currently processes about 165 TPS in total and needs to compete for blob space.
- 3-4 L2s continuously fill the current target of 3 blobs per block (maximum of 6); during this time, L2s bid against each other, raising fees.
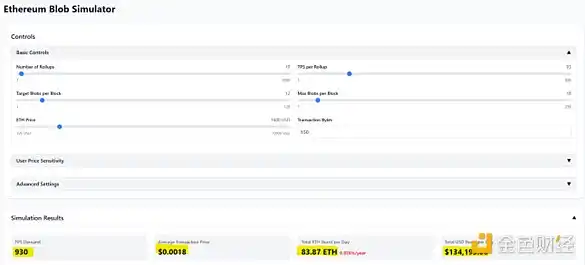
- The target blobs per block are currently 3 (maximum of 6), but next month, the Pectra upgrade will increase this to 6 (maximum of 9 blobs per block). Therefore, in our initial scenario analysis, we assume a target of 6 blobs, with a maximum of 9 blobs.
- We are using the Blob simulator created by Tim Robinson.
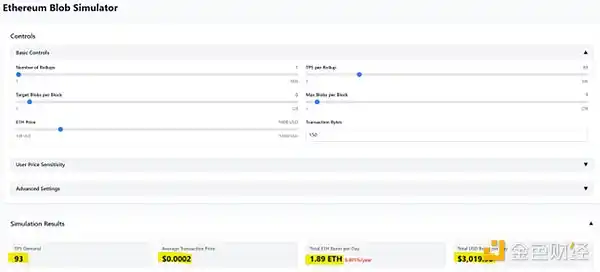
As shown in the figure, the current state has a negligible impact on Ethereum's economy, with L2 fees at $0.0002.
A 5-fold increase in Base TPS would lead to slightly higher L2 fees while bringing more value to Ethereum L1 (annualized at $24.5 million).
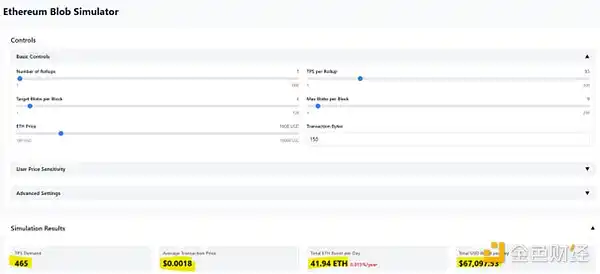
Base TPS increasing tenfold would lead to a 200-fold surge in L1 annual revenue to $4.9 billion (which validators would welcome). However, we have also created another problem: the average L2 fee would rise to $0.35 (unacceptable).
The PeerDAS and Fusaka upgrades (expected in Q3/Q4 this year) will increase the blob per block to 12 (with a final target of 48 and a maximum limit of 72). Assuming Base TPS increases tenfold and the initial Fusaka upgrade is completed:
- The average L2 fee can be controlled at $0.0018
- L1 annual revenue would be $48.9 million
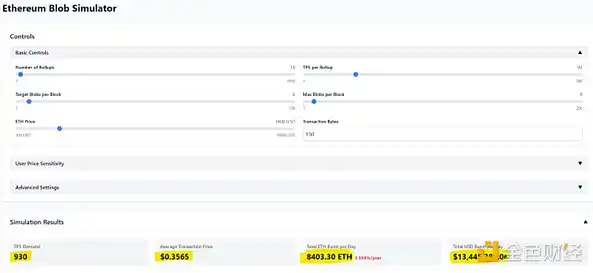
If Arbitrum and Optimism also achieve a tenfold expansion simultaneously:
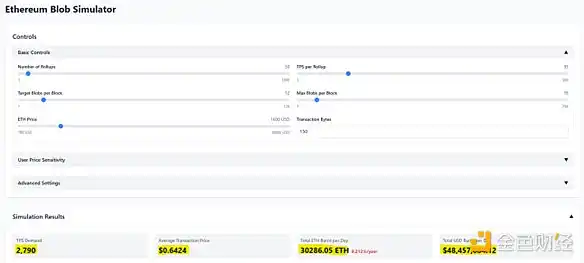
- L1 annual revenue could reach $17.7 billion (nearly double the peak in 2021)
- But once again, we create a bottleneck, with the average L2 cost per transaction rising to $0.64. This is not feasible.
Let’s optimistically estimate that the target blob increases to 24 in a year:
- L1 annual revenue drops to $9.6 billion
- The average L2 fee still reaches $0.17
To keep the average L2 fee below $0.02, 33 target blobs per block are needed, at which point L1 annual revenue would only be $1.4 billion—exactly equal to the actual revenue over the past 365 days.
Summary:
We aim to simplify the analytical model to clarify two core mechanisms: 1) The impact of increased L2 transactions per second (TPS) on blob pricing; 2) The transmission effect of increasing the number of target blobs per block on Ethereum's economic model and L2 user fees. In reality, we fully recognize the dynamism and unpredictability of the market environment—there may be hundreds of L2s competing for blob space in the near future.
We are confident that L1 will continue to host a large amount of on-chain activity, generating fee income and promoting ETH burn. However, the specific application scenarios and transaction scales are currently unclear.
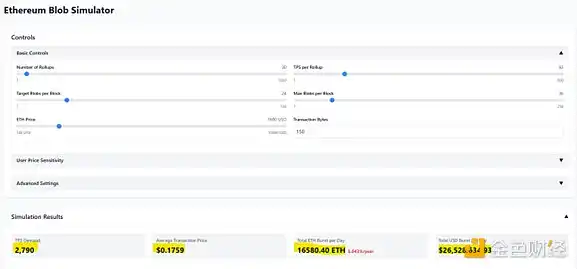
According to the simulation results (assuming the three major L2s achieve the current tenfold TPS of Base), when the total L2 TPS reaches 2,790, even with the completion of the Pectra technical upgrade, the Ethereum network will still face overload pressure (at this point, the cost of a single L2 transaction reaches $0.35).
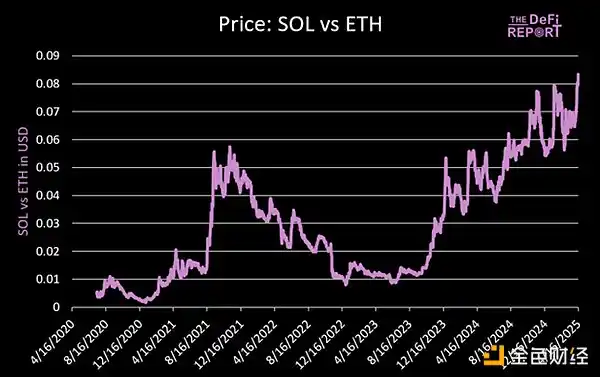
In contrast, Solana has consistently processed 1,078 TPS over the past 90 days, with an average fee of only $0.016 (including base fee + priority fee), and actual user fees are even lower—due to its network adopting a dynamic pricing mechanism based on transaction types, and its performance upgrade plan, Firedancer, has not yet officially launched.
5. Conclusion
"There is no perfect solution, only trade-offs" is particularly applicable here. Base has quickly started through the L2 model and is currently achieving ideal returns, but it has also bound itself to an uncontrollable Ethereum expansion path, potentially facing "vendor lock-in" and technical debt risks.
Ethereum seems to gain enterprise-level clients by sacrificing L1 fees, creating new demand for ETH and a better user experience. However, the sustainability of this long-term economic relationship is questionable—the scenario analysis indicates that expansion bottlenecks may persist. If L2 cannot expand rapidly, it may need to increase ETH issuance to maintain validator earnings (after EIP4844, ETH supply has shifted from deflationary to potentially exceeding BTC).
We believe Base is satisfied with the current situation, but if Ethereum's blob expansion is ineffective, it may seek alternatives like Celestia. Ethereum urgently needs to shift its culture from "value alignment" to an enterprise-oriented "security as a service" business model.
Returning to the initial question: Did Standard Chartered misjudge at the bottom of the "L2 J curve"? We believe that the structural decline in Ethereum's fundamentals will continue in the short term. Although traditional finance going on-chain may improve market sentiment, there is a lack of fundamental improvement catalysts. The following chart shows that there is still a long way to go.
免责声明:本文章仅代表作者个人观点,不代表本平台的立场和观点。本文章仅供信息分享,不构成对任何人的任何投资建议。用户与作者之间的任何争议,与本平台无关。如网页中刊载的文章或图片涉及侵权,请提供相关的权利证明和身份证明发送邮件到support@aicoin.com,本平台相关工作人员将会进行核查。


