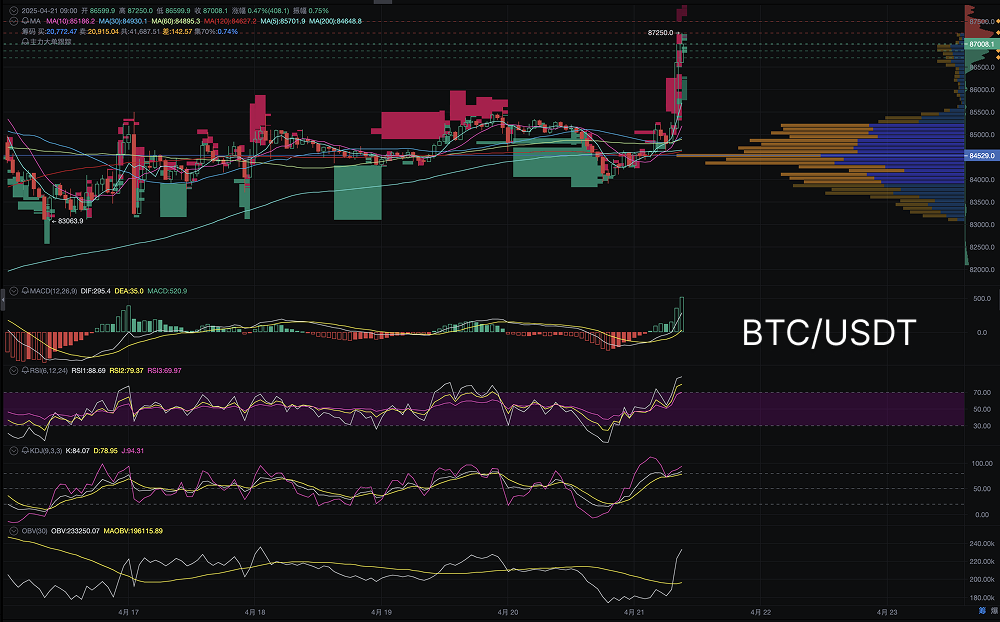
Bitcoin experienced significant volatility on April 21, with prices briefly surpassing $87,000 and reaching a high of $87,250. This surge followed a relatively stable consolidation phase, indicating that the market's buying power has recovered and there may be more room for upward movement.

Candlestick Patterns and Market Trends:
- Candlestick Patterns and Breakout
On April 21, Bitcoin's price saw a strong increase, breaking through the key resistance level of $84,500 and quickly reaching $87,250. This surge was accompanied by the formation of a large bullish candlestick, indicating extremely optimistic market sentiment. Notably, after the price breakout, trading volume significantly increased, showing a buyer-dominated market.
From the candlestick pattern perspective, the price broke above the upper boundary of the previous consolidation range ($83,000 to $84,500) and formed a clear "V-shaped reversal" pattern, which typically suggests that the market may continue to maintain an upward trend, especially when there is no strong selling pressure in the short term.
- Volume Analysis
Through the Volume Profile, we can see that the $84,500 to $85,000 range is currently a key support area, with very dense trading volume within this range. The current price breaking through this price range indicates that the market has effectively absorbed the selling pressure in this area. If a pullback occurs in the future, it is expected to find support at this support area.
Technical Indicator Analysis:
- MACD Indicator: The MACD (12, 26, 9) shows a clear bullish trend. The DIF line is firmly above the DEA line, and the histogram is showing an upward trend, indicating that the market's upward momentum is strengthening. Currently, the MACD chart does not show any obvious sell signals, suggesting that Bitcoin's short-term upward momentum remains strong.
- RSI (Relative Strength Index): Bitcoin's current RSI value is 88.69, close to the overbought zone of 90. Although the RSI value is at a high level, suggesting that the market may be at risk of short-term overheating, since the RSI has not entered the extreme overbought area and still has some room for upward movement, this indicator has not issued a strong sell signal. In the short term, if the RSI breaks above 90, caution should be exercised regarding the risk of price pullback.
- KDJ Indicator: The KDJ indicator's K line and D line show a very strong upward momentum. Notably, the K line value (84.07) is above the D line (70.25), while the J line (94.31) is at a high level, indicating that the market may continue to maintain strong upward momentum in the short term. This trend in the KDJ indicator is a strong bullish signal, suggesting that investors should maintain a bullish strategy in the short term.
- OBV (On-Balance Volume): The OBV indicator shows extremely positive capital inflow, with the current OBV value at 233,520.07, far exceeding levels from the past few weeks. The capital inflow accompanying the price increase indicates strong financial support behind this surge. A high OBV value typically means strong buying in the market, suggesting that the price uptrend is sustainable.
Large Capital Movements and Market Sentiment:
- Large Capital Inflows
On-chain data shows that there has been a significant inflow of large capital into Bitcoin, especially when breaking through the $84,500 range, with multiple major exchanges receiving large deposits. The inflow of large capital usually indicates that the market holds an optimistic view of Bitcoin's future performance, and this capital may also become a driving force for further price increases.
- Market Sentiment:
According to market sentiment analysis, Bitcoin's market sentiment is currently in an extremely optimistic state. The Fear and Greed Index shows that the market is in the extreme greed zone. Nevertheless, this also indicates a higher risk of volatility in the market.
Today's Trend Prediction and Short-Term Outlook:
- Support and Resistance:
- Support Level: The current support level for Bitcoin is mainly around $84,500, where trading volume is dense. If the price pulls back to this range, there is a high likelihood of finding support.
- Resistance Level: The upper resistance level is between $87,500 and $88,000. If the price continues to rise and breaks through this range, it may further challenge $90,000.
- Today's Trend Prediction:
Based on the current technical analysis, Bitcoin may oscillate within the $84,500 to $87,500 range. In the short term, the market remains in a strong upward trend, but due to the RSI value being close to the overbought zone, there may be a risk of short-term pullback. If the price falls below the support level of $84,500, it may test the support area of $82,000. If the price breaks above $87,500, it may initiate a new upward wave, targeting $90,000.
This article represents the author's personal views and does not reflect the stance or views of this platform. This article is for informational sharing only and does not constitute any investment advice to anyone.
Join our community to discuss this event
Official Telegram community: t.me/aicoincn
Chat room: Wealth Group
免责声明:本文章仅代表作者个人观点,不代表本平台的立场和观点。本文章仅供信息分享,不构成对任何人的任何投资建议。用户与作者之间的任何争议,与本平台无关。如网页中刊载的文章或图片涉及侵权,请提供相关的权利证明和身份证明发送邮件到support@aicoin.com,本平台相关工作人员将会进行核查。


