There were no significant news events regarding cryptocurrency over the weekend, mainly just matters concerning Ukraine and Russia. Here’s a brief summary of the intelligence: Last month, Ukraine accepted a 30-day ceasefire proposal from U.S. President Trump, but after the Russian side rejected it, both parties only agreed to limit attacks on energy facilities and maritime operations, while accusing each other of violating the agreement.
On the other hand, U.S. stocks were closed yesterday for Easter. The price of Bitcoin did not show significant fluctuations, continuing to oscillate slightly between $84,000 and $85,000, with the latest quote at $84,600, a decrease of 0.56% in the last 24 hours.
Bitcoin Four-Hour Chart
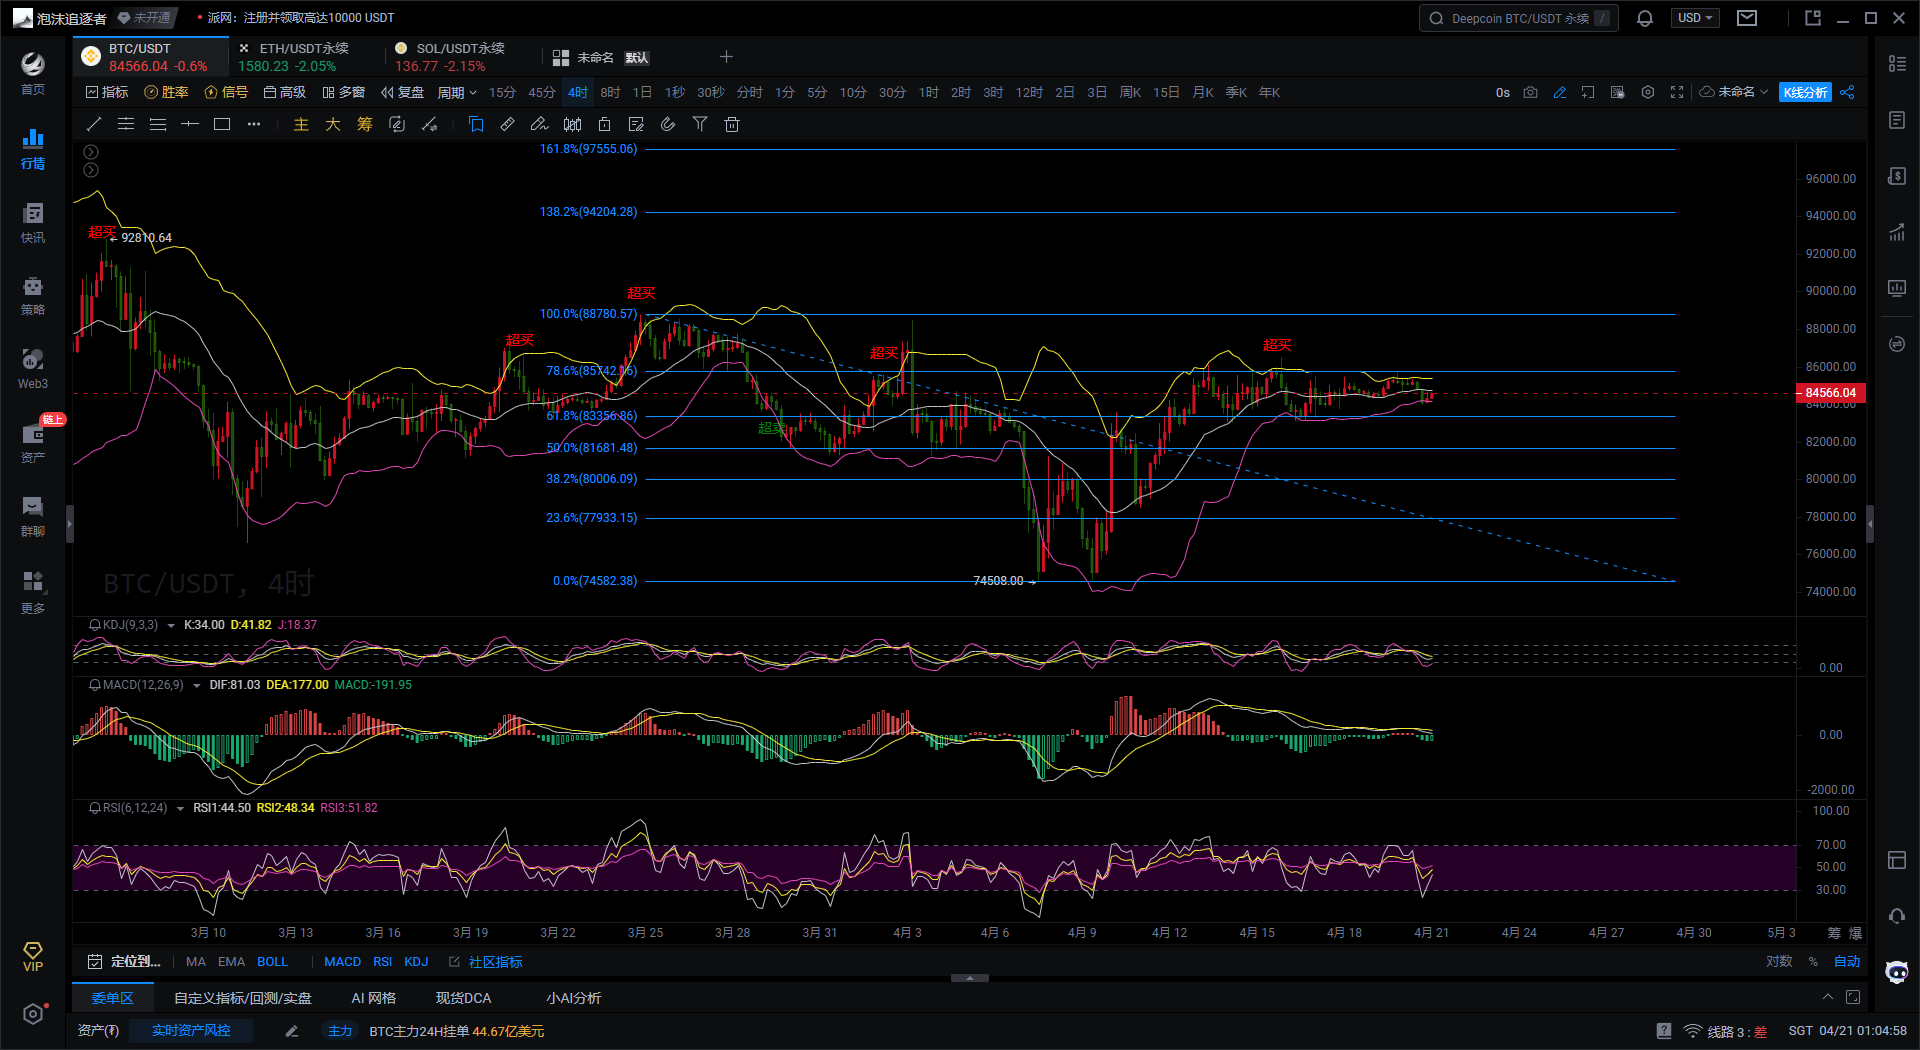
Currently, the price of Bitcoin is hovering between the middle and lower bands of the Bollinger Bands, with the overall opening of the Bollinger Bands narrowing, indicating reduced market volatility and a phase of consolidation. If the price effectively breaks above the middle band, it can be seen as a short-term rebound signal. If it falls below the lower band, it may trigger a new round of decline. The MACD indicator shows that the DIF line is slightly above the DEA line, indicating that bulls still dominate, but the trend is weak. The MACD histogram is green, showing weakened momentum, which may signal a price correction or consolidation. The K and D lines have formed a golden cross at a low level, but their movement is relatively flat, while the J line is still low with signs of a rebound, though the strength is not strong. If the KDJ three lines continue to converge at a low level, there is hope for new rebound momentum. The current price is around the 61.8% and 78.6% Fibonacci retracement levels, with the upper 78.6% forming short-term resistance and 61.8% serving as short-term support.
In summary, the short-term trend is leaning towards a weak oscillation pattern, but there is no clear downward trend yet. The upper short-term resistance is at 85,142; if broken, it could target around 88,780. If it fails to stabilize effectively at 85,142, a short-term pullback to around 83,456 is expected.
Based on the above, the following suggestions are provided for reference:
Suggestion 1: Short near 85,800, target 83,400, stop loss at 86,300.
Suggestion 2: Long near 83,400, target 85,800, stop loss at 82,900.
Instead of giving you a 100% accurate suggestion, I prefer to provide you with the right mindset and trend. After all, teaching someone to fish is better than giving them a fish; the suggestions may earn you a moment, but learning the mindset will help you earn for a lifetime! The focus is on the mindset, grasping the trend, and planning positions in the market. What I can do is use my practical experience to help everyone, guiding your investment decisions and management in the right direction.
Written on: (2025-04-21, 01:00)

(Written by - Master Says Coin) Disclaimer: Online publication has delays; the above suggestions are for reference only. The author is dedicated to research and analysis in investment fields such as Bitcoin, Ethereum, altcoins, forex, and stocks, with years of experience in the financial market and rich practical operation experience. Investment carries risks; proceed with caution. For more real-time market analysis, please follow the official account Master Says Coin for discussion and exchange.
免责声明:本文章仅代表作者个人观点,不代表本平台的立场和观点。本文章仅供信息分享,不构成对任何人的任何投资建议。用户与作者之间的任何争议,与本平台无关。如网页中刊载的文章或图片涉及侵权,请提供相关的权利证明和身份证明发送邮件到support@aicoin.com,本平台相关工作人员将会进行核查。


