Source: Cointelegraph Original: "{title}"
XRP's price dropped 22% from March 19 to March 31, possibly forming a local bottom at $2.02. The price then rose 9% to $2.20 before retreating to the current level.
Has this highly watched cryptocurrency already hit bottom, or will it face a deeper correction?
XRP Shows Bullish Divergence Across Multiple Time Frames
According to market analyst CasiTrades, XRP's Relative Strength Index (RSI) exhibits a clear bullish divergence on lower time frames.
Bullish divergence occurs when the asset's price makes lower lows while the RSI forms higher lows, indicating that the downward momentum is weakening.
"After hitting the 0.786 retracement level at $2.05, XRP shows bullish divergence signals from the 15-minute chart to the 4-hour chart," the analyst stated in an analysis posted on X platform on March 31.
CasiTrades noted that these technical indicators are sending positive signals for a short-term rebound and a potential macro market recovery.
"This is exactly what we expect to see for short-term bottoming and macro indicators! The rebound remains solid!"
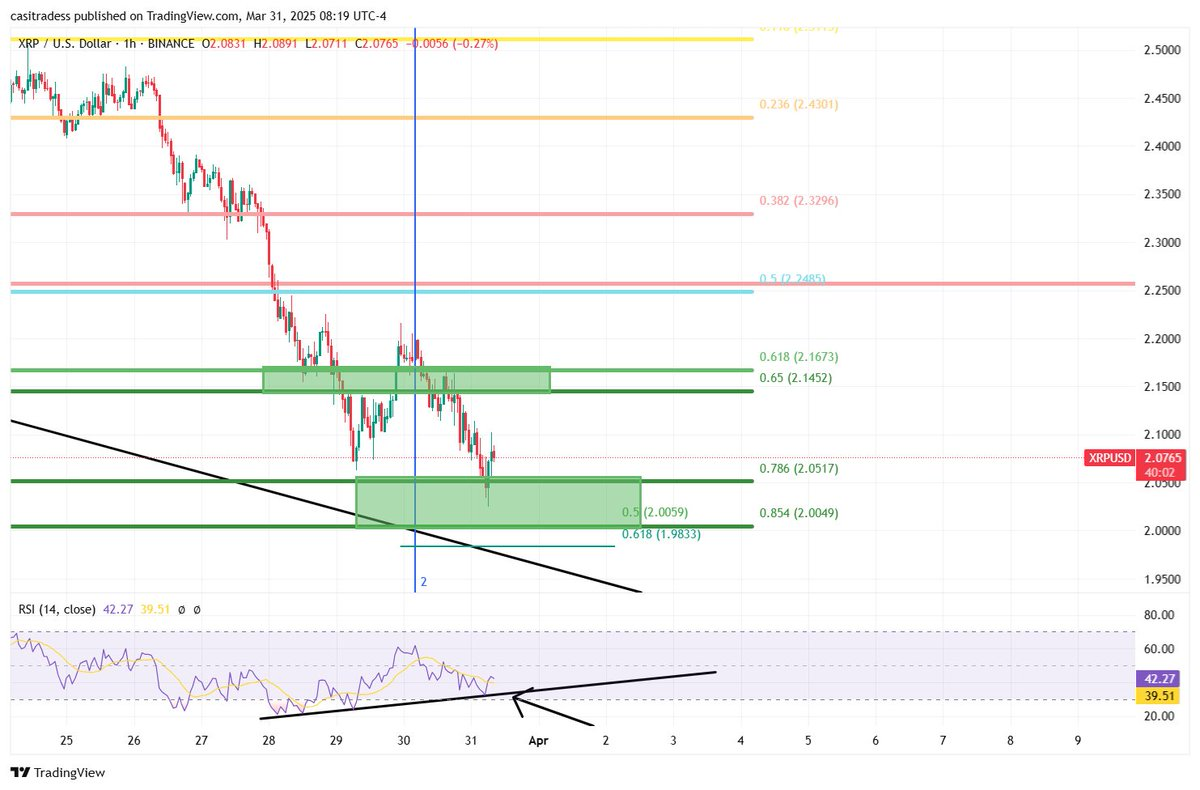
XRP to USD Chart Source: CasiTrades
She further added that $2.25 remains a key resistance level to watch, as a strong momentum breakout above this level would signal a convincing bullish breakout.
"If we can break above $2.25 with strong momentum, it would mean no need to retest support, which is a very bullish signal," CasiTrades stated, adding that if the $2.05 support fails to hold, the demand area between $2.00 and $2.01 will still provide support.
The analyst predicts that XRP will see a favorable trend in April, with short-term price targets set at $2.70 and $3.80.
"Once the price reaches the target levels, I expect a significant rise! Key resistance levels are at $2.70 and $3.80."
Has XRP's local bottom been established?
Despite XRP's recent rebound from local lows, according to veteran trader Peter Brandt's analysis, the market still faces the risk of a deeper correction.
Last week, Brandt pointed out that the emergence of a "textbook" head and shoulders (H&S) pattern could pull XRP's price down to $1.07.
This potential H&S pattern is still developing on the daily chart (see below) and will complete when it breaks and closes below the neckline at $1.90.
If the price remains below the neckline, it could further decline to $1.50, eventually reaching the pattern target of $1.07.
Brandt stated:
"Below $1.90, I do not recommend holding. The target for the H&S pattern is $1.07. This is just an objective reflection of technical analysis."
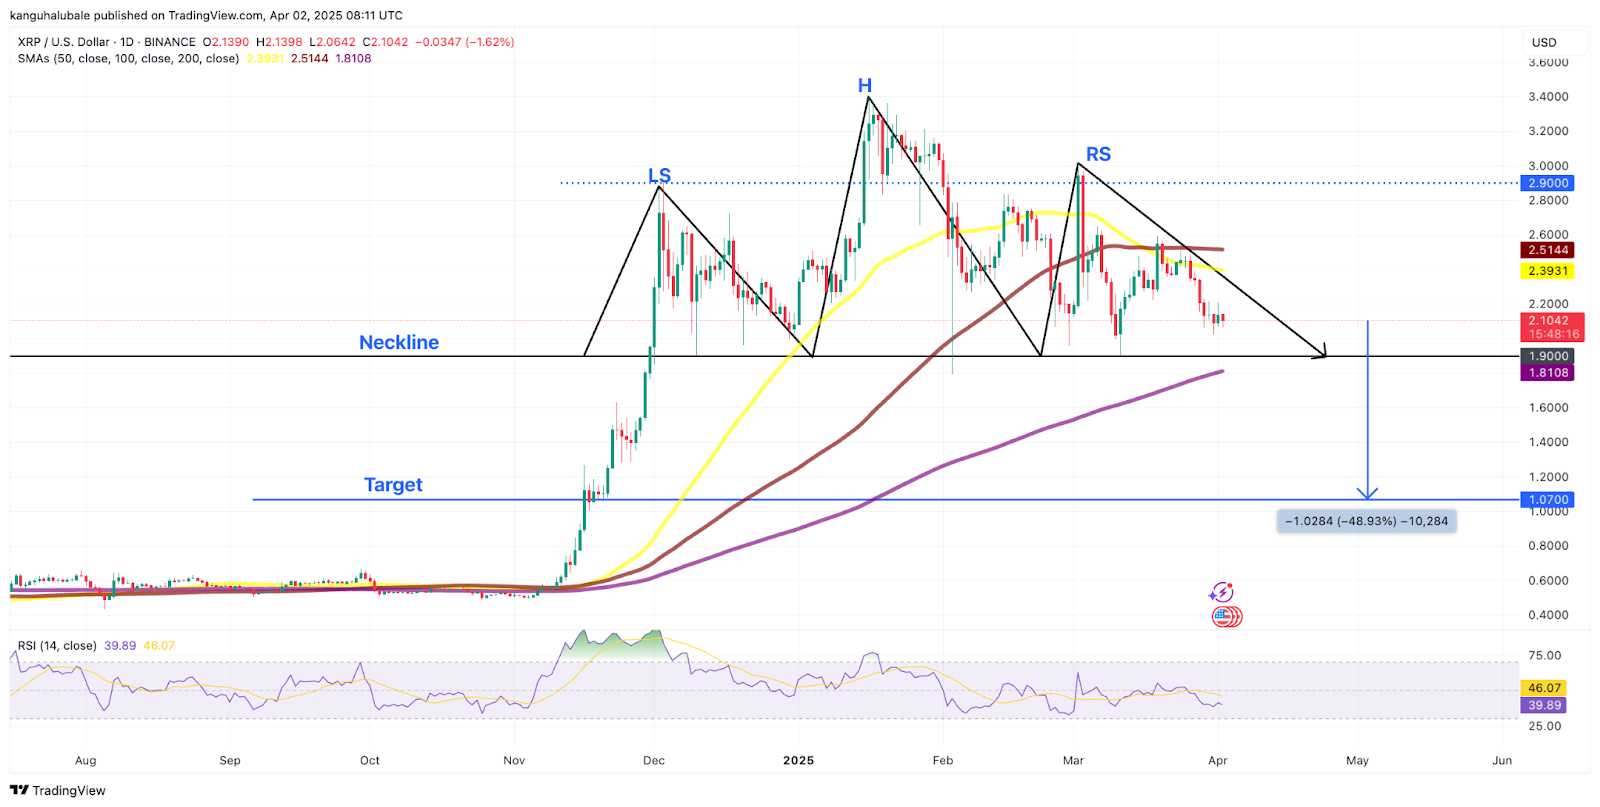
XRP to USD Daily Chart with H&S Pattern Source: Cointelegraph / TradingView
Brandt noted that if buying pressure can push the price up and stabilize above $3.00, this bearish pattern will be invalidated.
Meanwhile, the macroeconomic pressure from U.S. tariff policies on April 2 may affect trading sentiment, pushing XRP's price towards $1.31.
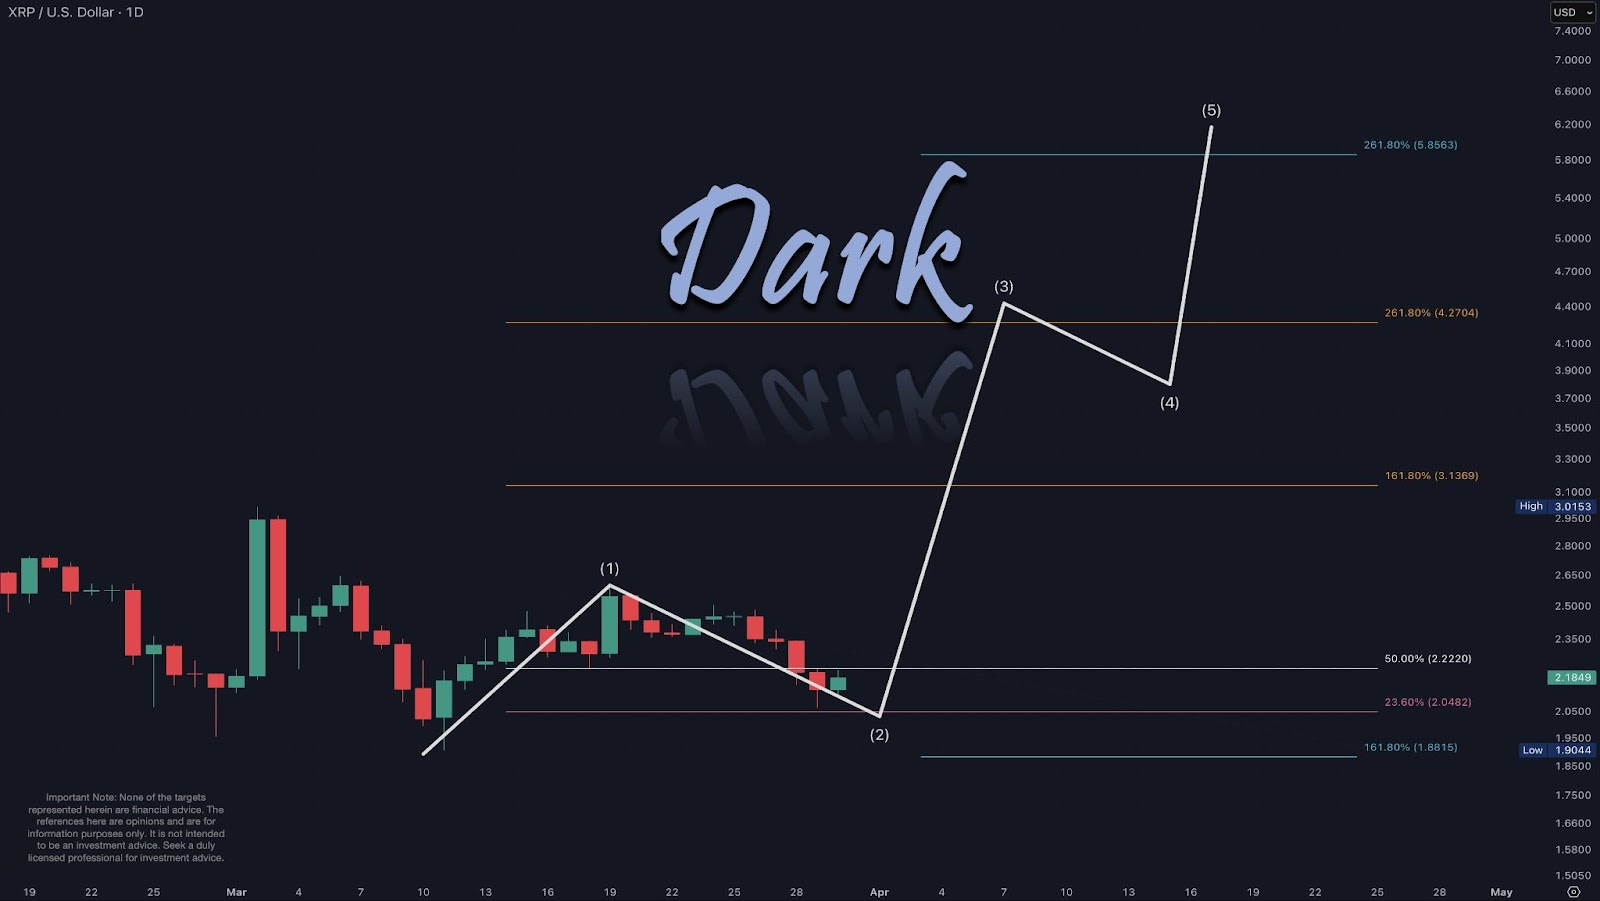
However, not all analysts share the same view. Analyst Dark Defender shared an optimistic outlook, believing that XRP's price may retest the last Fibonacci level of $2.04 before embarking on a new round of rebound.
According to this analyst, a key resistance level for XRP is $2.22, which "needs to be broken" to ensure a sustained recovery towards the target of wave 5 at $8.
"April-May will be exceptionally active, and we expect the target range for wave 5 to be between $5 and $8."
Related Articles: After Bitcoin reaches the "turning point" of $85,000, U.S. unemployment claims suggest market stability.
免责声明:本文章仅代表作者个人观点,不代表本平台的立场和观点。本文章仅供信息分享,不构成对任何人的任何投资建议。用户与作者之间的任何争议,与本平台无关。如网页中刊载的文章或图片涉及侵权,请提供相关的权利证明和身份证明发送邮件到support@aicoin.com,本平台相关工作人员将会进行核查。


