Source: Cointelegraph Original: "{title}"
The price of Ripple (XRP) has risen by 15% over the past week, starting from a low of $1.61. According to several technical analysis experts, if the daily closing price continues to recover and breaks through $2.20, it will signify a strong trend reversal, potentially driving the price to double-digit levels.
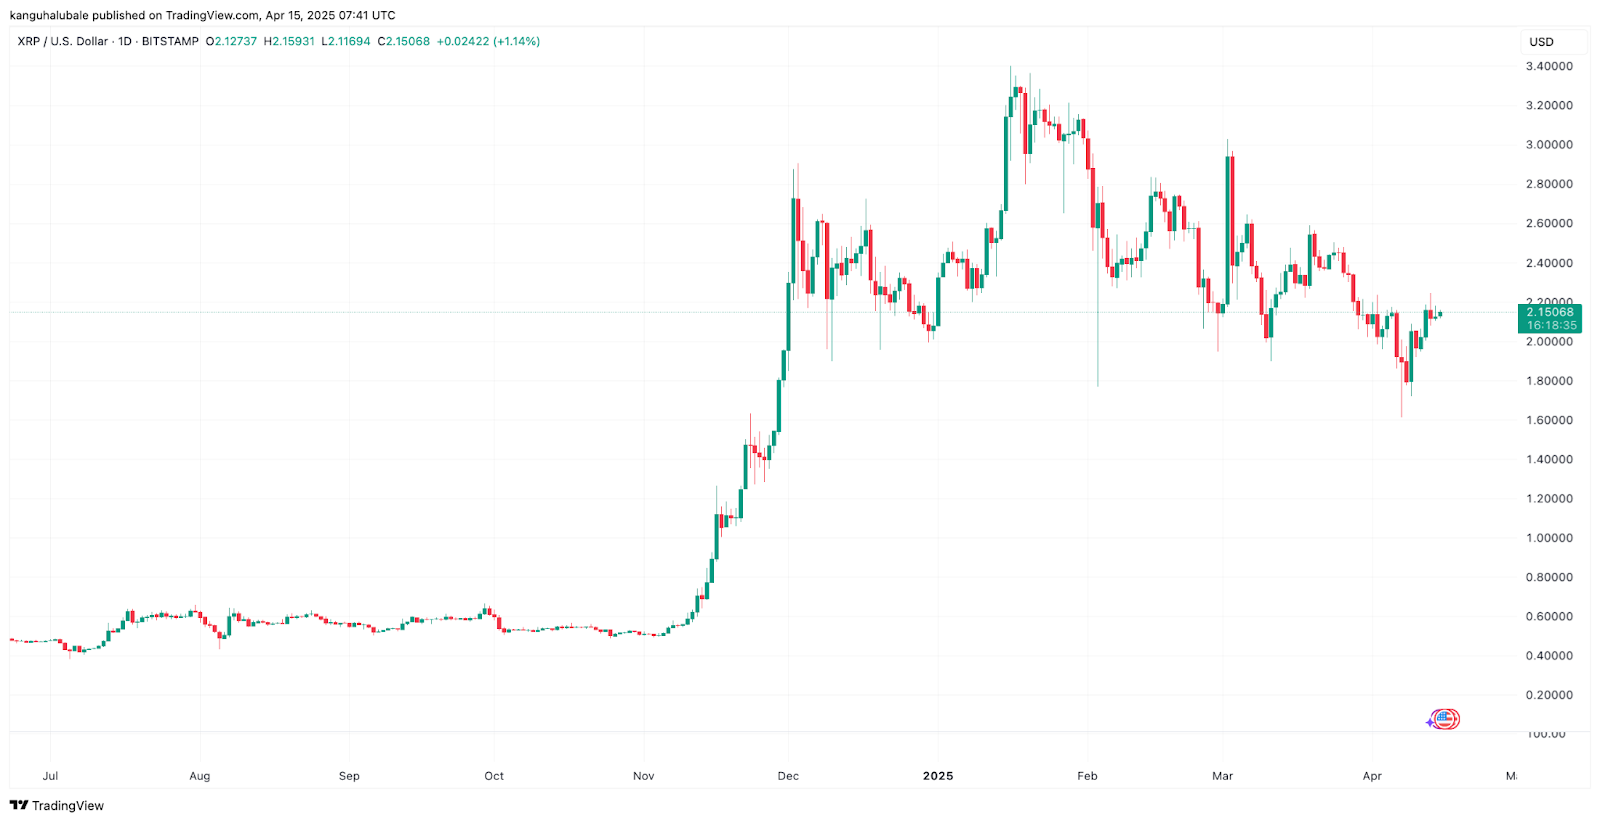
XRP/USD Daily Chart Source: Cointelegraph/TradingView
XRP price needs to return to the $2.20 level. Following the announcement by the former U.S. president regarding tariff exemptions for tech products, the cryptocurrency market has shown signs of recovery, and traders are optimistic about XRP's price breaking into double digits.
Analyst DOM pointed out that XRP recently retested the support level at $1.96 and successfully returned above the key "value area" of $2.00, which was established in December 2024.
"The most critical target right now is $2.20," the analyst stated on April 13 via X platform, further noting that if the price can strongly break through this level, it is expected to rise to $2.50.
The accompanying image shows that the price has re-established itself above the election VWAP (Volume Weighted Average Price) level of $2.03, indicating further upside potential.
"If $2.00 and the election VWAP can maintain support, this chart shows extremely constructive characteristics."
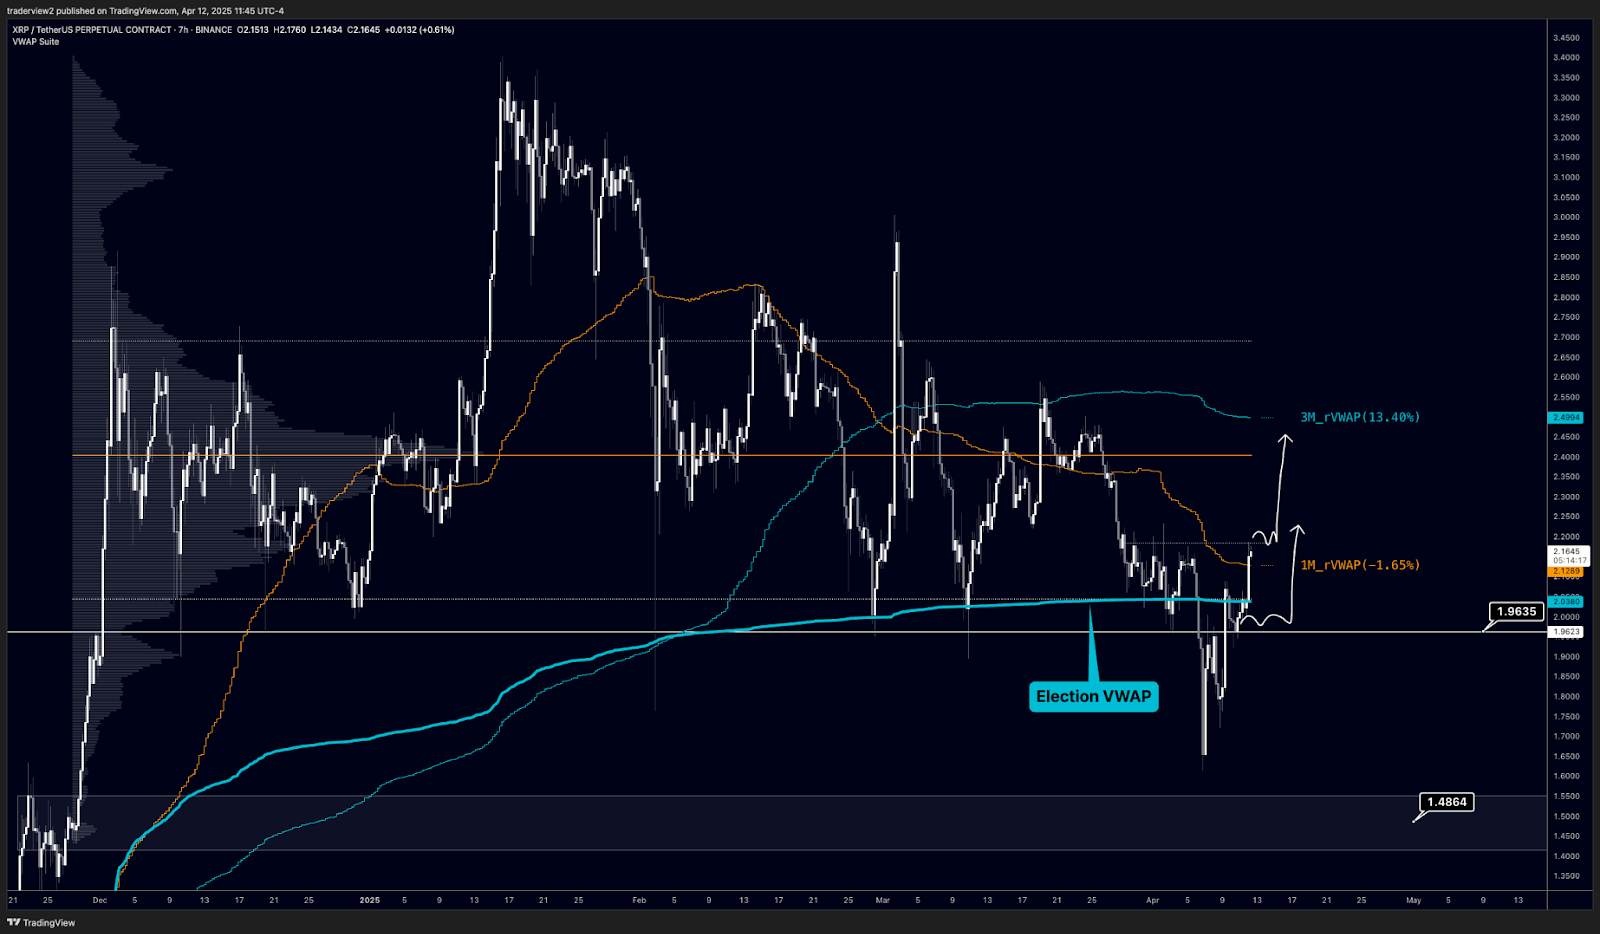
XRP/USD Chart Source: Dom
According to the liquidation heat map data, XRP's immediate support level is at $2.10, which coincides with the 100-day Exponential Moving Average (EMA), making it particularly significant.
This price area is accumulating a large amount of buy order liquidity, which means the likelihood of a retest of the support level and liquidity absorption in the short term is increasing.
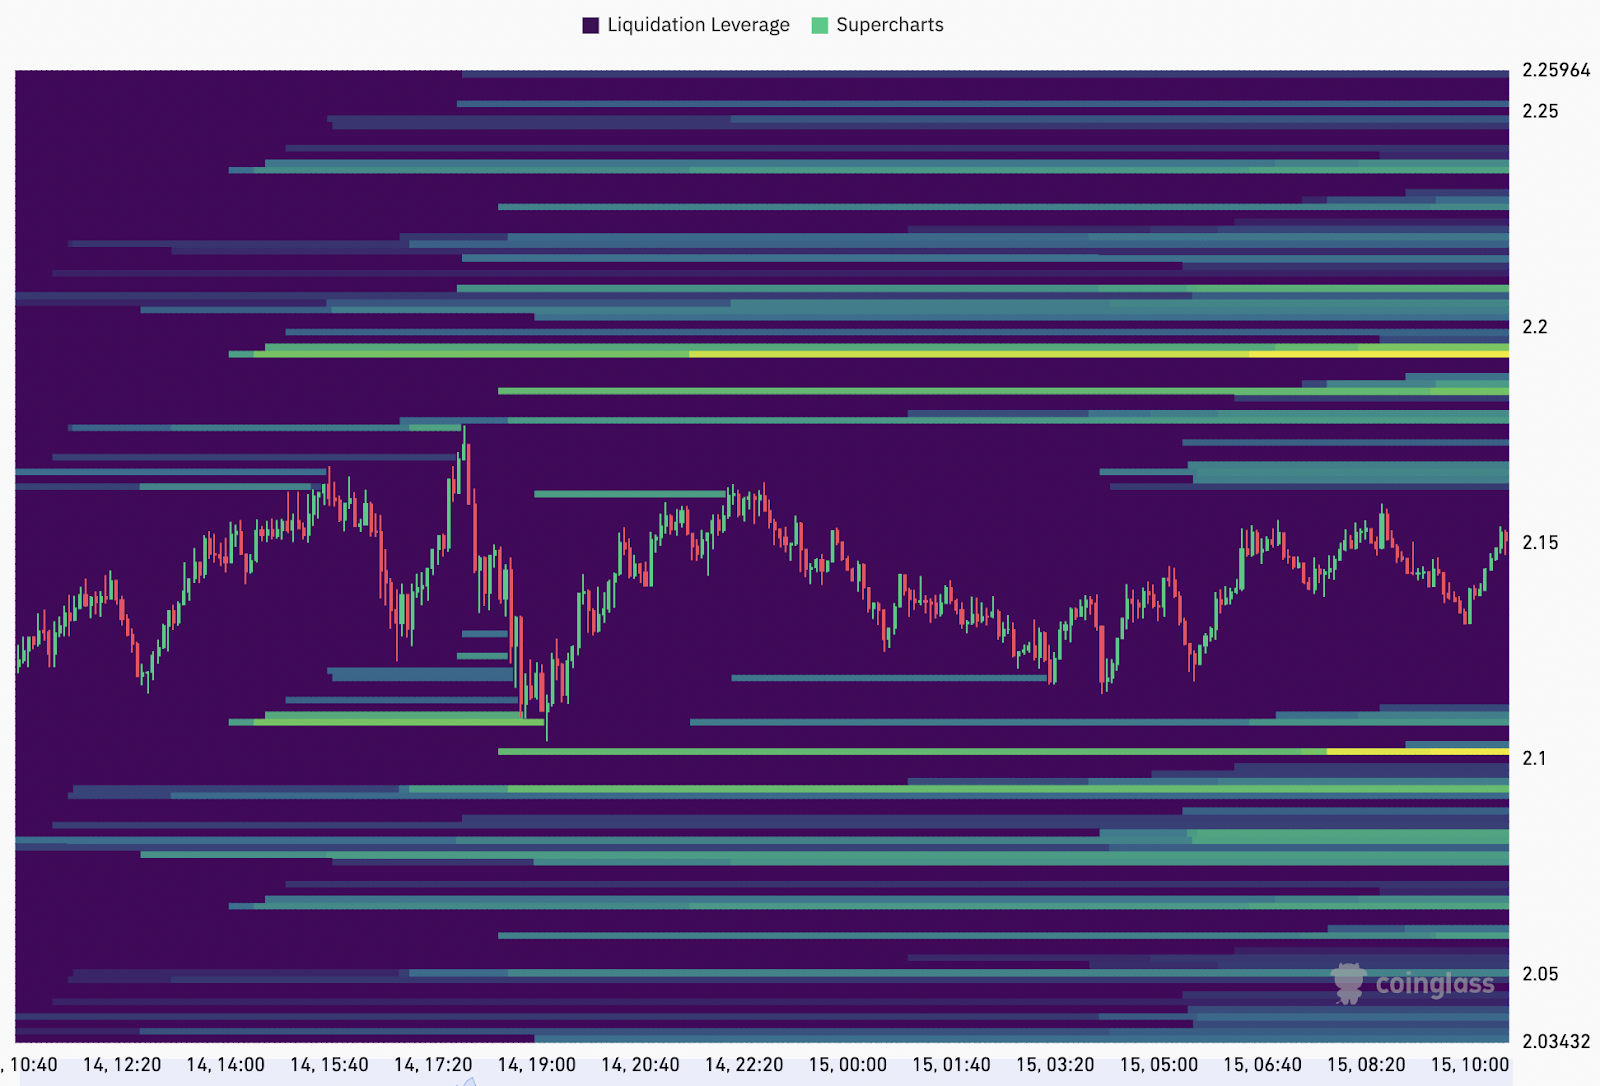
XRP Liquidation Heat Map Source: CoinGlass
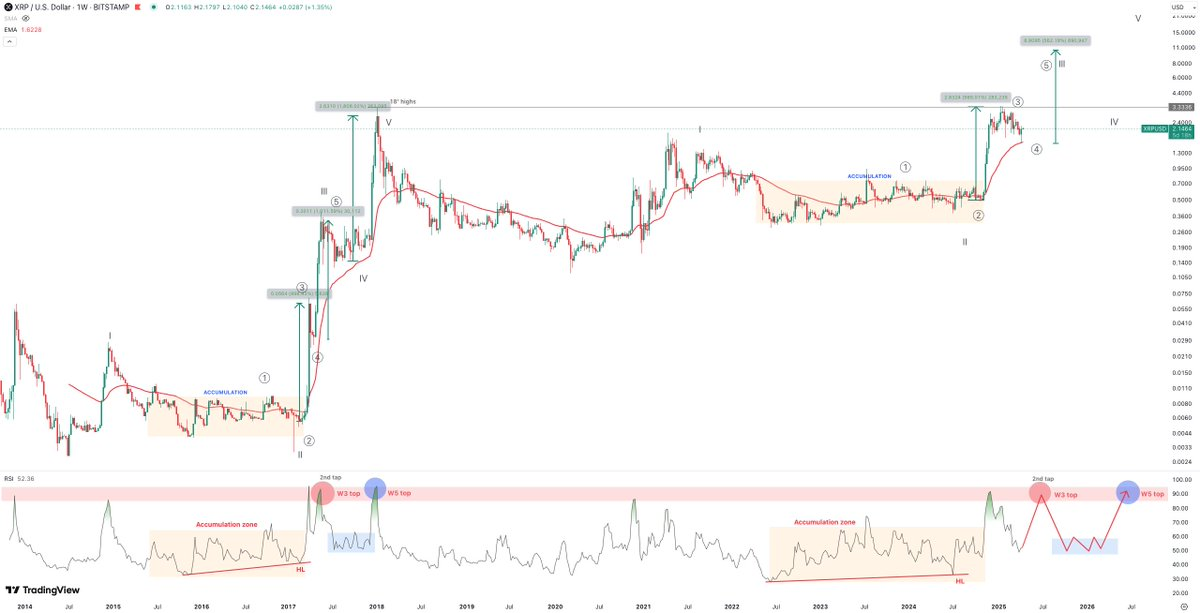
Will XRP price reach $20 by 2025? Following the recent recovery in XRP's price, cryptocurrency analyst Maelius stated that based on Elliott Wave Theory analysis on the weekly chart, this digital asset could reach $10, with an "optimistic" target range between $15 and $20.
"A conservative estimate suggests that XRP has completed the third wave and is currently undergoing the fourth wave process, after which it will enter the final fifth wave." He added that the price movement and RSI indicator exhibit characteristics similar to the 2017 cycle, with the RSI peaking in the resistance zone (red area), indicating an overbought state.
If the current cycle repeats, Maelius predicts that XRP could reach around $10 by the end of the year as the fifth wave target.
"From a conservative perspective, the amplitude of the fifth wave may replicate that of the third wave, thus the target price is $10."
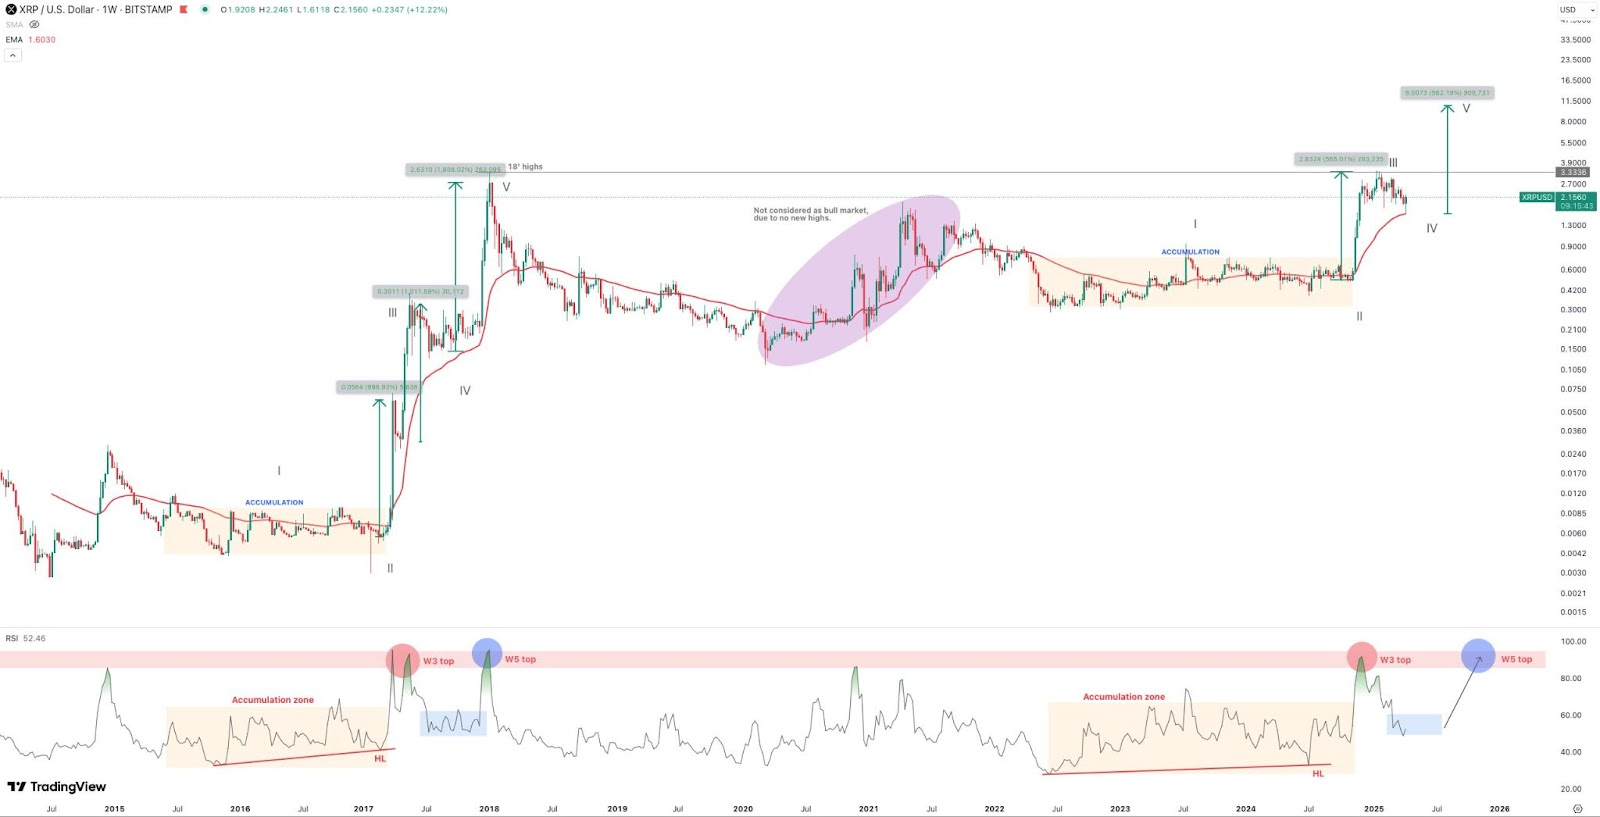
XRP/USD Weekly Chart Source: Maelius
In a deeper analysis, the analyst believes that the peak of the third wave may not have formed yet.
This is because the current accumulation period is more prolonged compared to the 2017 cycle, as evidenced by both price and RSI indicators.
"Therefore, we likely just completed a larger degree third wave within the third wave, which means this cycle is simply taking longer," Maelius explained.
If indeed more time is needed, Maelius expects the RSI to retest resistance to confirm the completion of the third wave. Additionally, the Elliott Wave count will align with previous cycles, with a longer fourth wave adjustment occurring within the third wave.
"In this case, the final fifth wave peak may extend into the first or second quarter of 2026, with target prices potentially exceeding conservative expectations, possibly reaching the $15-$20 range or higher."
XRP/USD Weekly Chart Source: Maelius
Meanwhile, analyst XForceGlobal pointed out that from the perspective of Elliott Wave Theory, XRP is still in a "major bull market" phase, with its price movement distinctly different from other sectors of the cryptocurrency market.
"If we consider all analytical viewpoints, even simple technical analysis suggests that we are likely to create a new historical high."
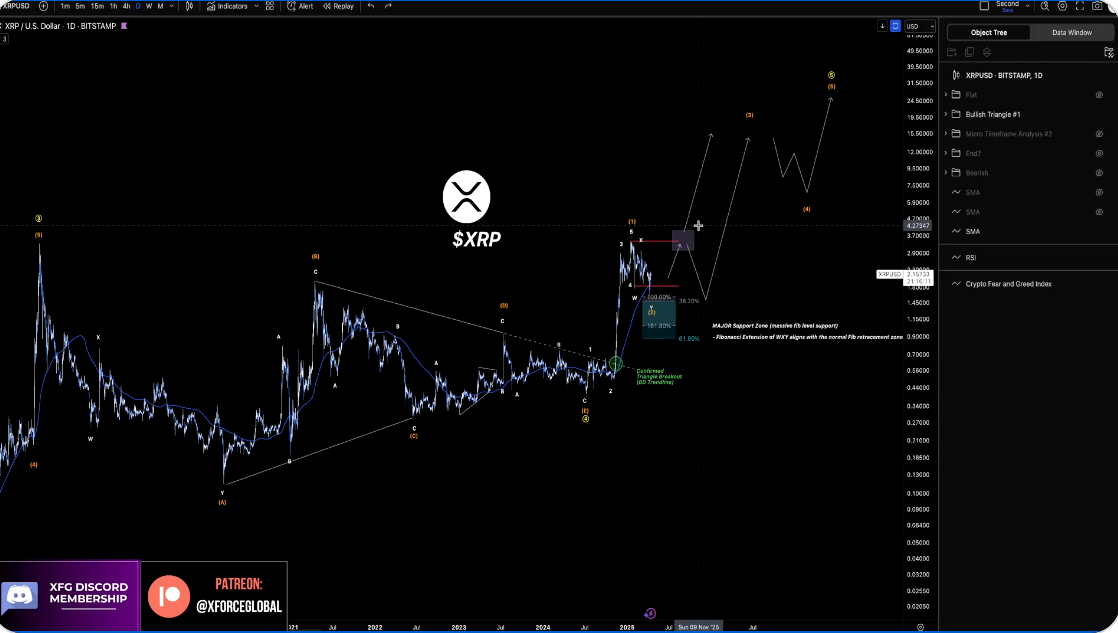
XRP/USD Daily Chart Source: XForceGlobal
According to Cointelegraph, XRP's symmetrical triangle pattern suggests a potential breakout above $3.50 to create a new historical high.
免责声明:本文章仅代表作者个人观点,不代表本平台的立场和观点。本文章仅供信息分享,不构成对任何人的任何投资建议。用户与作者之间的任何争议,与本平台无关。如网页中刊载的文章或图片涉及侵权,请提供相关的权利证明和身份证明发送邮件到support@aicoin.com,本平台相关工作人员将会进行核查。


