Author: Glassnode
Compiled by: Felix, PANews
Key Points
- The macroeconomic environment remains uncertain, and global trade relations are undergoing restructuring. This uncertainty has intensified the volatility of U.S. Treasury bonds and the stock market.
- In a challenging economic backdrop, Bitcoin has recorded its largest drop since this cycle began. Nevertheless, the decline remains within the range of previous bull market corrections. Additionally, the median drop in this cycle is still an order of magnitude lower than in past bull markets, highlighting more resilient demand.
- Liquidity across the entire digital asset ecosystem continues to tighten, reflected in decreased capital inflows and stagnation in stablecoin growth.
- Investors are under significant pressure, currently facing the largest unrealized losses in history. However, these losses are mostly concentrated among new market participants, while long-term holders generally remain profitable.
Macroeconomic Uncertainty Persists
As the Trump administration attempts to disrupt and restructure global trade relations, the uncertainty surrounding the macroeconomic outlook has become increasingly pronounced. Currently, U.S. Treasury bonds serve as collateral and the foundation of the financial system, with the 10-year Treasury bond viewed as the benchmark risk-free rate.
A key goal of the government is to lower the yield on the 10-year Treasury bond, which saw initial success in the early months of this year, as widespread market sell-offs drove yields down to 3.7%. However, this situation was short-lived, and yields subsequently surged to 4.5%, erasing the decline and causing significant volatility in the bond market.
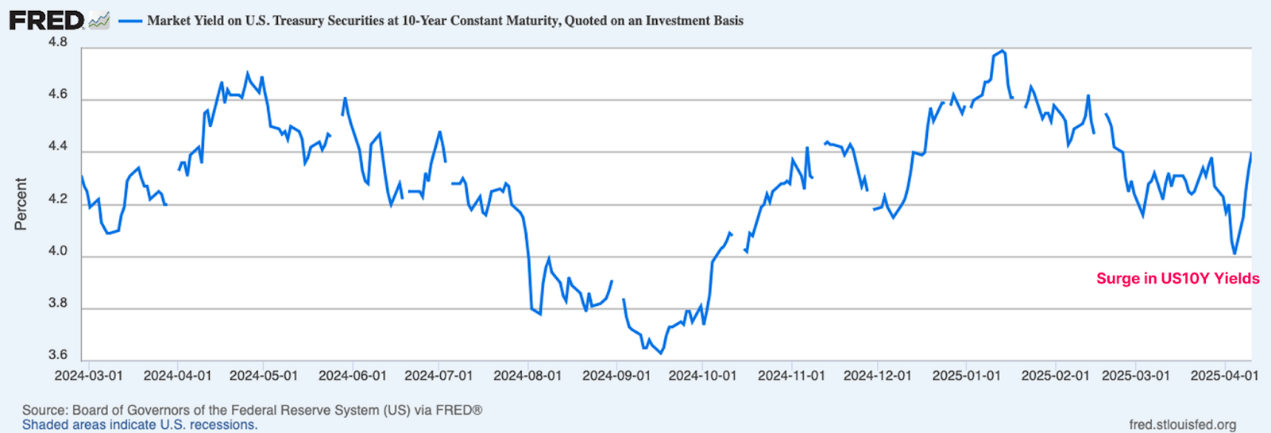
Source: FRED
The MOVE index can quantify the chaotic behavior of the bond market. This indicator is a key measure of bond market stress and volatility, derived from the 30-day implied volatility of U.S. Treasury options across different maturities.
Measured by this indicator, the volatility of U.S. Treasury bonds has surged, highlighting extreme uncertainty and panic among bond market investors.
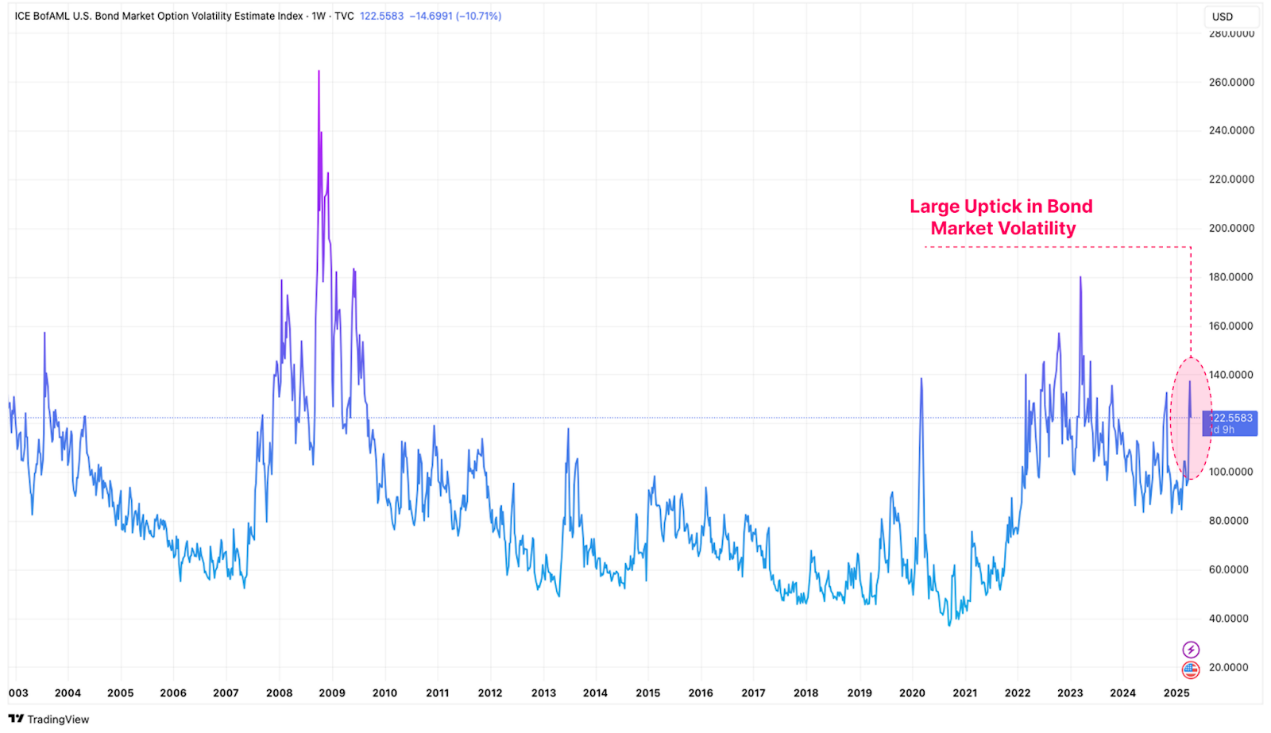
Source: Tradingview
Additionally, the Volatility Index (VIX) can be used to gauge the turbulence in the U.S. stock market, measuring market expectations of 30-day volatility in U.S. equities. The volatility in the bond market is also significantly reflected in the stock market, with the current VIX volatility levels resembling those during the 2020 COVID crisis, the 2008 global financial crisis, and the 2001 internet bubble.
Fluctuations in the foundational collateral of the financial system often lead to capital withdrawals by investors and a tightening of liquidity conditions. Given that Bitcoin and digital assets are among the most liquidity-sensitive instruments, they are naturally affected by volatility and the pullback of risk assets.
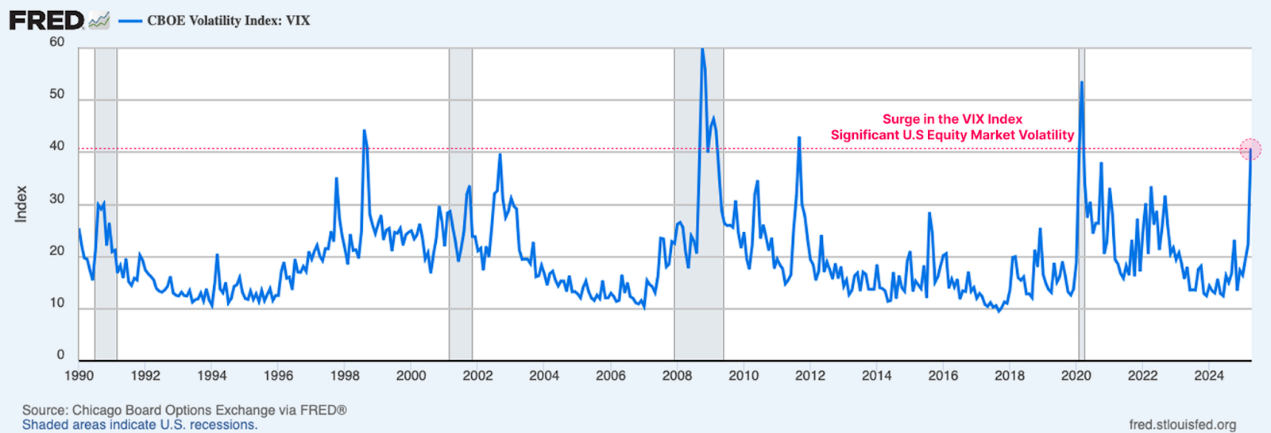
Source: FRED
Amid this turmoil, the performance of "hard" assets remains impressive. As investors flock to gold, a traditional safe-haven asset, gold prices have continued to soar, reaching a new high of $3,300. Bitcoin was initially sold off alongside risk assets to $75,000 but has since recovered some of its losses, trading back up to $85,000.
As the world gradually adapts to changing trade relations, gold and Bitcoin are increasingly becoming the focal point of the market as global neutral reserve assets. It can be said that the performance of gold and Bitcoin last week conveyed a compelling signal.
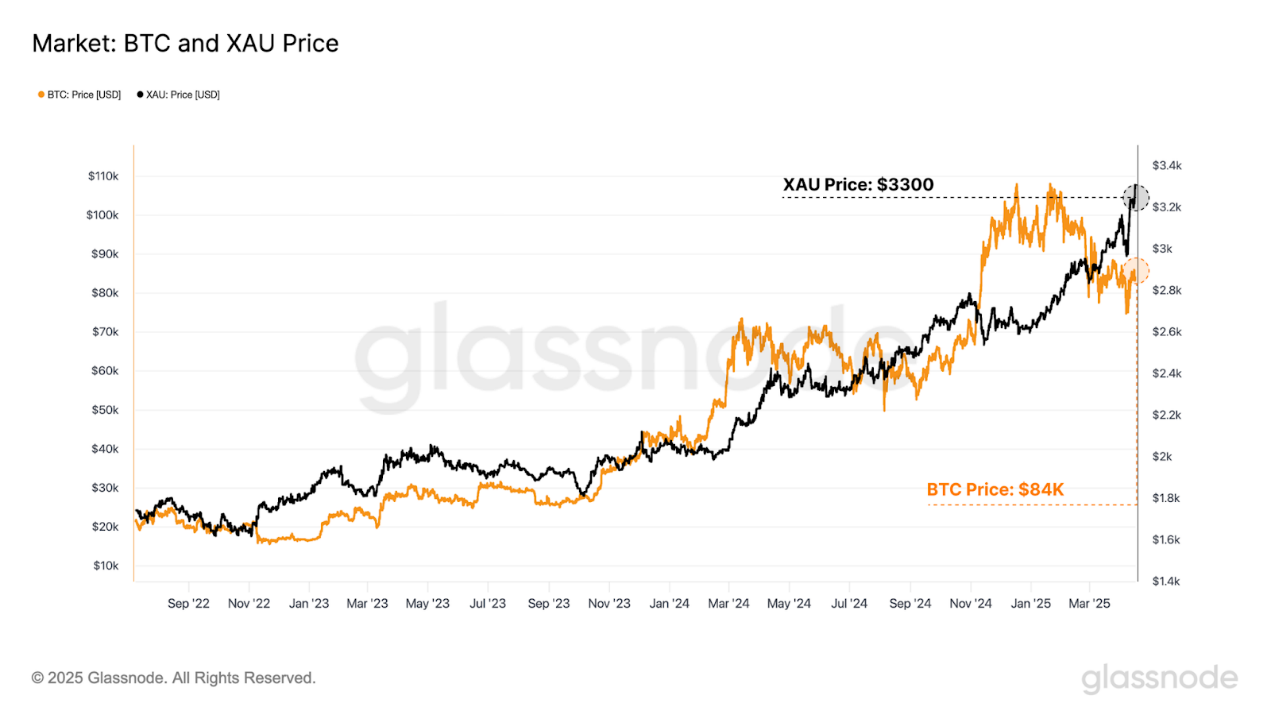
Source: Glassnode
Bitcoin Remains Resilient
Although Bitcoin is still trading in the $85,000 range, its volatility and drawdown have intensified in recent months. The asset has recorded its largest drop since the 2023-25 cycle, with a maximum decline of 33% from its all-time high.
However, the magnitude of this pullback remains within the range of previous bull market corrections. In macroeconomic events like last week, Bitcoin typically experiences declines exceeding 50%, underscoring the relatively robust sentiment of modern investors towards Bitcoin in adverse environments.
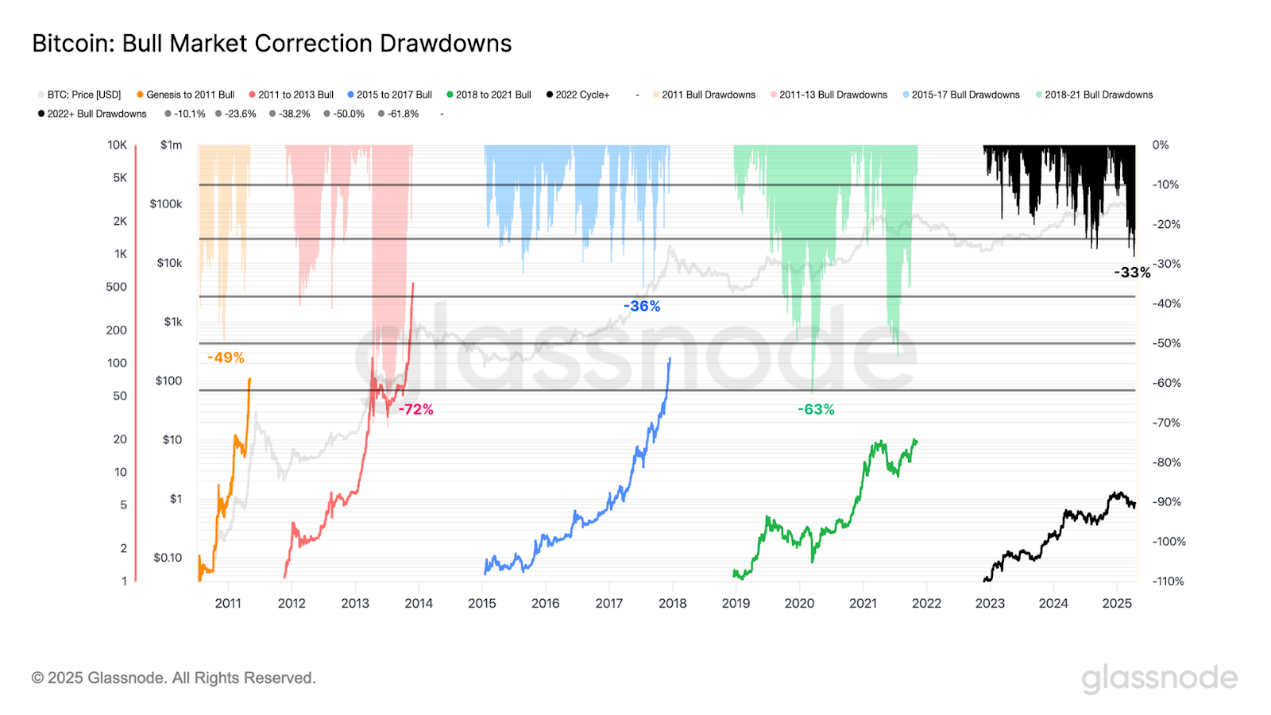
Source: Glassnode
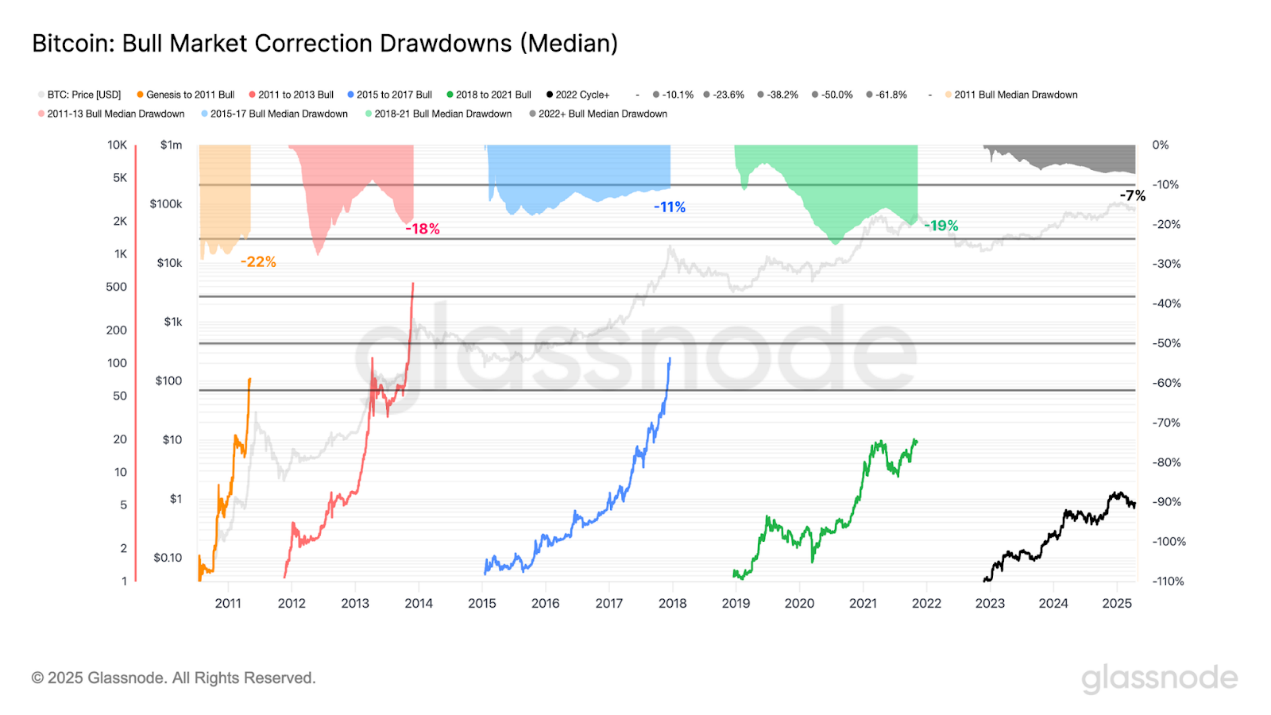
To quantify the resilience of the current cycle, one can assess the median drawdowns of previous bull markets.
- 2011: -22%
- 2011-2013: -18%
- 2015-2018: -11%
- 2018-2021: -19%
- 2022 and beyond: -7%
The median drawdown of the current cycle is smaller than in all previous cases. Since 2023, the drawdown has been smaller and essentially more controllable, indicating a more resilient demand situation, with many investors more willing to hold during market turbulence.
Source: Glassnode
Liquidity Continues to Shrink
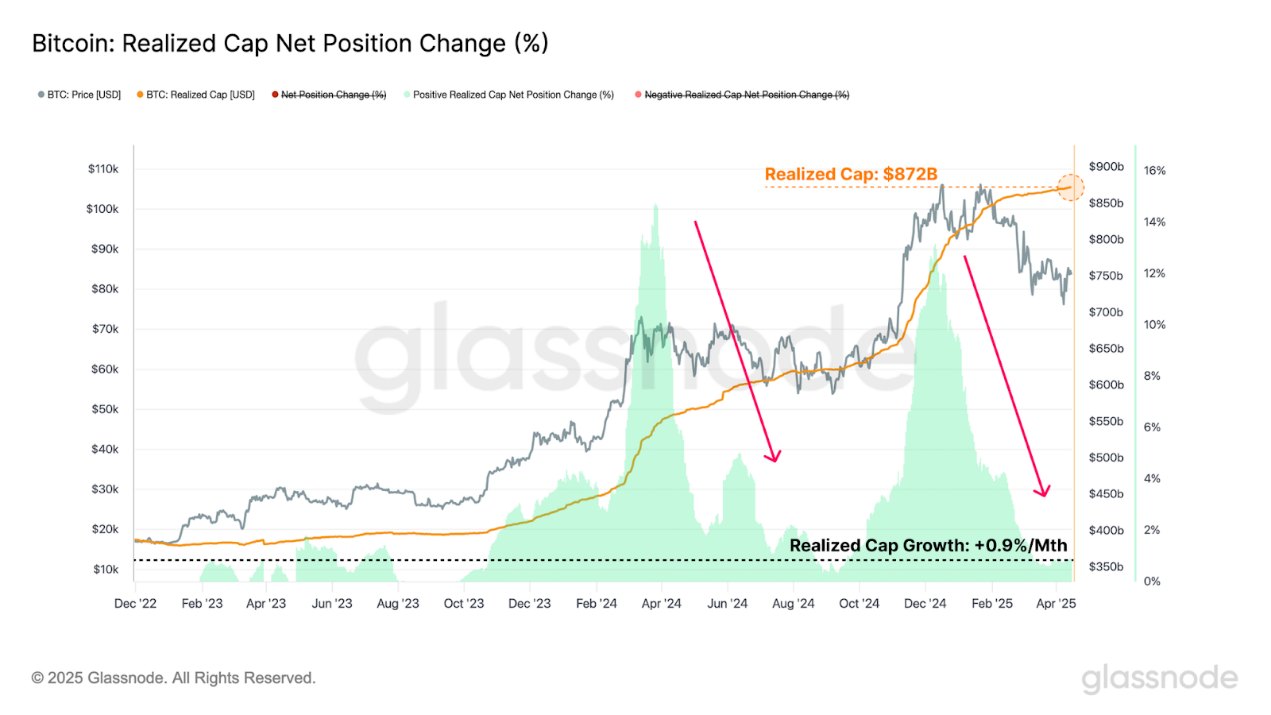
Furthermore, one can assess how macroeconomic uncertainty affects Bitcoin's liquidity situation.
One way to measure internal liquidity in Bitcoin is through the realized market cap metric, which calculates the cumulative net inflow of capital into the digital asset. The realized market cap currently stands at a historical high of $872 billion; however, the capital growth rate has contracted to just +0.9% per month.
In a highly challenging market backdrop, capital inflows into the asset remain positive. Given that the pace of new capital inflows into the asset is slowing, it indicates that investors are less willing to allocate capital in the short term, and risk aversion may still be the prevailing sentiment.
Source: Glassnode
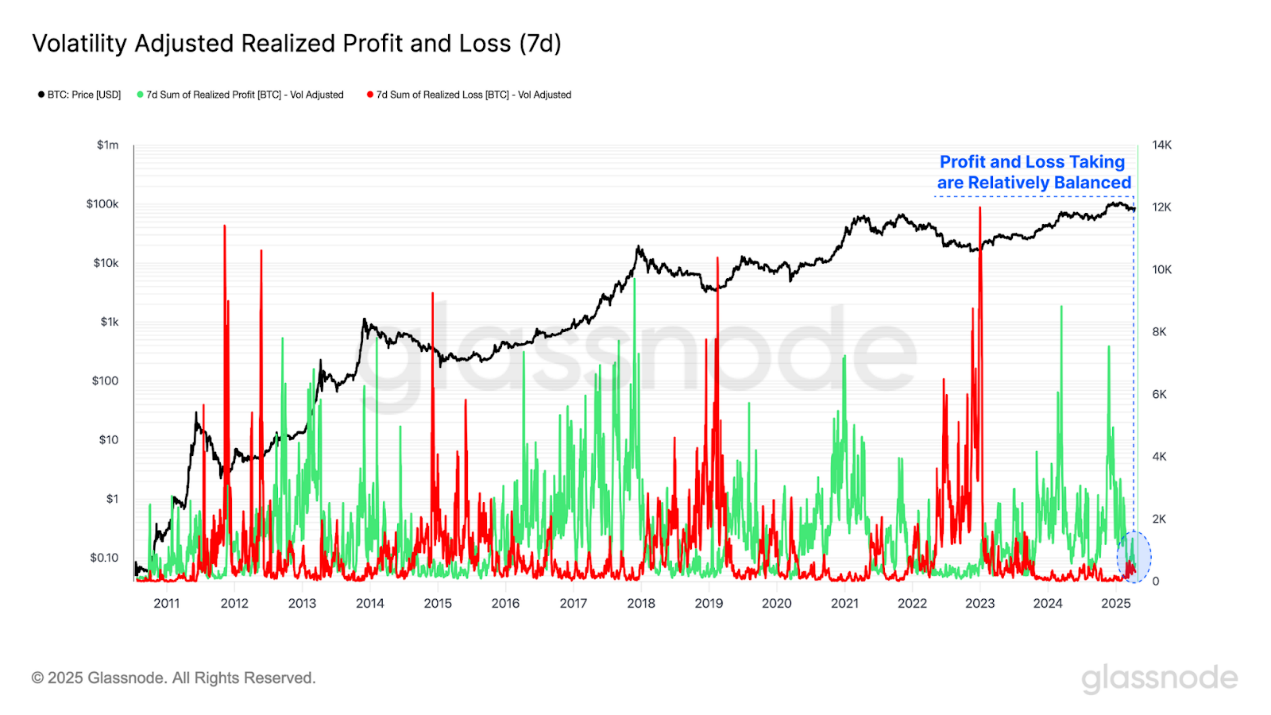
The realized profit and loss metric, as a component of the realized market cap, measures the price difference between the tokens' purchase price and their selling price on-chain.
- Tokens that are sold above their purchase price are considered to have locked in realized profits.
- Tokens sold below their purchase price are viewed as having locked in realized losses.
Measuring realized profit and loss in Bitcoin allows for the standardization of all profit and loss events. Additionally, by adjusting for volatility (7-day realized volatility), it further refines the analysis, helping to explain the diminishing returns and growth rates of Bitcoin over its 16-year history.
Currently, profit and loss activities are relatively balanced, with a neutral capital inflow rate, reflecting the saturation of investor activity within the current price range.
Source: Glassnode
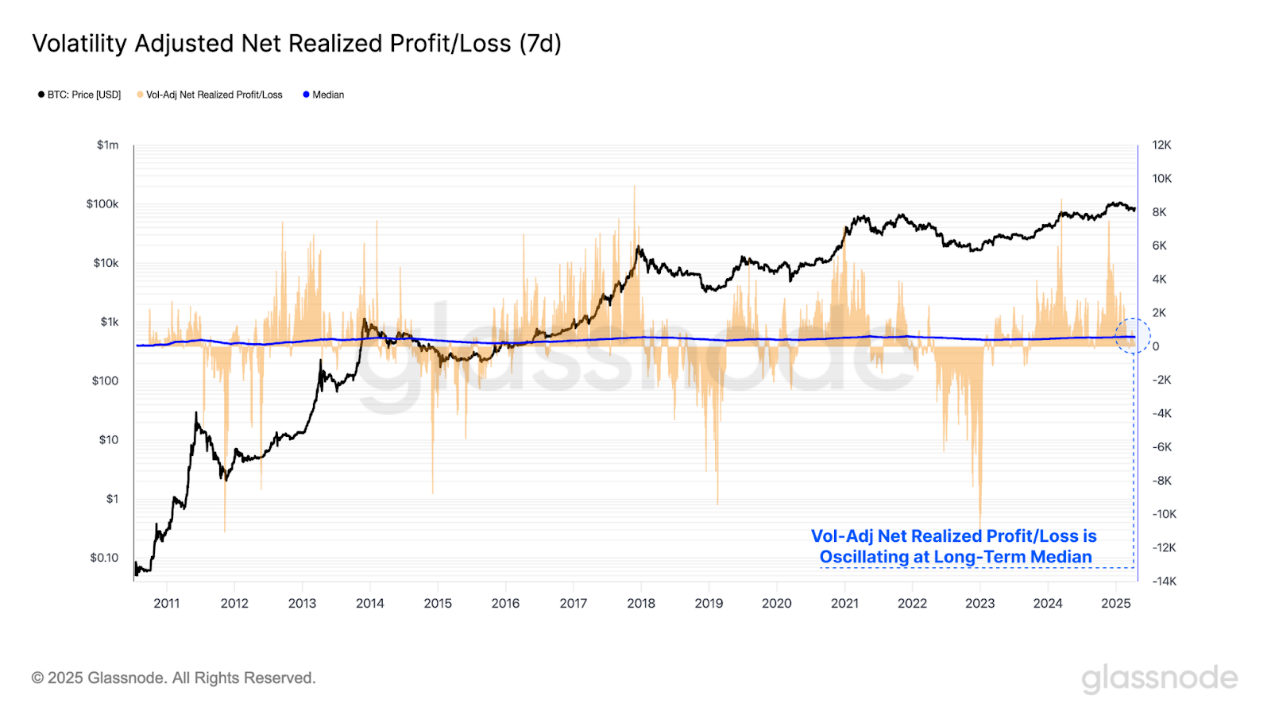
By calculating the difference between realized profits and losses, one can derive the realized net profit and loss metric. This metric measures the dominant direction of value inflows/outflows in the network.
Using the volatility-adjusted net realized profit and loss metric, it can be compared to the cumulative median to distinguish between two market patterns.
- Prices consistently above the median typically indicate a bull market and net capital inflows.
- Prices consistently below the cumulative median are usually seen as a bear market, where Bitcoin experiences net capital outflows.
Markets often push investors to the brink of maximum pain, typically peaking at turning points in bull and bear cycles. It can be observed how the volatility-adjusted net realized profit and loss fluctuates around its long-term median, serving as a mean-reversion tool.
This metric has now returned to the neutral median, indicating that the Bitcoin market is currently at a critical decision point, delineating boundaries for bulls to re-establish support in the current price range.
Source: Glassnode
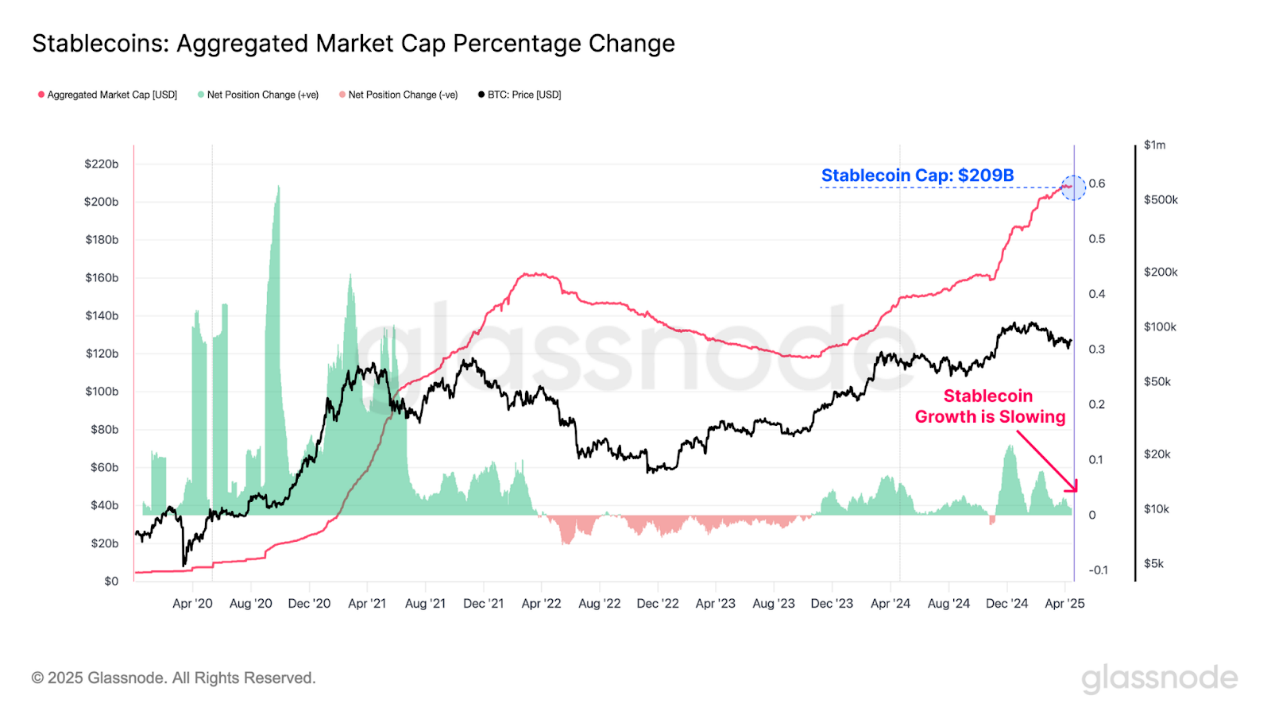
Stablecoins have become a foundational asset class in the digital asset ecosystem, serving as quote assets in both DEX and CEX. Evaluating liquidity through the lens of stablecoins provides a new dimension for analysis, helping to gain a more comprehensive understanding of the liquidity situation in digital assets.
The supply of stablecoins continues to grow positively, but has slowed in recent weeks. This further corroborates that broader digital asset liquidity is shrinking, as evidenced by the weakening demand for digital dollars.
Source: Glassnode
Examining Investor Pressure
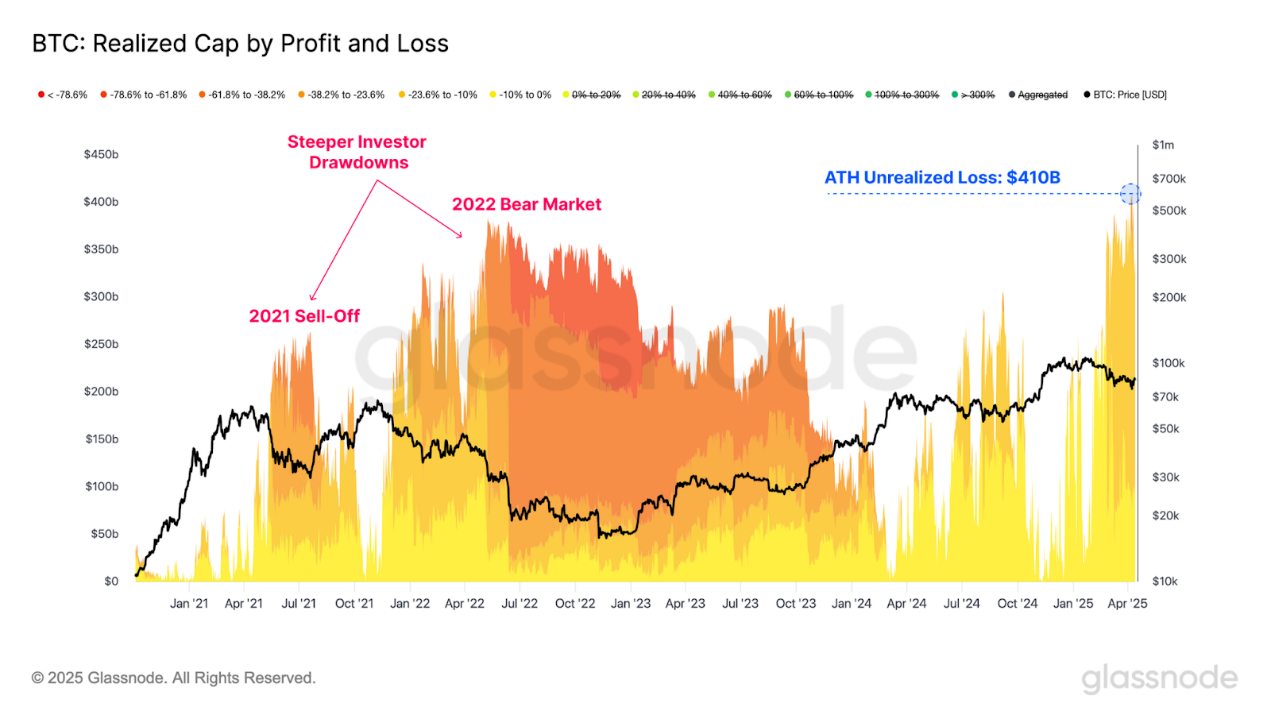
In the ongoing market turmoil, it is crucial to assess the scale of unrealized losses currently held by Bitcoin investors.
When measuring the unrealized losses held in the market, it is noted that during the market drop to $75,000, unrealized losses reached a new high of $410 billion. When looking at the composition of unrealized losses, it can be seen that most investors are holding drawdowns of up to -23.6%.
Compared to the sell-off in May 2021 and the bear market in 2022, the total scale of unrealized losses is larger. However, for individual investors, the market has experienced more severe drawdowns, reaching -61.8% and -78.6%, respectively.
While the total unrealized losses are larger (considering Bitcoin is now a more valuable asset), individual investors face smaller challenges compared to previous bear markets.
Source: Glassnode
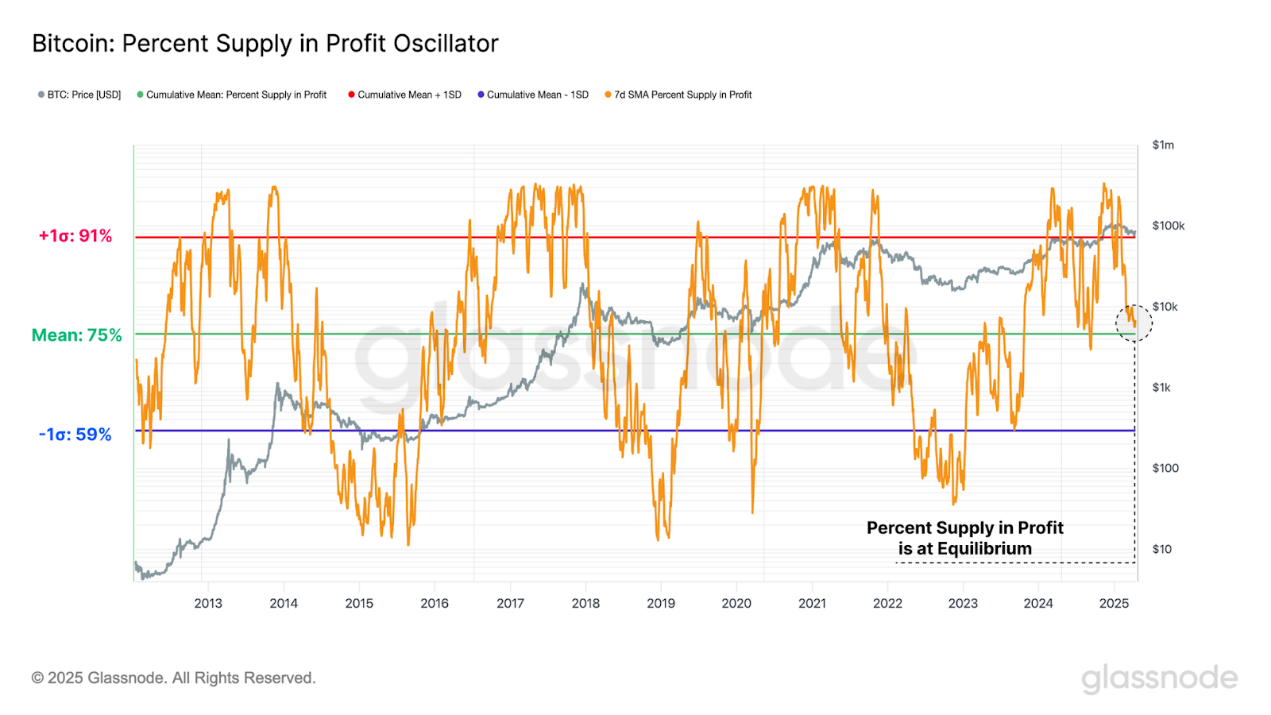
Despite unrealized losses reaching historical highs, the proportion of profitable positions in circulation remains as high as 75%. This indicates that most loss-making investors only bought in after the top formation appeared.
Notably, the percentage of profitable supply is approaching its long-term average. Historically, this is a key area that needs to be defended before the vast majority of cryptocurrencies fall into losses, and it serves as a critical threshold between bull and bear markets.
- A typical characteristic of a bull market is that profitable supply is above its long-term average, usually finding support throughout the bull market.
- Historically, bear markets have occasionally experienced prolonged periods significantly below the long-term average, and frequent pullbacks during bear markets confirm the decline in profitability.
Similar to the net realized profit and loss metric, if this can be maintained, it will help rebound from the long-term average range.
Source: Glassnode
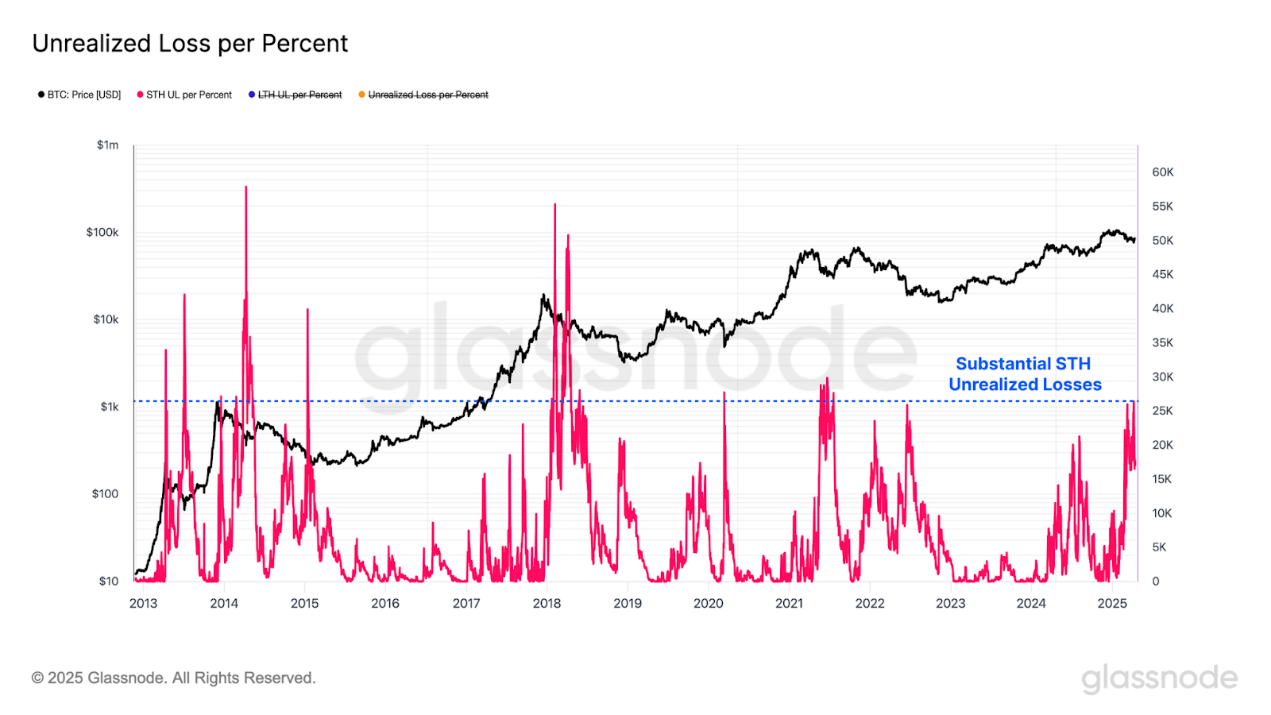
As the market continues to shrink, the absolute scale of unrealized losses is expected to grow. To explain this phenomenon and standardize different magnitudes of drawdowns, a new metric is introduced: unrealized losses per percentage drawdown, which indicates the percentage decline in losses relative to the historical peak in Bitcoin.
Applying this metric to the short-term holder group reveals that, after adjusting for drawdown depth, their unrealized losses have become quite substantial, comparable to levels seen in the early stages of previous bear markets.
Source: Glassnode
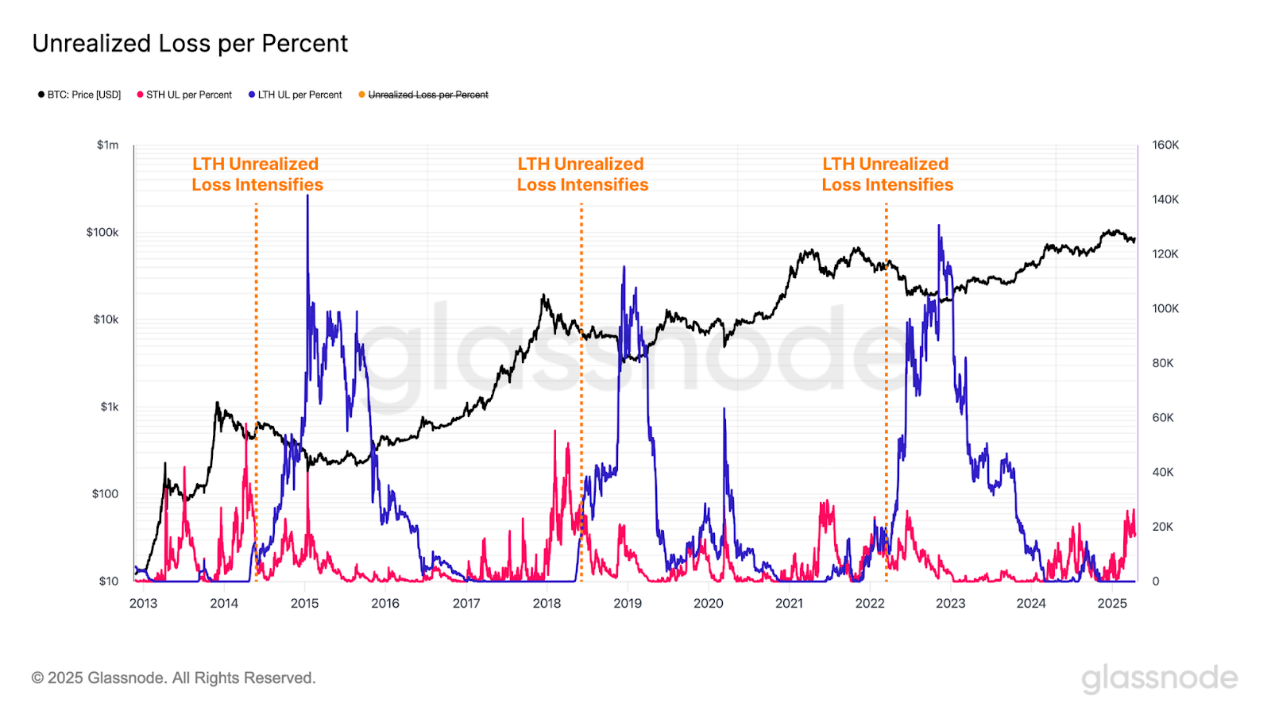
Nevertheless, the current unrealized losses are primarily concentrated among new investors, while long-term holders remain in a state of unilateral profitability. However, an important nuance is emerging: as recent top buyers gradually become long-term holders, the level of unrealized losses in this group may rise.
Historically, a significant expansion of unrealized losses among long-term holders typically marks the confirmation of a bear market, although there may be a delay after the market peaks. So far, there is no clear evidence that this pattern shift is underway.
Source: Glassnode
Summary and Conclusion
The macroeconomic outlook remains uncertain, and the ongoing changes in global trade dynamics have intensified significant volatility in U.S. Treasury bonds and the stock market. Notably, during this challenging period, the performance of Bitcoin and gold has been particularly strong. This may be an encouraging signal indicating that the foundations of the financial system are entering a period of transformation and reform.
Despite Bitcoin's notable resilience, it has not escaped the impact of increased global market volatility, recording its largest drop since the 2023-2025 cycle. This has greatly affected new market participants, who now bear the majority of market losses. However, from the perspective of individual investors, the market has experienced more severe declines in previous cycles, especially during the bear markets of May 2021 and 2022. Additionally, mature and long-term investors remain largely unaffected by ongoing economic pressures, almost in a state of unilateral profitability.
Related Reading: Fidelity: Has Bitcoin Reached Its Peak in This Cycle?
免责声明:本文章仅代表作者个人观点,不代表本平台的立场和观点。本文章仅供信息分享,不构成对任何人的任何投资建议。用户与作者之间的任何争议,与本平台无关。如网页中刊载的文章或图片涉及侵权,请提供相关的权利证明和身份证明发送邮件到support@aicoin.com,本平台相关工作人员将会进行核查。


