Crypto has become one of the most dynamic and promising sectors in the fintech field. With the influx of institutional funds, how to reasonably value Crypto projects has become a key issue. Traditional financial assets have mature valuation systems, such as the Discounted Cash Flow (DCF) model and the Price-to-Earnings (P/E) ratio.
Crypto projects are diverse, including public chains, CEX platform tokens, DeFi projects, meme coins, etc., each with different characteristics, economic models, and token functions. It is necessary to explore valuation models suitable for each track.
1. Public Chains — Metcalfe's Law
Law Analysis
The core content of Metcalfe's Law: the value of a network is proportional to the square of the number of nodes.
V = K*N² (where: V is the network value, N is the number of active nodes, K is a constant)
Metcalfe's Law is widely recognized in the valuation predictions of internet companies. For example, in the paper "An Independent Study on the Value of Facebook and Tencent, China's Largest Social Network Company (Zhang et al., 2015)," the value of these companies over a 10-year statistical period showed characteristics of Metcalfe's Law in relation to user numbers.
ETH Example
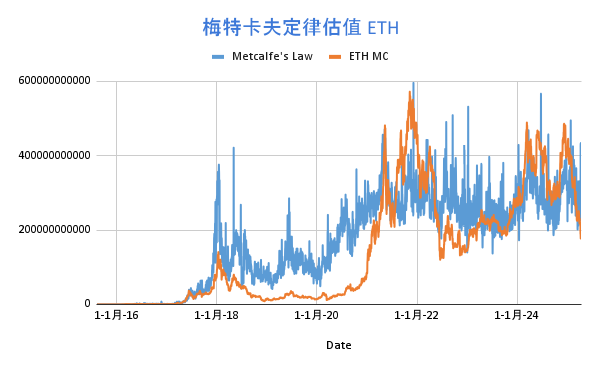
Metcalfe's Law also applies to the valuation of blockchain public chain projects. Western scholars have found that the market value of Ethereum has a logarithmic linear relationship with daily active users, which fits the formula of Metcalfe's Law. However, the market value of the Ethereum network is proportional to users at N^(1.43), with a constant K value of 3000. The calculation formula is as follows:
V = 3000 * N^1.43
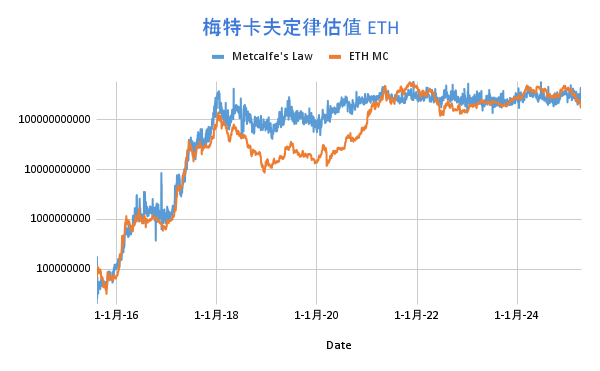
Statistics show that the valuation method based on Metcalfe's Law does have some correlation with the market value trend of ETH:
Logarithmic form trend chart:
Limitations Analysis
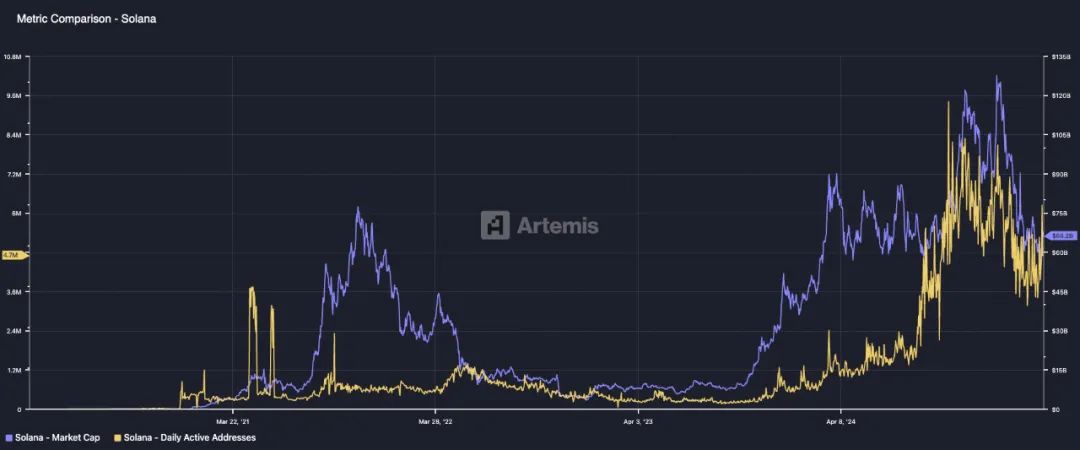
Metcalfe's Law has limitations when applied to emerging public chains. In the early stages of public chain development, the user base is relatively small, making it less suitable for valuation based on Metcalfe's Law, such as early Solana, Tron, etc.
Additionally, Metcalfe's Law cannot reflect the impact of staking rates on token prices, the long-term effects of the EIP1559 mechanism on gas fee burns, and the potential game theory of public chain ecosystems based on Security Ratio against TVS (Total Value Secured).
2. CEX Platform Tokens — Profit Buyback & Burn Model
Model Analysis
Centralized exchange platform tokens are similar to equity tokens, related to exchange revenue (trading fee income, listing fees, other financial services, etc.), the development of public chain ecosystems, and the market share of the exchange. Platform tokens generally have buyback and burn mechanisms and may also incorporate gas fee burn mechanisms from public chains.
The valuation of platform tokens needs to consider the overall revenue situation of the platform, discount future cash flows to estimate the intrinsic value of the platform token, and also consider the burn mechanism of the platform token, measuring changes in its scarcity. Therefore, the rise and fall of platform tokens are generally related to the growth rate of trading volume on the trading platform and the reduction rate of platform token supply. A simplified profit buyback & burn model valuation calculation method is:
Platform Token Value Growth Rate = K * Trading Volume Growth Rate * Supply Burn Rate (where K is a constant)
BNB Example
BNB is the most classic exchange platform token. Since its inception in 2017, it has received widespread acclaim from investors. The empowerment of BNB has gone through two stages:
Stage One: Profit Buyback — From 2017 to 2020, Binance used 20% of its profits each quarter to buy back and burn BNB;
Stage Two: Auto-Burn + BEP95 — Starting in 2021, the Auto-Burn mechanism was implemented, no longer referencing Binance's profits, but calculating the burn amount based on the price of BNB and the quarterly block count of BNB Chain; additionally, there is a BEP95 real-time burn mechanism (similar to Ethereum's EIP1559). 10% of each block reward will be burned, and as of now, a total of 2,599,141 BNB has been burned through the BEP95 mechanism.
The Auto-Burn mechanism calculates the burn amount using the following formula:
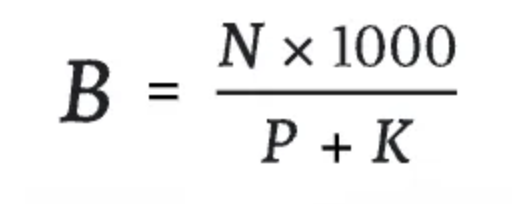
Where N is the quarterly block output of BNB Chain, P is the quarterly average price of BNB, and K is a constant (initial value is 1000, adjusted through BEP).
Assuming a 40% growth rate in Binance trading volume in 2024 and a 3.5% supply burn rate for BNB, taking K as 10, then:
BNB Value Growth Rate = 10 * 40% * 3.5% = 14%
This means that, based on this data, BNB should increase by 14% in 2024 compared to 2023.
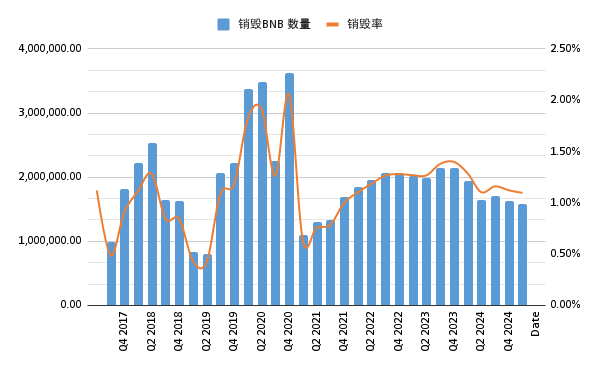
Since 2017, a total of over 59.52 million BNB has been burned, averaging a 1.12% reduction in the remaining BNB supply each quarter.
Limitations Analysis
When applying this valuation method in practice, it is essential to closely monitor changes in the exchange's market share. For example, if a particular exchange's market share continues to decline, even if its current profit performance is acceptable, future profit expectations may be affected, thereby reducing the valuation of the platform token.
Changes in regulatory policies also significantly impact the valuation of CEX platform tokens, as policy uncertainties may alter market expectations for platform tokens.
3. DeFi Projects — Token Cash Flow Discount Valuation Method
The core logic of the Discounted Cash Flow (DCF) valuation method for DeFi projects is to predict the future cash flows that the token can generate and discount them to present value at a certain discount rate.
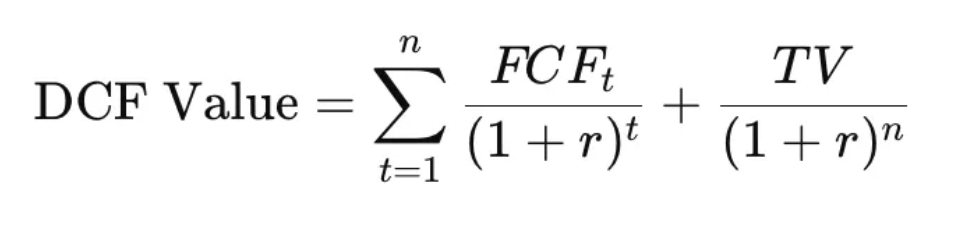
Where FCFt is the free cash flow in year t, r is the discount rate, n is the forecast period, and TV is the Terminal Value.
This valuation method determines the current value of the token based on expectations of future earnings from the DeFi protocol.
Taking RAY as an Example
In 2024, Raydium's revenue is projected to be 98.9 million. Assuming an annual growth rate of 10%, a discount rate of 15%, a forecast period of 5 years, and a perpetual growth rate of 3%, with an FCF conversion rate of 90%.
Future five-year cash flows:
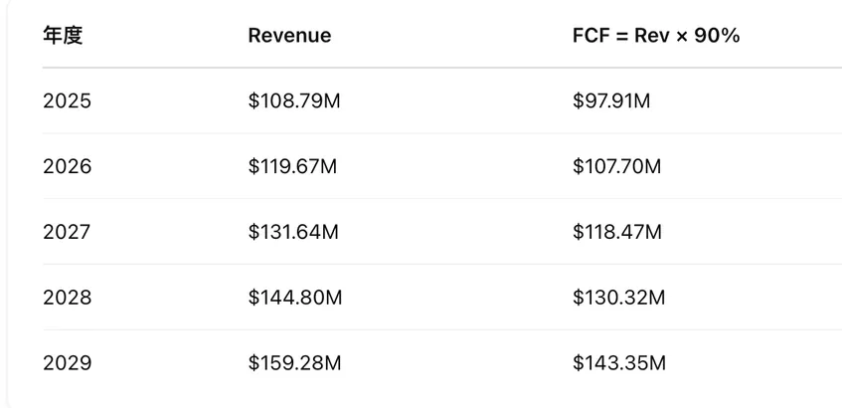
Total discounted FCF for the next five years: 390.3 million
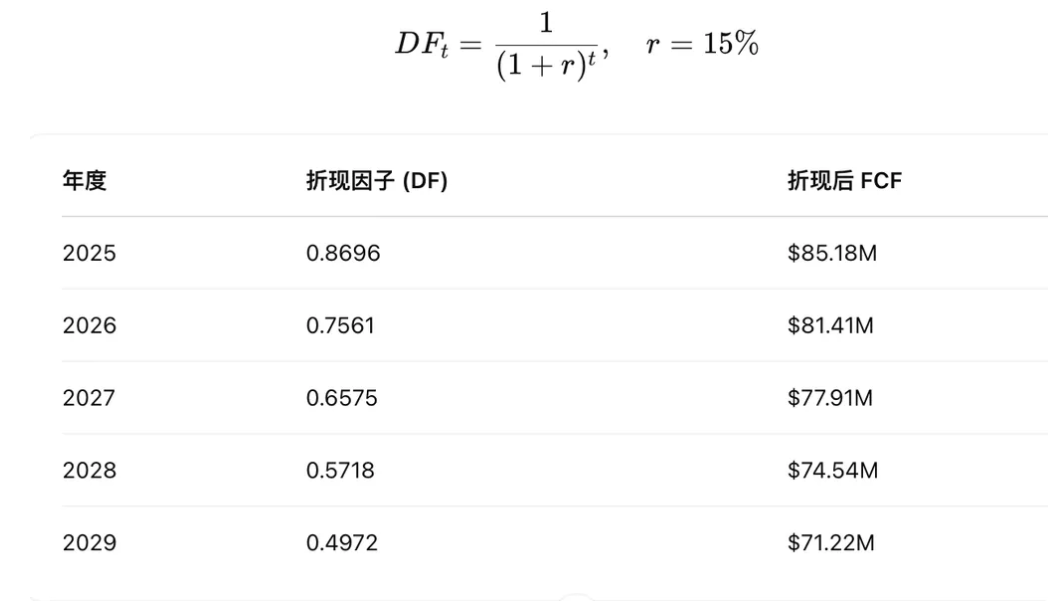
Terminal Value discounted to 611.6 million
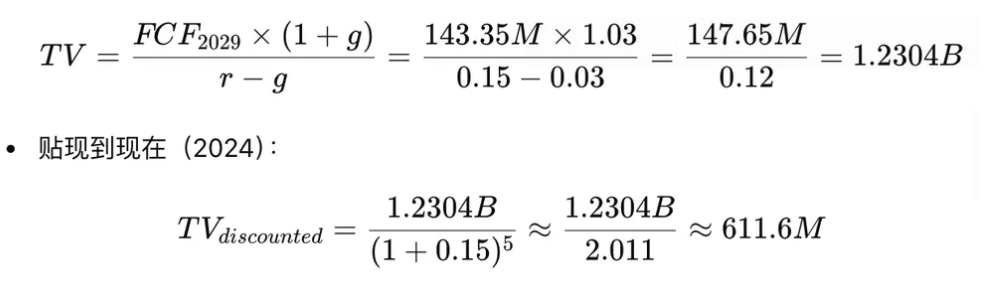
Total DCF Valuation = TV + FCF = 611.6 million + 390.3 million = 1.002 billion
RAY's current market value is 1.16 billion, which is overall close. Of course, this valuation is based on a 10% annual growth rate over the next five years. In reality, during a bear market, Raydium is likely to experience negative growth, while in a bull market, the growth rate may exceed 10%.
Limitations Analysis
Valuing DeFi protocols faces several challenges: first, governance tokens generally do not capture the revenue value of the protocol, and to avoid being classified as securities by the SEC, they cannot directly distribute dividends. Although there are ways to circumvent this (staking rewards, buyback and burn, etc.), DeFi protocols lack sufficient motivation to feed profits back into the token; second, predicting future cash flows is extremely difficult due to rapid market fluctuations, with significant cash flow volatility in DeFi protocols and changing competitor and user behaviors; third, determining the discount rate is complex, requiring consideration of various factors such as market risk and project risk, and different choices of discount rates can have a huge impact on valuation results; fourth, some DeFi projects employ profit buyback and burn mechanisms, which can affect the circulation and value of the tokens, making such tokens potentially unsuitable for cash flow discount valuation methods.
4. Bitcoin — Comprehensive Consideration of Multiple Valuation Methods
Mining Cost Valuation Method
Statistics show that over the past five years, the time Bitcoin's price has been below the mining cost of mainstream mining machines accounts for only about 10%. This underscores the significant role of mining costs in supporting Bitcoin's price.
Therefore, the mining cost of Bitcoin can be seen as the lower limit of Bitcoin's price. Bitcoin's price has only been below the mining cost of mainstream mining machines for a few instances, and historically, these times have been excellent investment opportunities.
Gold Substitute Model
Bitcoin is often regarded as "digital gold," capable of replacing part of gold's "store of value" function. Currently, Bitcoin's market value accounts for 7.3% of gold's market value. If this proportion increases to 10%, 15%, 33%, and 100%, the price of Bitcoin would reach $92,523, $138,784, $305,325, and $925,226, respectively. This model is based on the analogy of their value storage properties, providing a macro reference perspective for Bitcoin's valuation.
However, there are still many differences between Bitcoin and gold in terms of physical properties, market perception, and application scenarios. Gold has become a globally recognized safe-haven asset over thousands of years, with extensive industrial uses and physical backing; whereas Bitcoin is a virtual asset based on blockchain technology, with its value primarily derived from market consensus and technological innovation. Therefore, when applying this model, it is essential to fully consider how these differences impact Bitcoin's actual value.
Summary
This article aims to advocate for finding valuation models for Crypto projects to promote the robust development of valuable projects within the industry while attracting more institutional investors to allocate crypto assets.
Especially in a bear market, as the tide recedes, we must use the strictest standards and the simplest logic to identify those projects with long-term value. Through reasonable valuation models, we can uncover the "Google" and "Apple" of the Crypto space during a bear market, just as we did in 2000 when we seized the opportunity of the "dot-com bubble burst."
免责声明:本文章仅代表作者个人观点,不代表本平台的立场和观点。本文章仅供信息分享,不构成对任何人的任何投资建议。用户与作者之间的任何争议,与本平台无关。如网页中刊载的文章或图片涉及侵权,请提供相关的权利证明和身份证明发送邮件到support@aicoin.com,本平台相关工作人员将会进行核查。


