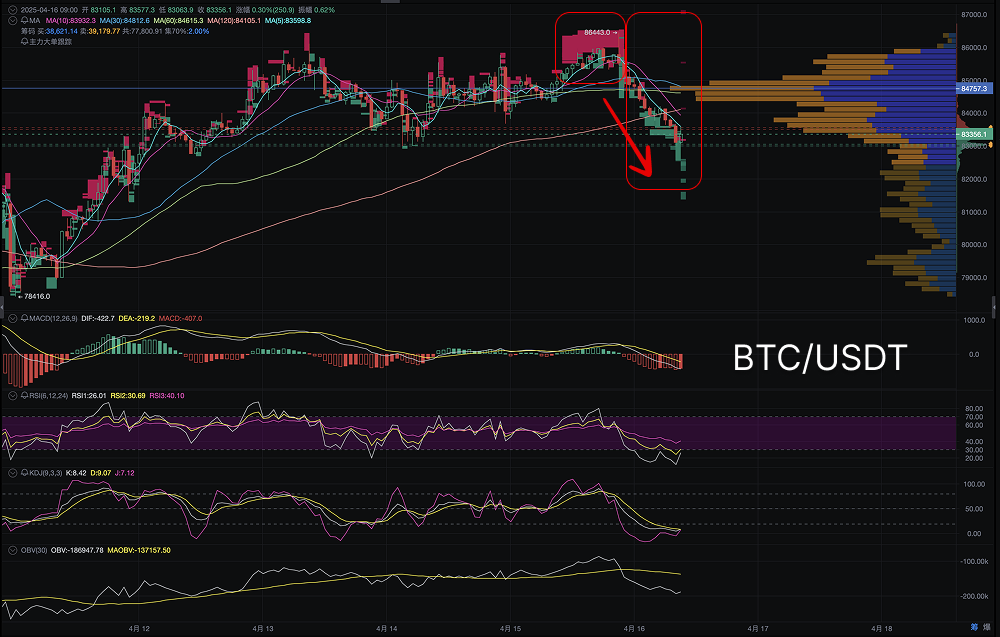
On April 16, the price of Bitcoin experienced some fluctuations, currently hovering around $83,600. Following earlier price oscillations, the Bitcoin market is showing characteristics of a short-term correction, especially in the past 24 hours, where the price briefly broke through $86,000 before quickly retreating. At this moment, the market is facing a relatively complex environment, influenced by both technical indicators and macroeconomic factors.

Candlestick Pattern: Short-term Correction After Consolidation
The current candlestick pattern of Bitcoin exhibits a typical "consolidation" feature. Between April 13 and April 15, Bitcoin reached a high of $86,000 but failed to break through effectively, forming a "false breakout" price pattern. The price faced significant selling pressure as it approached this resistance level, subsequently correcting to around $83,600.
The current price range is oscillating between $83,000 and $84,000, indicating a heavy wait-and-see sentiment in the market, with investors yet to form a clear consensus on future trends. Although the price has not yet fallen below the strong support level of $80,000 in the short term, the current consolidation pattern suggests that the market needs time to digest the previous upward movement.
Large Fund Movements: Capital Inflows and Market Sentiment
Through on-chain data and capital flow analysis, we found that when the Bitcoin price approached $86,000, a significant amount of capital flowed into exchanges, indicating that some large investors may have partially sold off at high levels. Particularly during the decline on the evening of April 15, several large fund accounts transferred Bitcoin, leading to a brief market price drop.
These capital movements reflect a divergence in market sentiment regarding the current price, with some investors choosing to take profits at relatively high price levels, while others are waiting for lower prices to enter.
Technical Indicators: Bearish Signals and Short-term Correction Risks
- MACD: The current DIF line has crossed below the DEA line, and the MACD histogram shows negative growth, suggesting that the market may enter a short-term downward cycle. The MACD death cross signal indicates that there may be more correction pressure in the short term, especially if the price fails to break through the $84,000 resistance level again.
- RSI: The RSI is currently at 33.05, close to the oversold area, but still has some adjustment space. This low RSI indicates relatively high selling pressure in the market, and the price may continue to correct in the short term.
- KDJ: The K and D values have crossed, and the J value is in a downward trend, indicating that the market may continue to face downward pressure in the short term. If the KDJ indicator further deteriorates, it may exacerbate the market's correction pressure.
Volume Profile Visible Range (VPVR)
According to the VPVR chart, Bitcoin's current support level is in the range of $82,600 to $83,000, where trading volume is dense, indicating strong buying support in this price area.
If the Bitcoin price falls below this support zone, it may test the next support level at $80,000. Conversely, if the price can regain the $84,000 level, it may continue to challenge the $86,000 resistance area.
Comprehensive Conclusion
Currently, Bitcoin is facing significant consolidation pressure, and market sentiment is relatively cautious in the short term, with technical signals indicating correction risks. Investors should pay attention to changes in key support and resistance levels and adjust their strategies flexibly. If the Bitcoin price can effectively break through $86,000 and hold that level, a new upward cycle may be on the horizon. Conversely, if it falls below the support level, caution is warranted in response to correction risks.
Overall, the market direction remains uncertain, and investors need to operate cautiously, avoiding excessive decisions during market fluctuations and waiting for more technical signals to confirm.
This article represents the author's personal views and does not reflect the stance or views of this platform. This article is for informational sharing only and does not constitute any investment advice to anyone.
AiCoin Official Website: aicoin.com
Telegram: t.me/aicoincn
Twitter: x.com/AiCoinzh
Email: support@aicoin.com
Group Chat: Customer Service Yingying、Customer Service KK
免责声明:本文章仅代表作者个人观点,不代表本平台的立场和观点。本文章仅供信息分享,不构成对任何人的任何投资建议。用户与作者之间的任何争议,与本平台无关。如网页中刊载的文章或图片涉及侵权,请提供相关的权利证明和身份证明发送邮件到support@aicoin.com,本平台相关工作人员将会进行核查。


