Market Background: The Subsequent Impact of Trump's Tariff Policy
In early April 2025, Trump announced a 125% high tariff on China and suspended new tariffs on other countries. This sudden policy adjustment triggered significant market volatility, putting unprecedented pressure on Bitcoin.
After experiencing substantial price fluctuations, Bitcoin gradually began to show certain trending characteristics, especially after a week of volatility, where its price oscillated between relatively stable support and resistance levels. During this process, market sentiment shifted from panic to cautious optimism, indicating a gradual adaptation to macroeconomic and monetary policies.

Candlestick Patterns and Price Trends: Attempting to Break Through After Consolidation
Candlestick Structure Analysis:
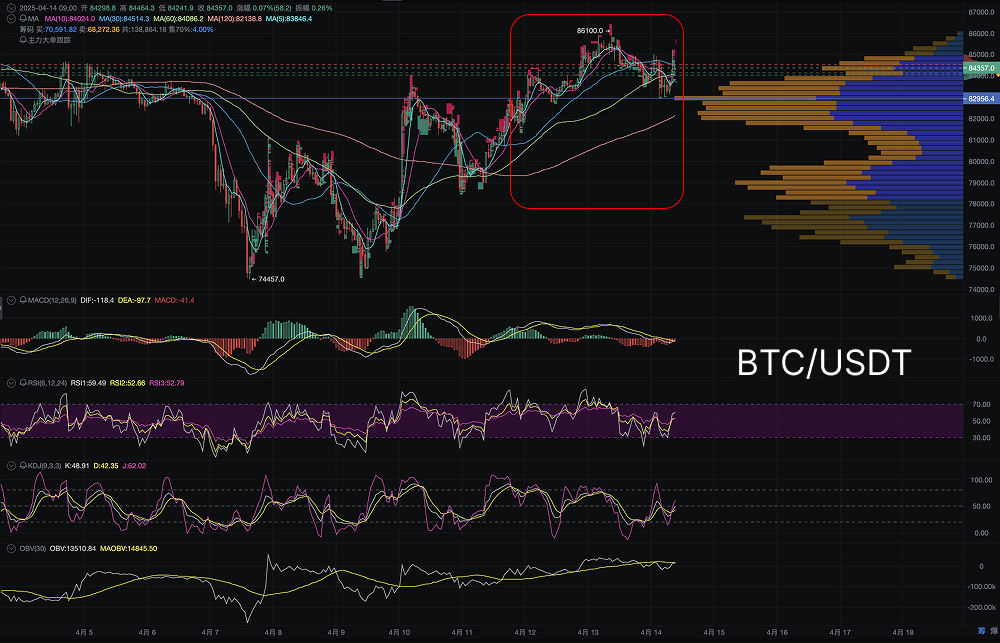
- Breakthrough and Pullback: Bitcoin's price broke through the strong resistance zone of $83,000 in the candlestick on April 12, but immediately experienced a pullback, dropping back to around $81,000. The current candlestick pattern shows certain characteristics of consolidation, reflecting the market's attempt to digest previous fluctuations and prepare for the next wave of price movements.
- Trend Patterns: The price has touched the resistance level of $84,000 multiple times but has failed to break through effectively. This price level has become the main pressure zone for Bitcoin's short-term rise, and it is expected to continue facing resistance in the short term.
Large Capital Movement Analysis:
- Capital Inflow: On-chain data indicates that Bitcoin saw significant capital inflow in the past 24 hours, with several large addresses transferring Bitcoin to exchanges, showing strong market interest in the current price range. This capital movement typically signals a reassessment of the "pullback space" for Bitcoin's current price, potentially indicating further upward potential.
- Block Trades: Near the $83,000 mark, there have been some larger sell orders, possibly indicating institutional investors taking advantage of the current price for arbitrage or hedging operations, which also affects short-term price fluctuations.
Technical Indicator Analysis:
- MACD: The current DIF line is above the DEA line, forming a golden cross, indicating that Bitcoin remains strong in the short term. However, the green bars of the MACD have decreased, suggesting that bullish momentum is weakening, and pullback risks still exist. Overall, the MACD operates above the zero line, indicating that the overall trend remains upward.
- RSI: Bitcoin's RSI is currently at 59.49, close to the overbought zone of 70, which may face a brief correction in the short term. However, the RSI has not reached extreme overbought levels, indicating that the market is still in a relatively healthy upward state. If the RSI breaks above 60, it may attract further buying.
- KDJ: The K value has broken above the D value, and the J value has surged significantly, indicating strong buying momentum in the short term. This movement in the KDJ indicator further confirms that Bitcoin may continue to maintain an upward trend in the short term.
- OBV (On-Balance Volume): The OBV indicator shows a significant increase in capital inflow, especially during price increases, with trading volume rising alongside the price, indicating that Bitcoin's rise is supported by capital, and the current upward trend is relatively robust.
Market Sentiment and Macroeconomic Factors
Market Sentiment Warms: After experiencing initial volatility from Trump's tariff policy, market sentiment has gradually warmed. Especially in the rebound after April 12, Bitcoin's price has shown relative resilience. Although uncertainties in macroeconomic policies still exist, the market is gradually gaining trust in Bitcoin's safe-haven attributes, with capital beginning to flow back into the crypto market.
Potential Impact of Federal Reserve Policies: The U.S. inflation rate fell to 2.4% in March, providing the Federal Reserve with more policy space. The market generally expects the Federal Reserve to consider interest rate cuts or maintain stable rates, which could lead to more capital flowing into risk assets, including Bitcoin. However, Trump's tariff policy still brings uncertainty to the global economy, and investors need to pay attention to the Federal Reserve's monetary policy decisions and any new tariff measures that may be introduced in the future.
Today's Trend Prediction: Possible Breakthrough After Consolidation
Based on the current technical analysis and market sentiment, Bitcoin may maintain a state of consolidation in the short term, with support at $80,000 and resistance between $83,000 and $85,000. Market sentiment leans towards bullish, but attention must still be paid to the long-term impact of Trump's tariff policy and the Federal Reserve's monetary policy on the market.
If Bitcoin's price breaks through the resistance level of $85,000 and can hold above this price range, it may enter the next upward cycle, targeting $88,000. Conversely, if the price fails to break through this resistance range, it may test the support level of $80,000 again.
This article represents the author's personal views and does not reflect the stance or views of this platform. This article is for informational sharing only and does not constitute any investment advice to anyone.
AiCoin Official Website: aicoin.com
Telegram: t.me/aicoincn
Twitter: x.com/AiCoinzh
Email: support@aicoin.com
Group Chat: Customer Service Yingying、Customer Service KK
免责声明:本文章仅代表作者个人观点,不代表本平台的立场和观点。本文章仅供信息分享,不构成对任何人的任何投资建议。用户与作者之间的任何争议,与本平台无关。如网页中刊载的文章或图片涉及侵权,请提供相关的权利证明和身份证明发送邮件到support@aicoin.com,本平台相关工作人员将会进行核查。


