Source: Cointelegraph Original: "{title}"
Ethereum's native token ETH fell by 18.47% in March, marking the fourth consecutive month of closing in the red. This market structure reflects a persistent bearish trend, the first of its kind since the 2022 bear market.
As the monthly closing price fell below the previous month's low, analysts began discussing whether Ethereum is nearing a bottom or if this altcoin still has further downside potential.
On March 30, the Ethereum/Bitcoin ratio dropped to its lowest point in five years at 0.021. This ratio measures the value of ETH relative to BTC, and the current decline highlights Ethereum's poor performance over the past five years.
In fact, the last time the Ethereum/Bitcoin ratio fell to 0.021 was in May 2020, when ETH's price ranged between $150 and $300.
Ethereum/Bitcoin 1-month chart. Source: Cointelegraph/TradingView
According to data from Token Terminal, Ethereum's monthly fees fell to $22 million in March 2025, the lowest level since June 2020, indicating a decline in network activity and market interest.
Ethereum fees reflect the transaction costs paid by users, influenced by network demand. When network fees begin to decline, it indicates reduced network utility.
Ethereum fees and prices. Source: Token Terminal
Despite the lackluster price trends and revenue, Ethereum analyst VentureFounder believes that the ETH/BTC bottom may appear in the coming weeks. He predicts a potential bottom range between 0.017 and 0.022, noting that the ratio may decline further before warming up. The analyst stated:
"The Relative Strength Index (RSI) may hit new lows, and prices may dip again. The current market trend is very similar to the Fed's tightening and quantitative easing (QE) cycle from 2018-2019. A first higher peak is expected after the May Federal Open Market Committee (FOMC) meeting, when the Fed ends quantitative tightening (QT) and begins quantitative easing."
Ethereum/Bitcoin analysis by VentureFounder. Source: X.com
Since its inception, ETH has experienced five instances of three consecutive months or longer of monthly red candles, each time forming a short-term bottom. The chart below shows that 2018 had the longest streak of consecutive red candles, lasting seven months, but prices rose by 83% after the correction ended.
Ethereum monthly chart. Source: Cointelegraph/TradingView
In 2022, after three consecutive months of red candles, ETH's price remained in a range for nearly a year, but the bottom occurred during the third red candle period in June 2022. Historical data shows that Ethereum has a 75% chance of producing a green candle in April.
Based on Ethereum's past quarterly return data, the second quarter has the fewest instances of drawdowns compared to other quarters. The average return for the second quarter is as high as 60.59%, suggesting a potential positive return in April.
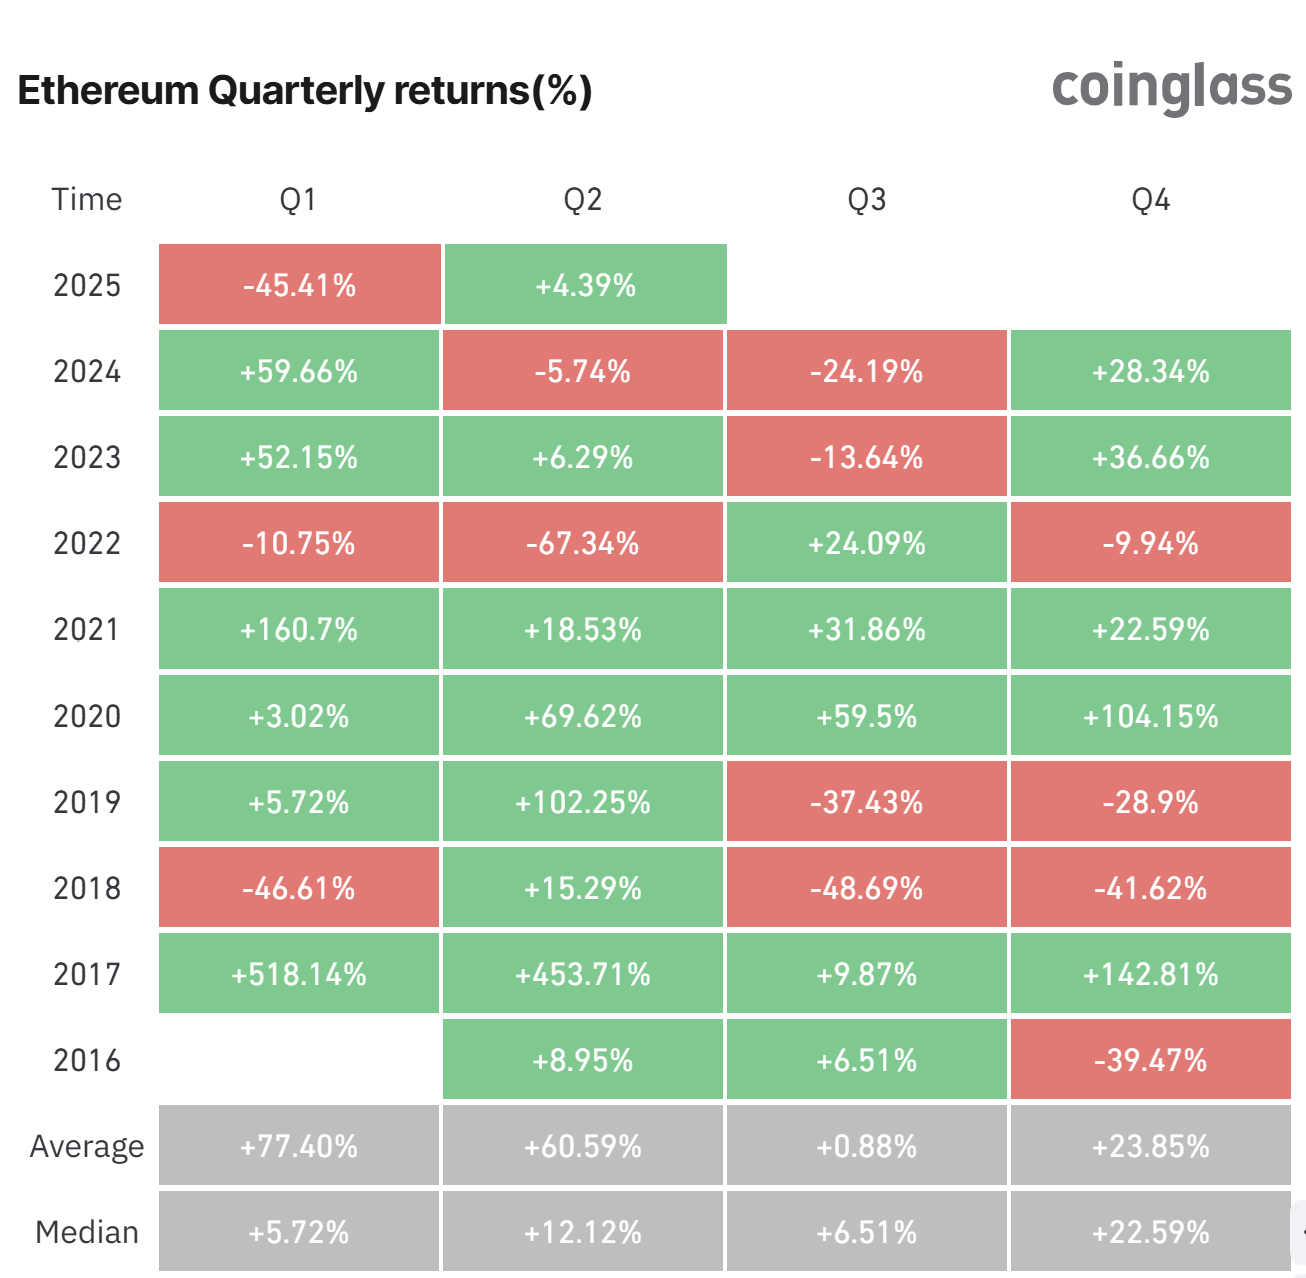
Ethereum quarterly returns. Source: CoinGlass
Related: Three Reasons for Ethereum's Continued Price Decline
免责声明:本文章仅代表作者个人观点,不代表本平台的立场和观点。本文章仅供信息分享,不构成对任何人的任何投资建议。用户与作者之间的任何争议,与本平台无关。如网页中刊载的文章或图片涉及侵权,请提供相关的权利证明和身份证明发送邮件到support@aicoin.com,本平台相关工作人员将会进行核查。


