The market seems to have reversed. Yesterday, U.S. stocks opened low and then rose, driving the development of the entire cryptocurrency market. Let's take a look at the time operation logic of Bitcoin in the crypto market. Where are we currently, and where will we go next?
First, let's return to the overall structural map. It is a divergence adjustment of the daily level bottom structure. The current structure belongs to a static divergence, and it has formed a very nice bottom fractal.
At the same time, the larger structure has once again retested the weekly K-level, and the current closing line of the weekly K is above the EMA 56 moving average.
Last night, it seems that someone was accumulating. When we observed the volume data, we found that someone accumulated 8,000 Bitcoins, so in this process, what level should we focus on today to find opportunities?
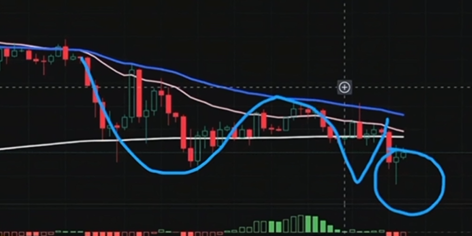
First, this wave of market pullback is constrained by the bottom divergence structure at the 6-hour level. Currently, this 6-hour is not diverging.
However, why was it able to V-shape back up yesterday? The reason is also due to the excessive rebound at the 90-minute level.
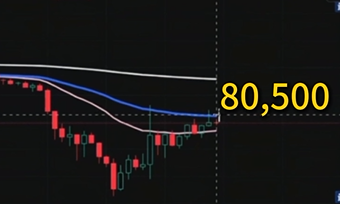
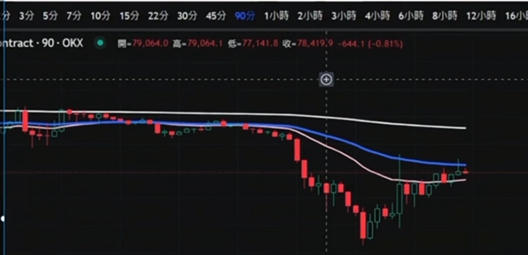
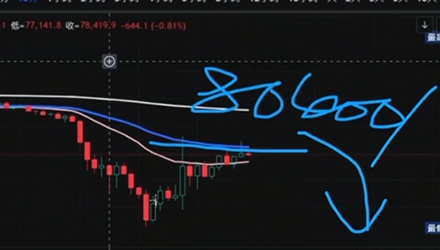
Today, it has returned to the 90-minute level, around the price of 80,500.
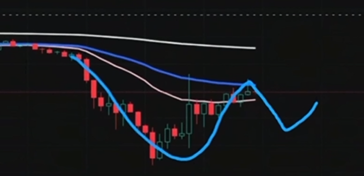
Therefore, the key structure to track today is the bottom formation at the 90-minute level. If the 90-minute can pull back again to form a double bottom structure, it would be very nice.
This will play a very important role in completing the non-divergent structural adjustment at the 6-hour level, so within the internal adjustment cycle of the 6-hour, it has already moved the time operation to this 90-minute level.
In the 90-minute level, its resistance level is in the range of 80,400 (500). If it pulls back, there will be an opportunity to form a second bottom, and during this process, we will look for opportunities to enter at the bottom.
Therefore, we are focusing on the gap above Bitcoin, which is nearly 4,000 points, while the support level below is at the 90-minute level. The important price action zone is in the range of 78,200-77,000. If it goes extreme, it may clear the chips in the range of 76,200 and 74,500. This area can serve as two opportunities for building positions.
The bullish market will confirm in the second comparison at the 90-minute level, and the pullback confirmation is our opportunity for an upward move.
Every day, we share the market trends, strategies, and on-chain data summaries. For example, this morning we mentioned that
on-chain data shows that 8,022 large coins were withdrawn from exchanges, indicating that institutions are accumulating. Therefore, in this process, we need to be clear about what actions the institutions are taking. We will also recommend spot investment opportunities and look for quality trading opportunities.
If you haven't followed our public account yet, scan the QR code below to follow: KK Strategy

免责声明:本文章仅代表作者个人观点,不代表本平台的立场和观点。本文章仅供信息分享,不构成对任何人的任何投资建议。用户与作者之间的任何争议,与本平台无关。如网页中刊载的文章或图片涉及侵权,请提供相关的权利证明和身份证明发送邮件到support@aicoin.com,本平台相关工作人员将会进行核查。


