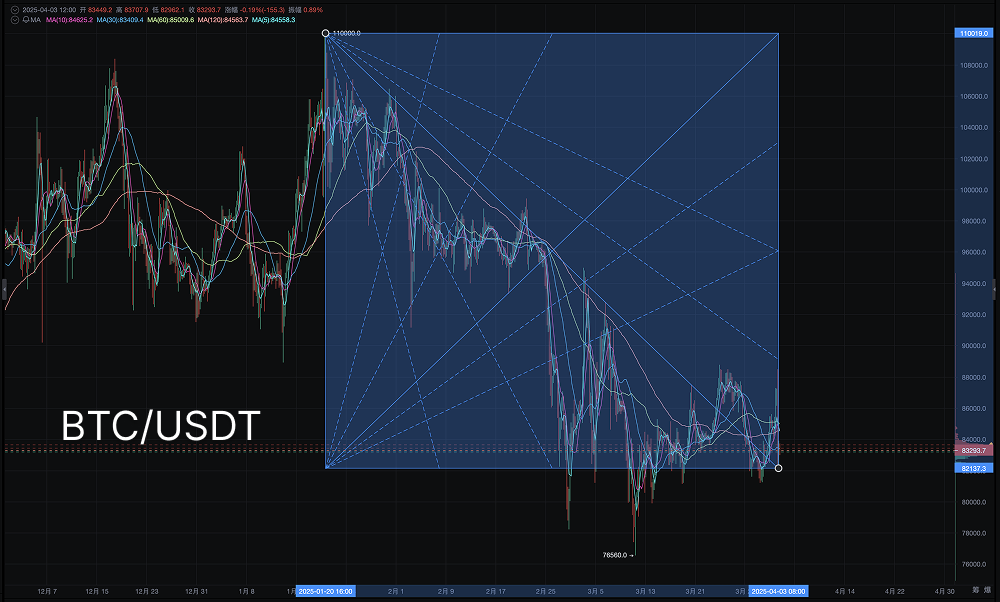
Recently, the price of Bitcoin (BTC) has been volatile, with intense market competition between bulls and bears. In technical analysis, Gann Theory serves as a classic time-space analysis tool that can help traders identify key support and resistance areas. In this analysis, we will explore the key price levels and potential trends for Bitcoin in the short term, using the Gann Square analysis.
Basic Concept of Gann Square
The Gann Square is a technical analysis tool based on the symmetry of time and price. It identifies possible market turning points and trend directions by setting up a proportionate time-price grid. Among these, the 45° Gann line (1×1 line) is an important reference for trend changes; when the price moves along this line, it usually indicates a solid trend. Breaking below or above these key lines often signals a market turning point.

Bitcoin Trend Analysis: Short-term Support and Resistance
In this analysis, we constructed a Gann Square covering the period from January 20, 2025, to April 3, 2025, with a price range from $110,000 to $76,500, to observe Bitcoin's performance within this time-space framework.
Current Price Overview: Bitcoin is currently in the lower half of the square and is testing the support at $82,137.3, which is one of the bottom support areas of the square. If this support holds, the market may see a short-term rebound.
Key Support Levels
- $82,137.3 (Bottom boundary of the square) — Short-term bullish defense area; if lost, further declines may occur.
- $80,000 - $78,000 (Previous low area) — If it breaks below $82,137.3, it may test this support range.
Key Resistance Levels
- $83,350 - $85,000 (1/4 position of the square & Fibonacci retracement 0.382) — If there is a short-term rebound, this range will become the first resistance level.
- $90,000 (Near the Gann 45° line) — If this level is broken, the market trend may reverse towards a stronger pattern.
- $95,000 - $98,000 (Center area of the square) — An important trend watershed; breaking through this level may lead to a return to the $100,000 mark.
Future Trend Predictions and Trading Strategies
Short-term Trend (1-2 weeks)
If Bitcoin holds the support at $82,137.3 and successfully breaks above $83,350, the short-term rebound target may be in the range of $85,000 - $88,000. If it breaks below $82,137.3, the market may further test the $80,000 - $78,000 range.
Medium-term Trend (within 1 month)
If it breaks above $90,000 - $95,000, the market trend will clearly strengthen, with a potential challenge to $100,000.
If it faces resistance in the $85,000 - $90,000 range, the market may enter a consolidation phase or even further decline.
Conclusion and Risk Warning
📌 Short-term focus on the $82,137.3 support; if it holds, look towards $85,000 - $88,000 📌 If it breaks below $82,137.3, it may seek support in the $80,000 area 📌 Breaking above $90,000 - $95,000 will lead the market into a stronger pattern
The current market still exhibits significant volatility, and traders need to incorporate risk management strategies to avoid excessive leverage. Gann Theory provides a method for predicting market trends, but actual trading should still be combined with other technical indicators (such as MACD, RSI, Fibonacci retracement) for comprehensive judgment.
As market sentiment changes, Bitcoin's trends may still be influenced by macroeconomic factors and market liquidity. Investors should remain vigilant and closely monitor the breakthrough of key support and resistance levels to formulate more robust trading strategies.
This article represents the author's personal views and does not reflect the stance or views of this platform. This article is for informational sharing only and does not constitute any investment advice to anyone.
AiCoin Official Website: aicoin.com
Telegram: t.me/aicoincn
Twitter: x.com/AiCoinzh
Email: support@aicoin.com
Group Chat: Customer Service Yingying、Customer Service KK
免责声明:本文章仅代表作者个人观点,不代表本平台的立场和观点。本文章仅供信息分享,不构成对任何人的任何投资建议。用户与作者之间的任何争议,与本平台无关。如网页中刊载的文章或图片涉及侵权,请提供相关的权利证明和身份证明发送邮件到support@aicoin.com,本平台相关工作人员将会进行核查。


