Master Discusses Hot Topics:
How to describe the recent market sentiment? It really feels a bit like September 2023, when the market was lifeless. Later, the news about ETFs broke the deadlock, and confidence surged, ultimately reviving the Bitcoin bull market.
Currently, to restart the market, we still need some comparable big news. For instance, major moves like interest rate cuts or quantitative easing are necessary to create a real bull market in the crypto space, rather than just Bitcoin having its own party.
Thus, Master sees that many people still say the bull market hasn't arrived, and indeed, from a macro cycle perspective, this statement holds some truth. Simply put, institutional investors are frantically buying Bitcoin, while retail investors are preoccupied with altcoins. Retail investors don't care how much Bitcoin has risen; why?
Because they don't hold any Bitcoin at all. They are all thinking about when the altcoin season will come, as they are holding a bunch of altcoins waiting to break even. So what does this imply?
It's clear that institutions and major players are using worthless altcoins as a scythe, crazily cutting retail investors' hard-earned money, with the ultimate goal of converting it into Bitcoin. What is valuable has already been demonstrated by North Korean hackers. Master has long stated in articles that market liquidity is extremely poor; anyone who still believes that the altcoin season can turn things around is simply a fool.
The performance in the past couple of days has been decent. However, the issue of tariffs is still testing retail investors' patience, and the three major U.S. stock indices collectively retreated before the market closed. What does this indicate? The market is still troubled by the uncertainty surrounding tariffs.
After all, there is still no definitive word on what the tariffs will be. At 5 AM Beijing time on April 3, Trump is set to officially announce the tariff results; let's see what happens then.
Returning to Bitcoin, the daily chart seems to show a V-shaped reversal, touching the upper Bollinger Band, which at first glance looks like a trend. But don't rush to be bullish; the higher it goes, the greater the pressure. Human nature is such that after a slight rebound, people think it can keep rising, rising, rising, with their minds filled with bull market illusions.
But this isn't a one-sided rise; how could it keep surging? In a volatile market, rebounds never last more than 72 hours; this is a hard rule. Tomorrow is Thursday, and according to what Master mentioned earlier, if there is a rebound on Monday or Tuesday, we should generally be bearish on Thursday and Friday. This won't always be accurate, but most of the time, it's reliable.
Master Looks at Trends:

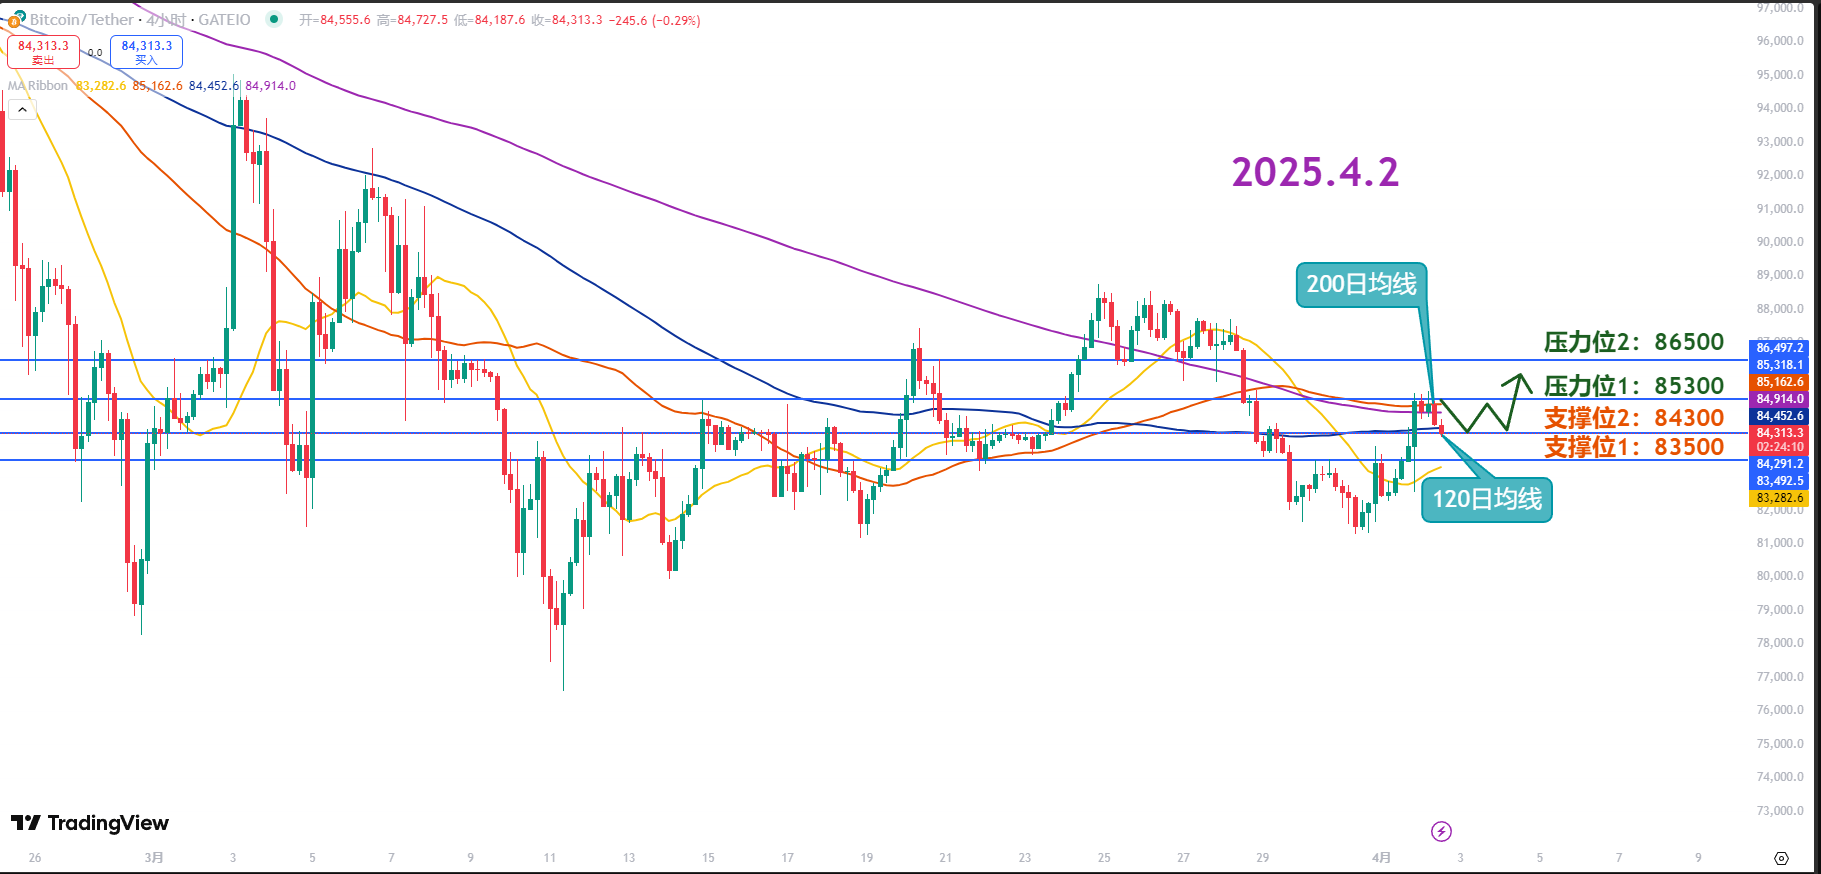
Resistance Levels Reference:
First Resistance Level: 86500
Second Resistance Level: 85300
Support Levels Reference:
First Support Level: 84300
Second Support Level: 83500
Today's Suggestions:
Bitcoin has been testing after breaking through 85K, currently consolidating in the range of the 200-day and 120-day moving averages. Due to the formation of a large bearish candle on the 4-hour chart, if it enters a consolidation phase, it can be seen as a high-level consolidation, thus maintaining a short-term rebound view.
If it breaks through the first resistance level again, it may form an N-shaped upward trend. The price is expected to rise to around 87K. If the current candle closes above the 200-day moving average, the upward trend will further increase.
Since the price is hovering near the 200-day moving average, if it can hold the historical high area of 84~84.3K, further upward movement can be expected. Additionally, attention can be paid to the breakthrough of the resistance line.
The first support at 84.3K coincides with the 120-day moving average, making it an important support level for today. There may be a situation where the candle has a lower shadow (i.e., price drops and then rebounds), so 84~84.3K can be set as an important support area.
If the price drops to the second support at 83.5K, and the candle body is a bearish candle (closing price lower than the opening price), the view will turn bearish; if it stops falling and shows a lower shadow, the rebound view can be maintained.
Since a large bullish candle has formed, as long as the adjustment does not drop more than 50% of the large bullish candle's range, the rebound view can continue to be maintained.
4.2 Master’s Wave Strategy:
Long Entry Reference: Light position in the range of 82500-83500, Target: 84300-85300
Short Entry Reference: Light position in the range of 85600-86500, Target: 84300-83500
This article is exclusively planned and published by Master Chen (public account: Coin God Master Chen). Master Chen is the same name across the internet. For more real-time investment strategies, breaking even, spot trading, short, medium, and long-term contract trading techniques, operational skills, and knowledge about candlesticks, you can join Master Chen for learning and communication. A free experience group for fans has been opened, along with quality experience projects like community live broadcasts!

Warm Reminder: This article is only written by Master Chen on the official account (as shown above), and any other advertisements at the end of the article or in the comments section are unrelated to the author!! Please be cautious in distinguishing authenticity, thank you for reading.
免责声明:本文章仅代表作者个人观点,不代表本平台的立场和观点。本文章仅供信息分享,不构成对任何人的任何投资建议。用户与作者之间的任何争议,与本平台无关。如网页中刊载的文章或图片涉及侵权,请提供相关的权利证明和身份证明发送邮件到support@aicoin.com,本平台相关工作人员将会进行核查。


