Source: Cointelegraph Original: "{title}"
At the close of the week on March 23, Bitcoin (BTC) fluctuated around $85,000, with market expectations for a key trend change continuing to heat up.
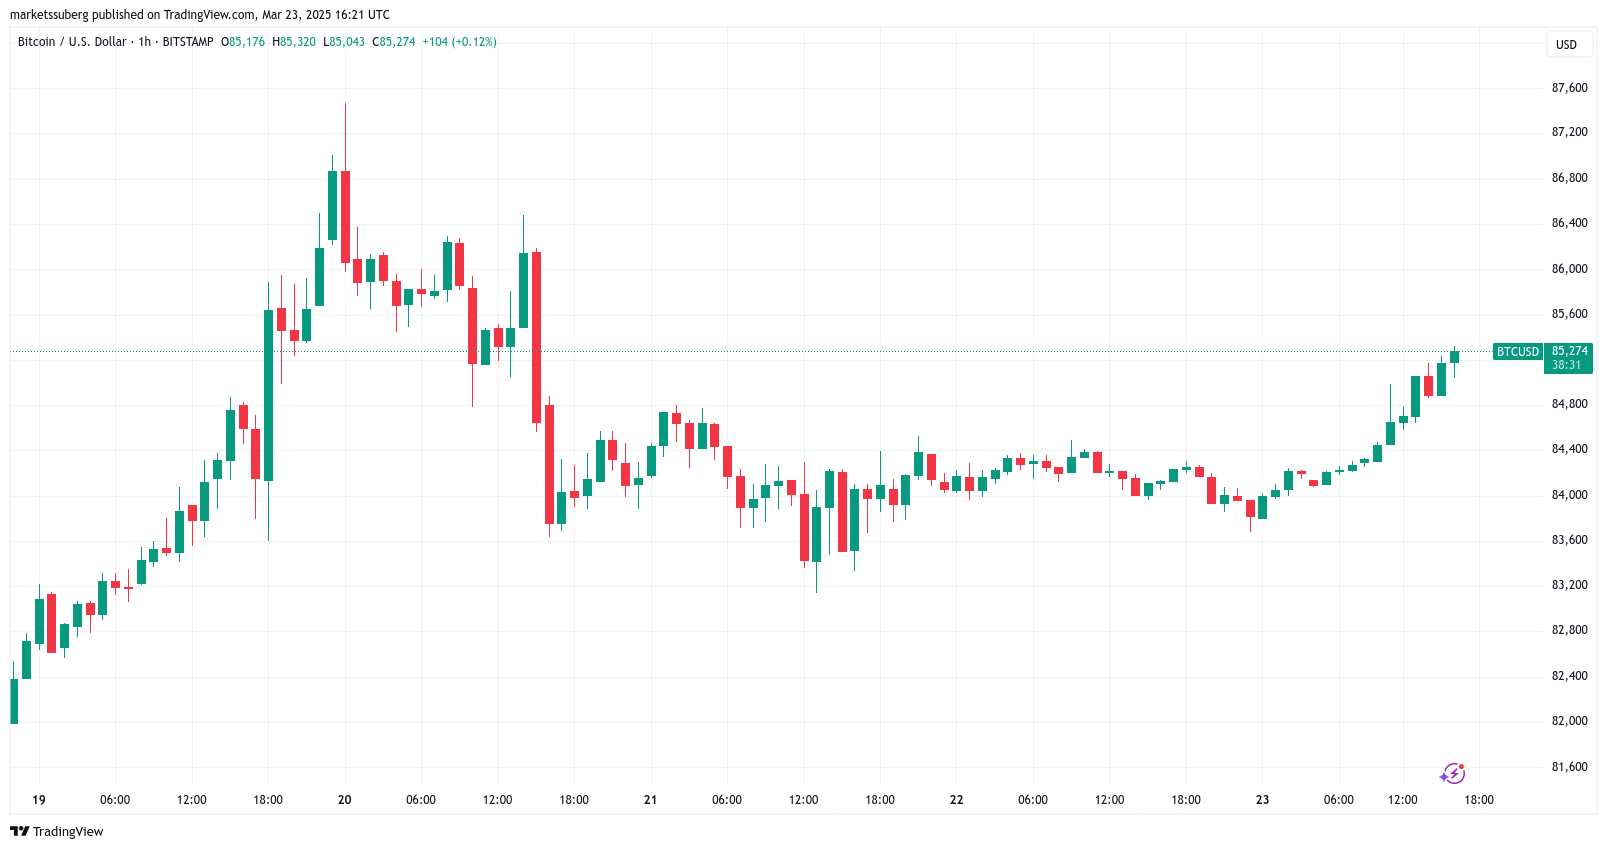
BTC/USD 1-hour chart. Source: Cointelegraph/TradingView
Bitcoin price sees decisive RSI situation
Data from Cointelegraph Markets Pro and TradingView shows that BTC/USD exhibited upward momentum during the weekend trading session.
Bitcoin rose 1.5% on the day, slightly higher, which is part of a broader increase across the cryptocurrency market, with many mainstream altcoins also rising.
"I think we will see the market's direction in a higher time frame next week," noted prominent trader Daan Crypto Trades in his latest analysis on the X platform, mentioning the closing situation of CME Group Bitcoin futures.
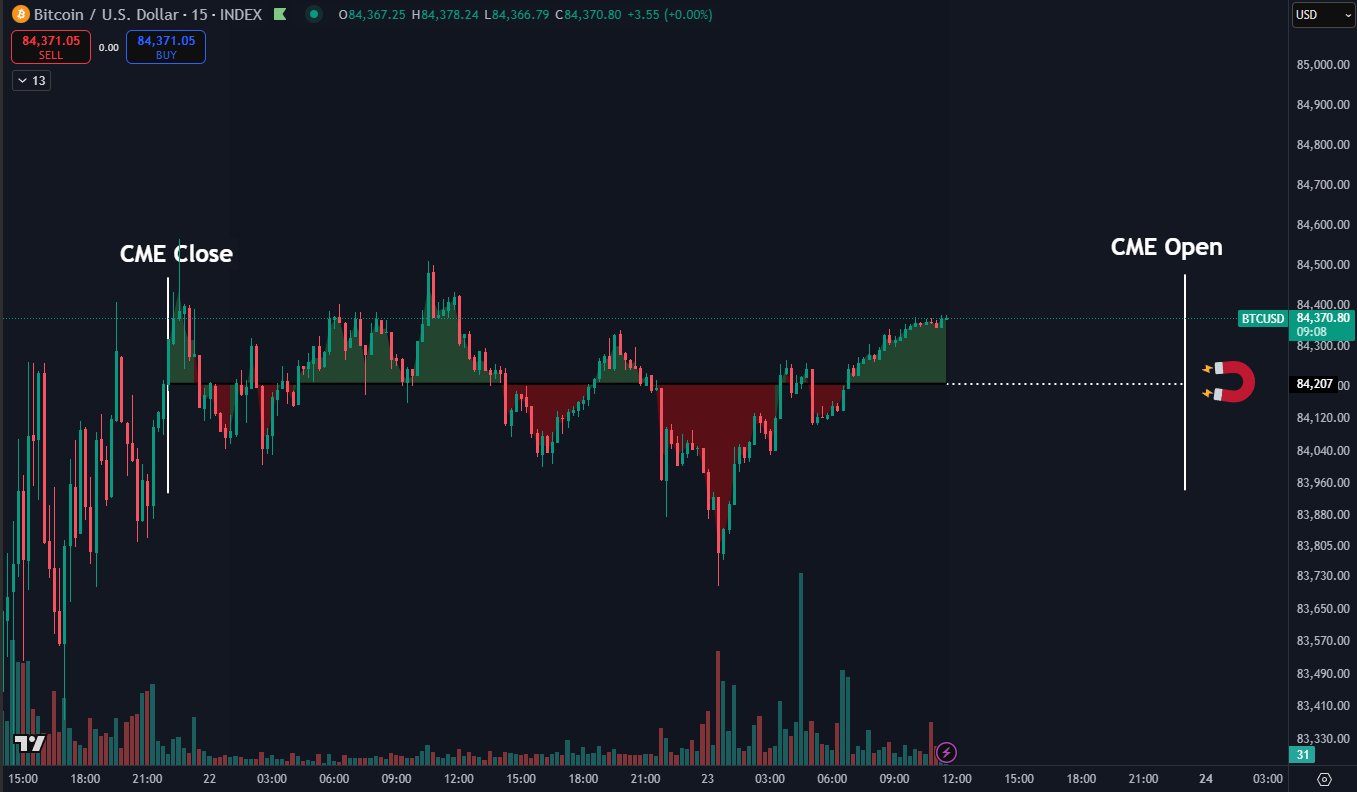
BTC/USD 15-minute chart. Source: Daan Crypto Trades/X
This post reflects broader market sentiment, with traders focusing on the potential for Bitcoin prices to rise again before the end of the month.
Renowned trader and analyst Rekt Capital reiterated the encouraging breakout signals appearing in Bitcoin's relative strength index (RSI) on the daily chart.
"The RSI on the daily chart shows initial signs of re-testing the downtrend line since November 2024 and using it as new support," he reported.
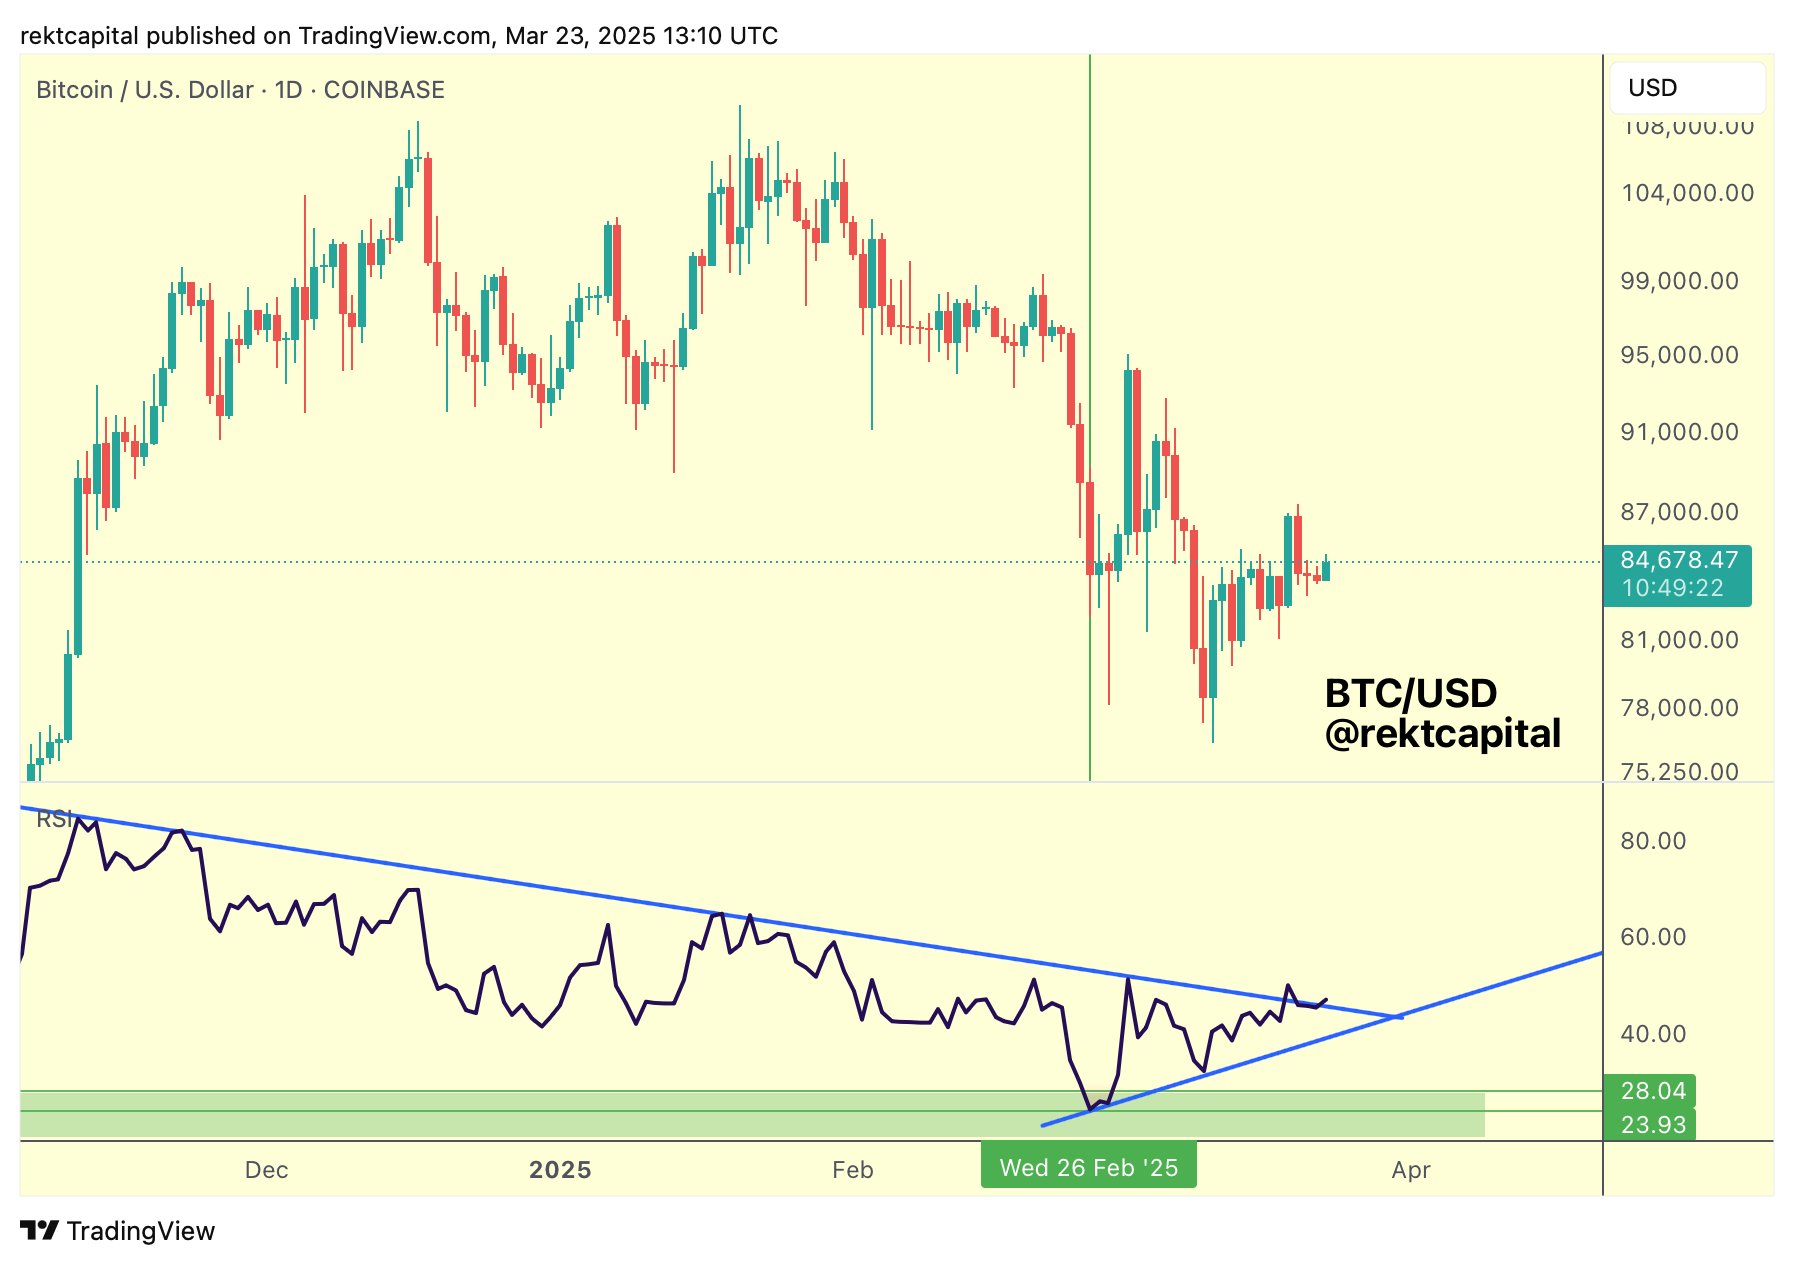
BTC/USD daily chart and RSI data. Source: Rekt Capital/X
However, for another analyst, Matthew Hyland, the current price levels hold deeper significance.
He revealed that BTC/USD is about to form a key bullish RSI divergence on the weekly chart for the first time in six weeks.
"Bitcoin is expected to form a bullish divergence on the weekly chart for the first time since last September," he confirmed on the X platform.
"We are currently in a related situation."
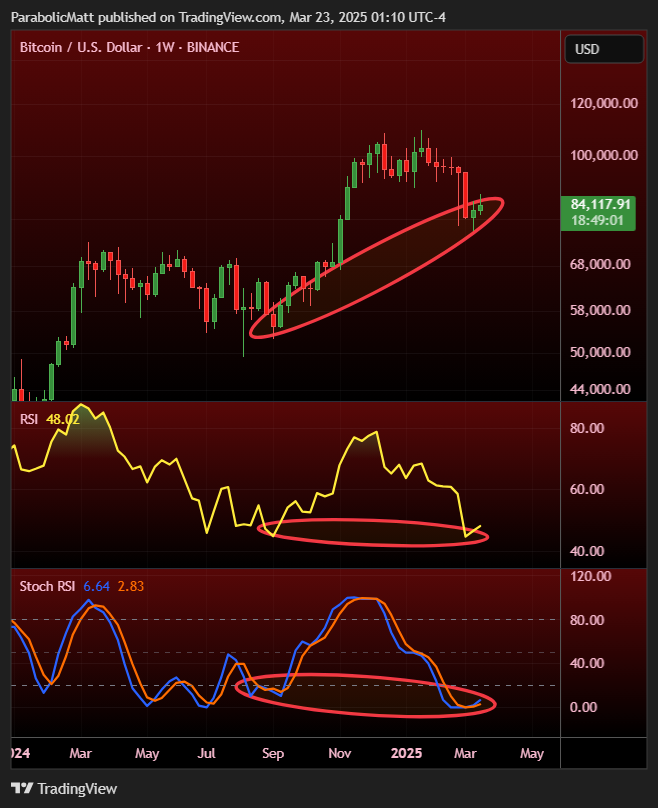
BTC/USD weekly chart and RSI data. Source: Matthew Hyland/X
Will the bull market return in "a few weeks"?
On the other hand, the trading team Stockmoney Lizards does not agree with the view that Bitcoin is at risk of entering a long-term bear market.
The team informed their followers on the X platform in their latest market analysis that Bitcoin's local bottom is at $76,000, a level that has already been tested earlier this month.
"When many are panicking and claiming a bear market is coming, the long-term trend channel (green line) remains solid," the team summarized, attaching a chart showing Bitcoin's price fluctuations around the average trend line during the bull market.
"This pullback does not negate the upward trend; rather, it confirms it."
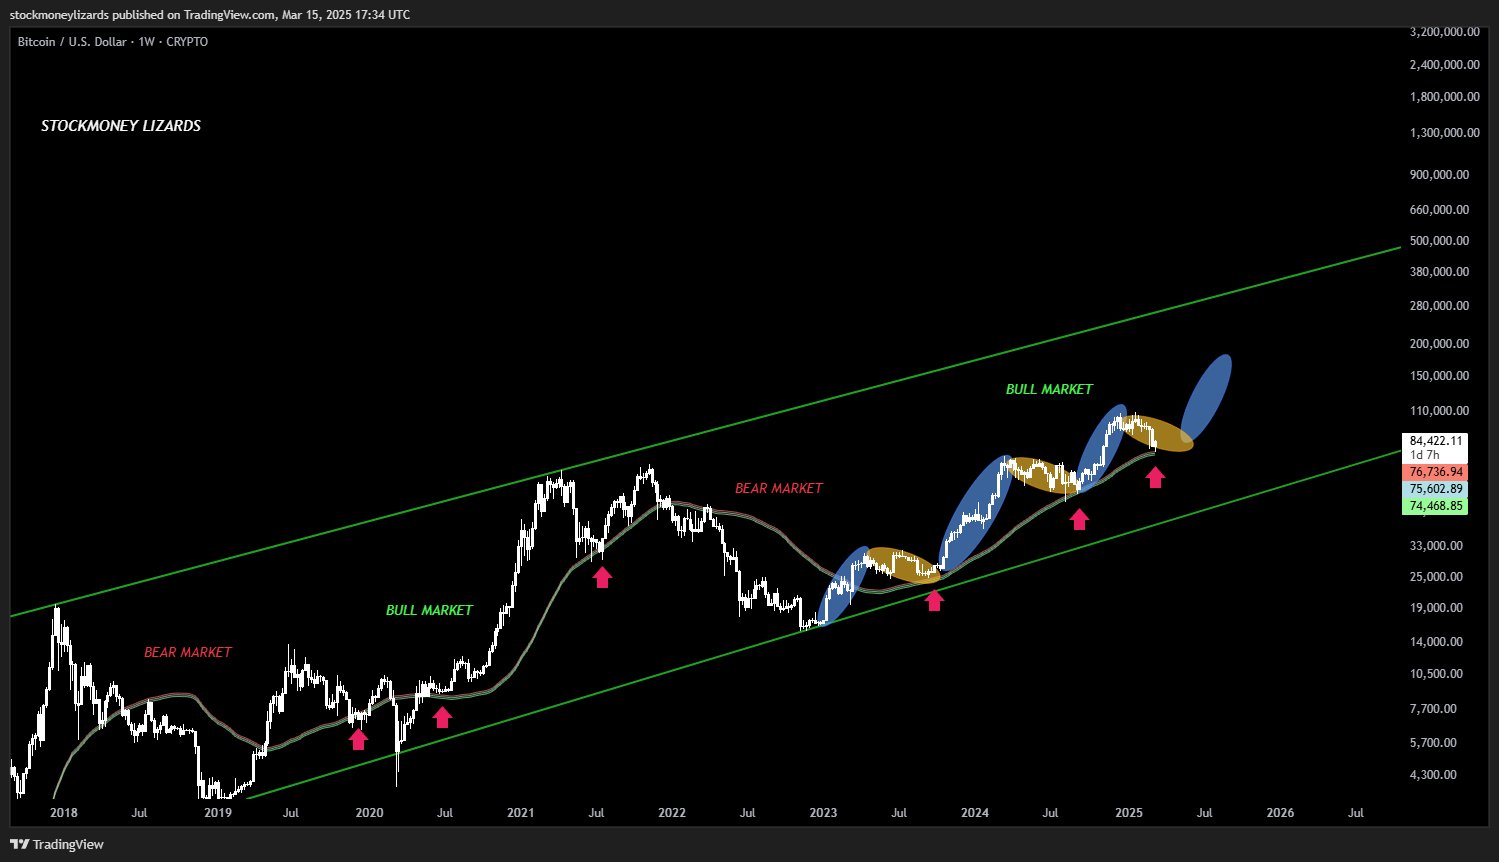
BTC/USD weekly chart. Source: Stockmoney Lizards/X
Stockmoney Lizards also acknowledged that it may take some time for Bitcoin prices to continue rising.
"This test does not guarantee that prices will immediately surge, but historical experience suggests we are approaching the bottom area," the team concluded.
"How long will this take? Well, no one knows. Nowadays, news, macroeconomic signals, and other factors could determine the duration of the pullback. It is reasonable to speculate: it may take a few weeks."
Related: Bitfinex Bitcoin long positions hit a 6-month high, will Bitcoin prices follow?
This article does not contain investment advice or recommendations. Every investment and trading action carries risks, and readers should conduct their own research when making decisions.
免责声明:本文章仅代表作者个人观点,不代表本平台的立场和观点。本文章仅供信息分享,不构成对任何人的任何投资建议。用户与作者之间的任何争议,与本平台无关。如网页中刊载的文章或图片涉及侵权,请提供相关的权利证明和身份证明发送邮件到support@aicoin.com,本平台相关工作人员将会进行核查。


