Author: ChandlerZ, Foresight News
Recently, the cryptocurrency market has shown signs of liquidity contraction and a shift in investor risk appetite after experiencing a period of bull market prosperity. On-chain data and key indicators from the derivatives market indicate that the market is transitioning from a state of high volatility and speculation to a more cautious, low liquidity phase. On-chain activity for Bitcoin and Ethereum shows a significant decrease in hot supply and a noticeable reduction in exchange inflows.
Is the current market at a turning point? Is it a bull retracement or the end of the bull market? How should investors seize opportunities amid shrinking liquidity and adjusting risk preferences? This article aims to analyze the current market environment based on on-chain activities of Bitcoin and Ethereum, exchange fund flows, and market dynamic data.
Overall Liquidity Contraction and Decrease in Market Activity
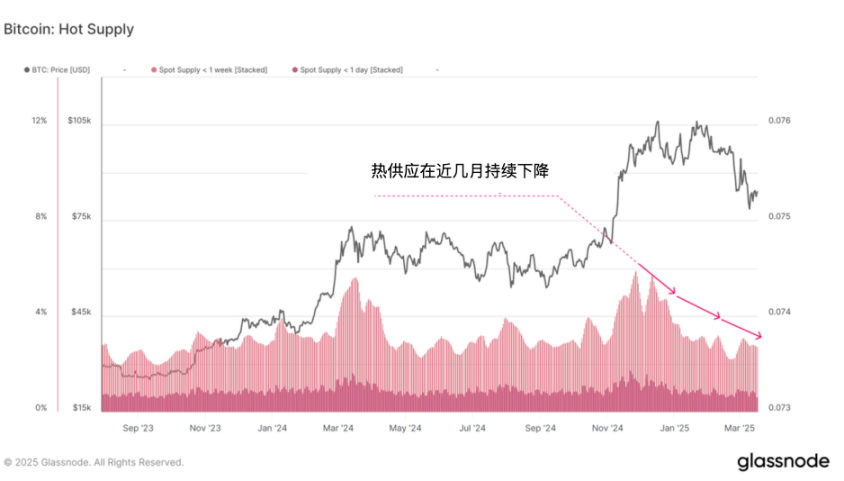
According to data from Glassnode, Bitcoin's on-chain activity has dropped to levels not seen in months, with a significant decrease in transaction volume, a phenomenon that often indicates a market correction after high volatility. Bitcoin's "Hot Supply," which measures and quantifies active capital in the market (the capacity of Bitcoin held for less than a week), has decreased from 5.9% to 2.8% over the past three months, showing a decline of over 50%. This further corroborates the phenomenon of liquidity contraction.
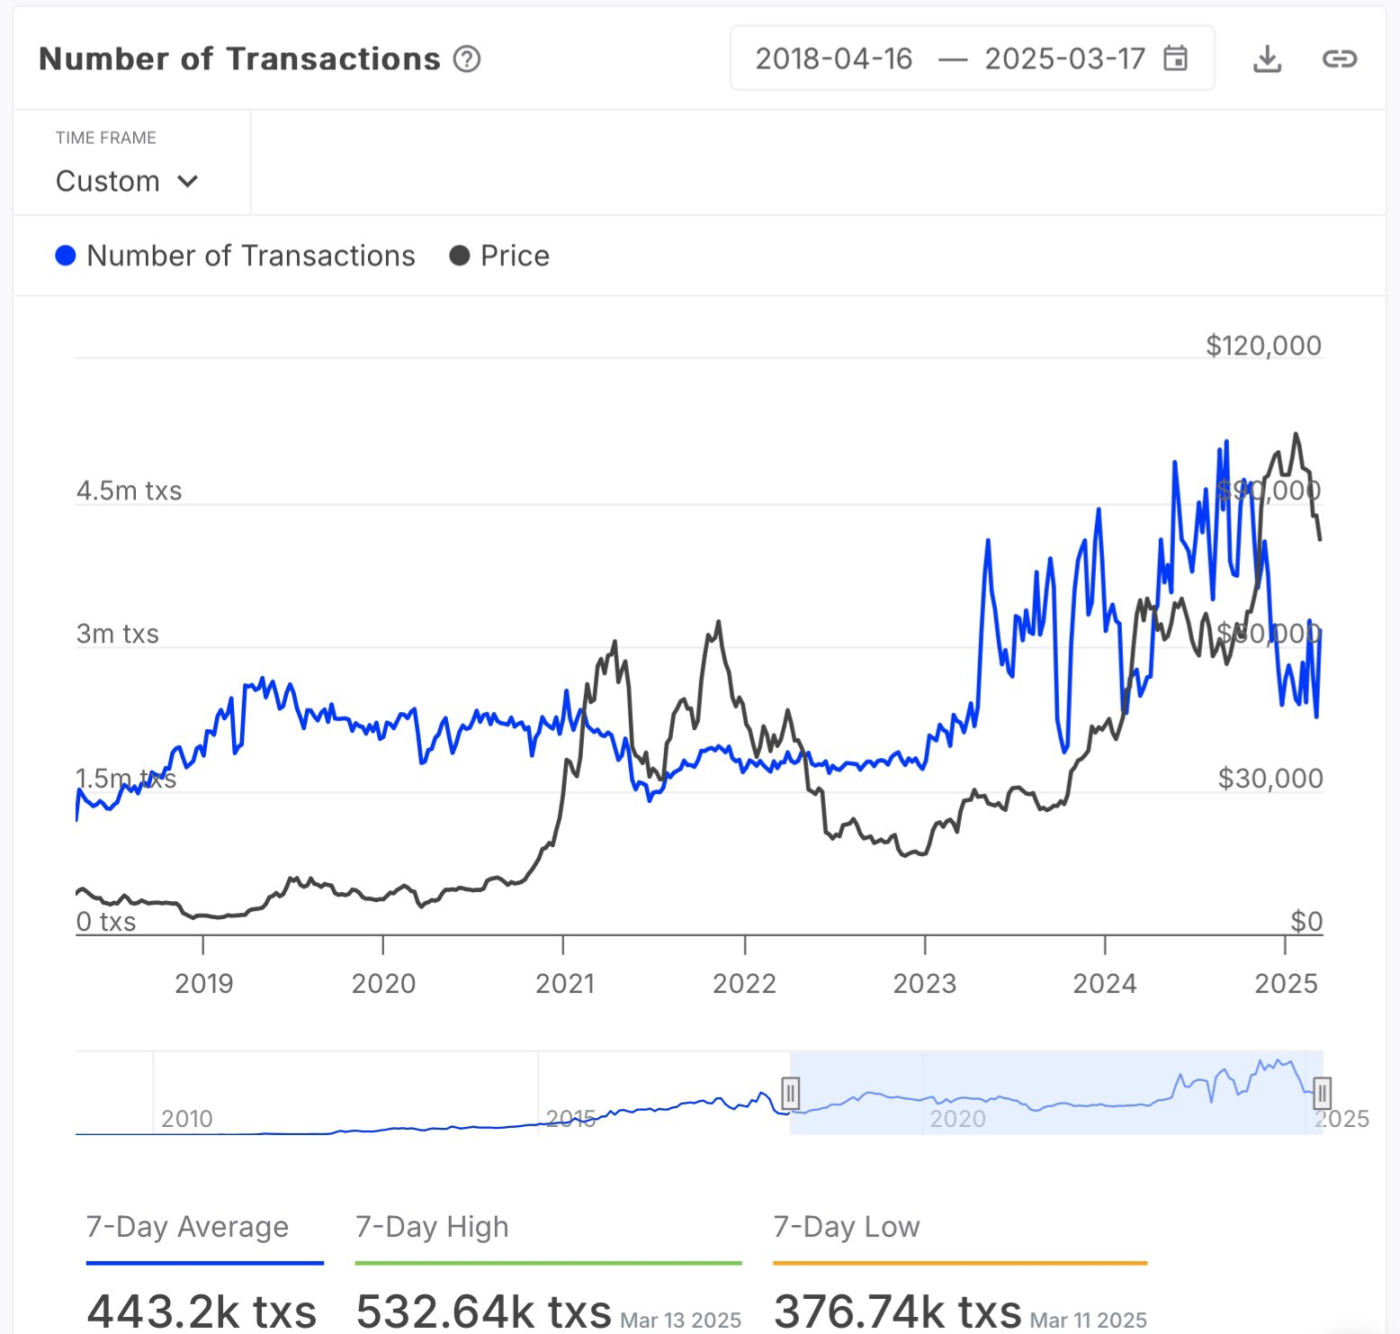
From the perspective of on-chain transaction numbers, Bitcoin's on-chain activity has also dropped to levels not seen in months, indicating that the market is entering a cooling period or experiencing a decline in short-term interest. The decrease in transaction volume seems to also imply a reduction in speculative activity. If long-term holders do not sell and new capital inflows are limited, the market may enter an accumulation phase.
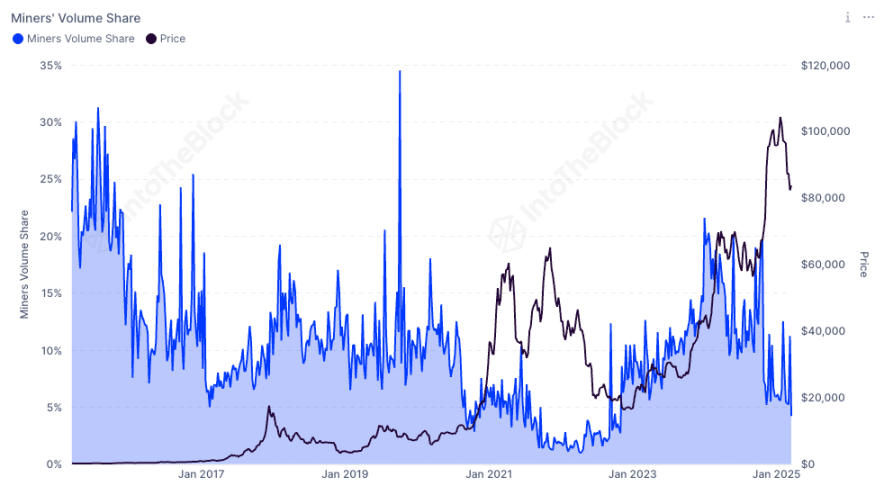
Meanwhile, the share of Bitcoin miners in the total on-chain transaction volume has dropped to 4.23%, the lowest level since November 2022. This data reflects a significant decrease in miners' participation in on-chain trading activities. A lower trading share may indicate that miners are reducing their selling behavior, opting instead to hold their coins to cope with market volatility, thereby reducing the selling pressure in the market caused by miner sell-offs.
The relative decline in miner transaction volume may also suggest that other market participants (such as long-term holders or institutional investors) are more active, leading to a change in the overall on-chain trading structure. Against the backdrop of market changes and declining mining revenues, miners may be adjusting their strategies, reducing frequent on-chain transactions, and concentrating resources to optimize their revenue structure.
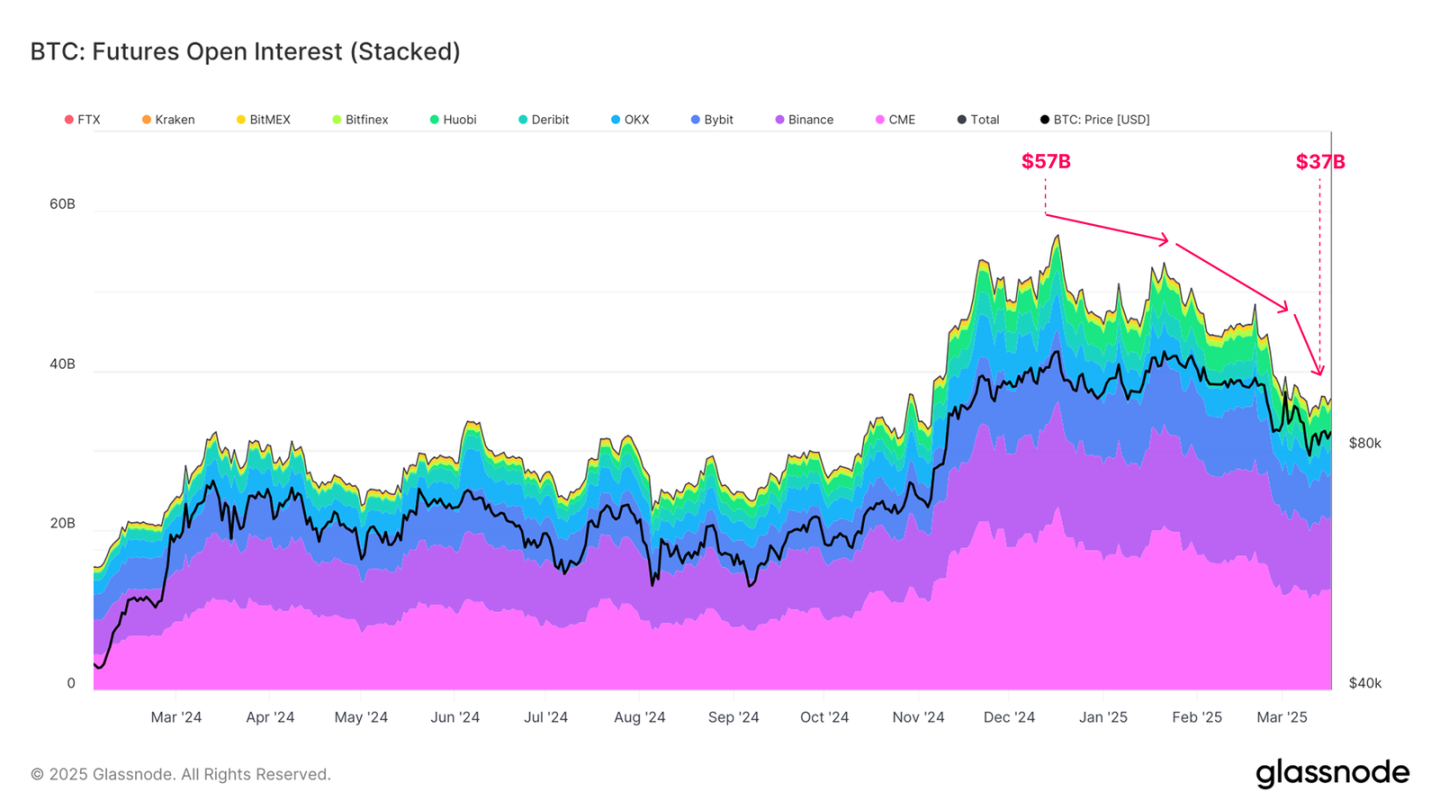
In the futures market, the total open interest has fallen from an ATH of $57 billion to $37 billion, a decline of about 35%, indicating a significant reduction in hedging and speculative activities in the market.
At the same time, after the launch of the US spot ETF in 2024, institutions had gained arbitrage profits through cash arbitrage (long ETF + short futures) in an upward market. However, as market confidence weakened and long-side arbitrage unwound, arbitrage trading gradually exited, leading to outflows from the ETF and further downward pressure on the spot market.
Ethereum Exchange Supply Drops to Near 10-Year Low
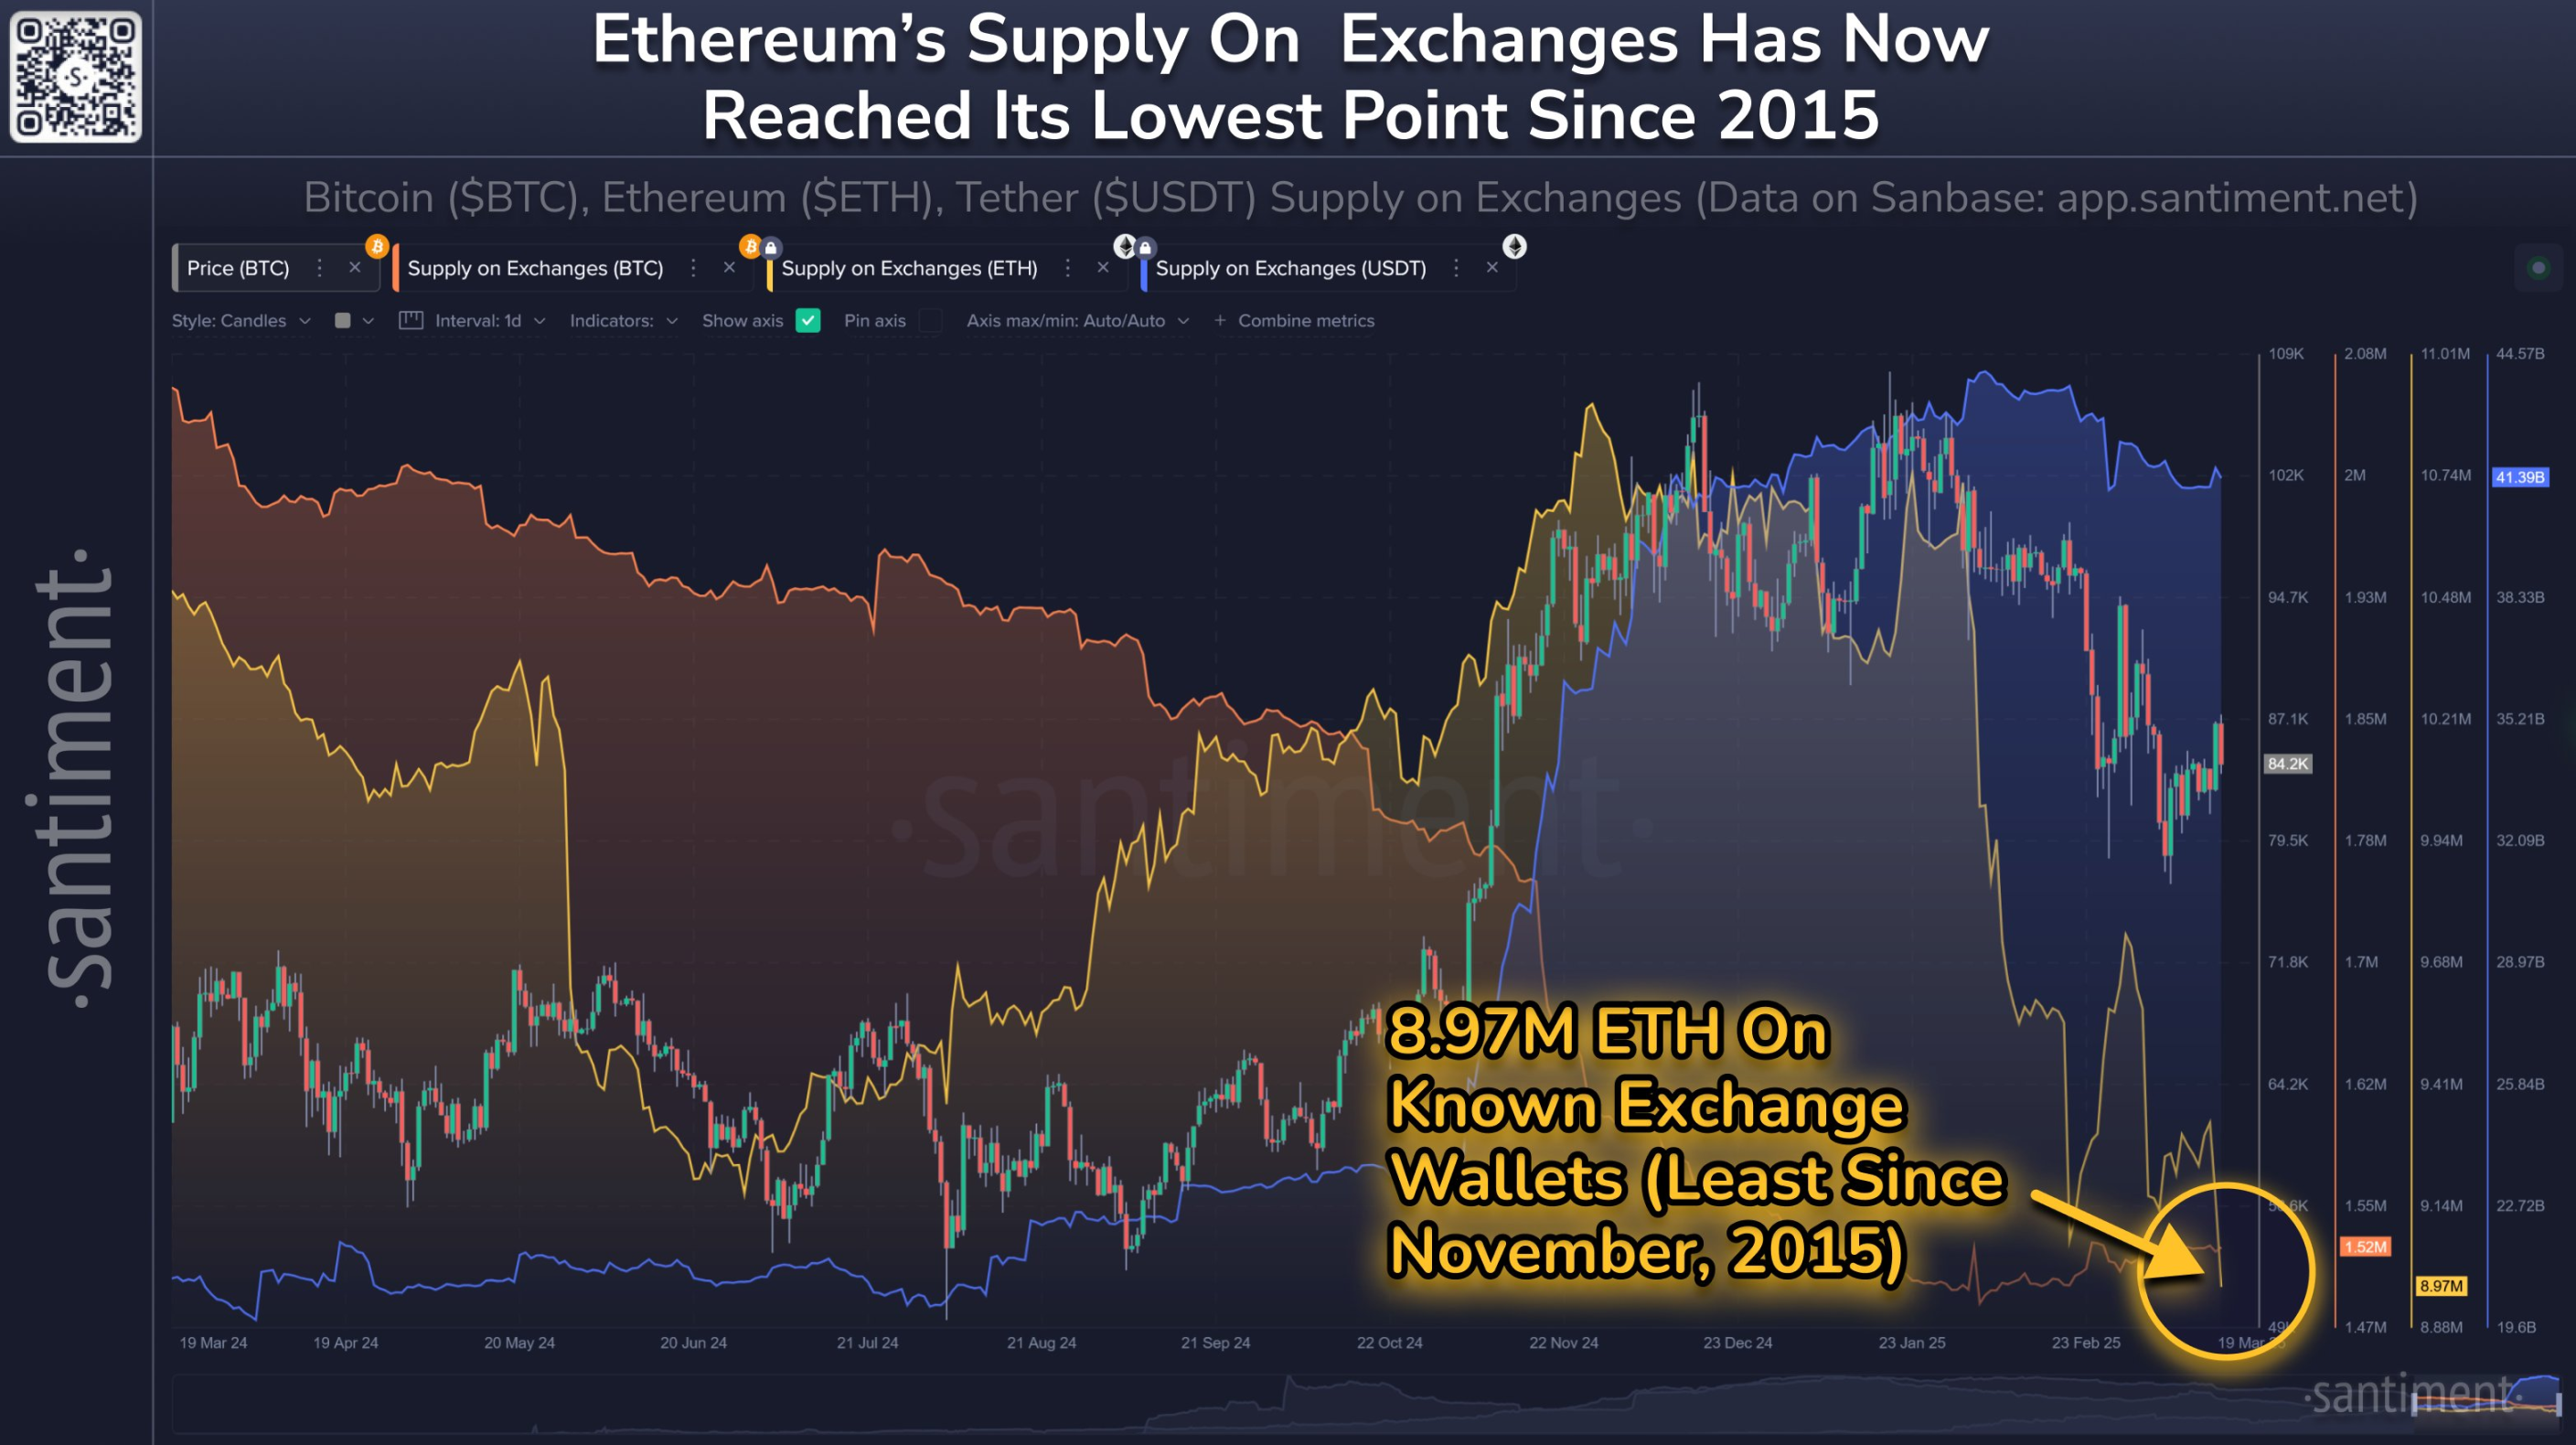
According to data from cryptocurrency market analysis firm Santiment, due to the appeal of DeFi protocols and staking products, the available ETH supply on exchanges has dropped to 8.97 million (equivalent to $1.78 billion at current prices, accounting for less than 7.5% of Ethereum's current market cap), the lowest level in nearly a decade (the previous low was in November 2015). Compared to just seven weeks ago, the ETH on trading platforms has decreased by 16.4%.
The drop in Ethereum's exchange supply to a near 10-year low indicates a significant tightening of market liquidity. A lower exchange supply means less ETH available for sale in the market, reducing potential selling pressure, but it also makes prices more susceptible to large trades, increasing volatility.
However, from the current state, although the decrease in exchange supply shows that the asset locking effect is strengthening, the overall market environment and multiple factors still exert downward pressure on prices. The current uncertainty in the macroeconomic environment, the shift in market risk appetite, and the withdrawal of some institutional funds have all contributed to further tightening of market liquidity.
At the same time, volatility in the DeFi space and the development of competitive public chains have also negatively impacted market expectations for Ethereum. In this context, although the lower exchange supply reduces potential selling pressure, the adverse factors of overall market sentiment and external environment continue to push prices downward.
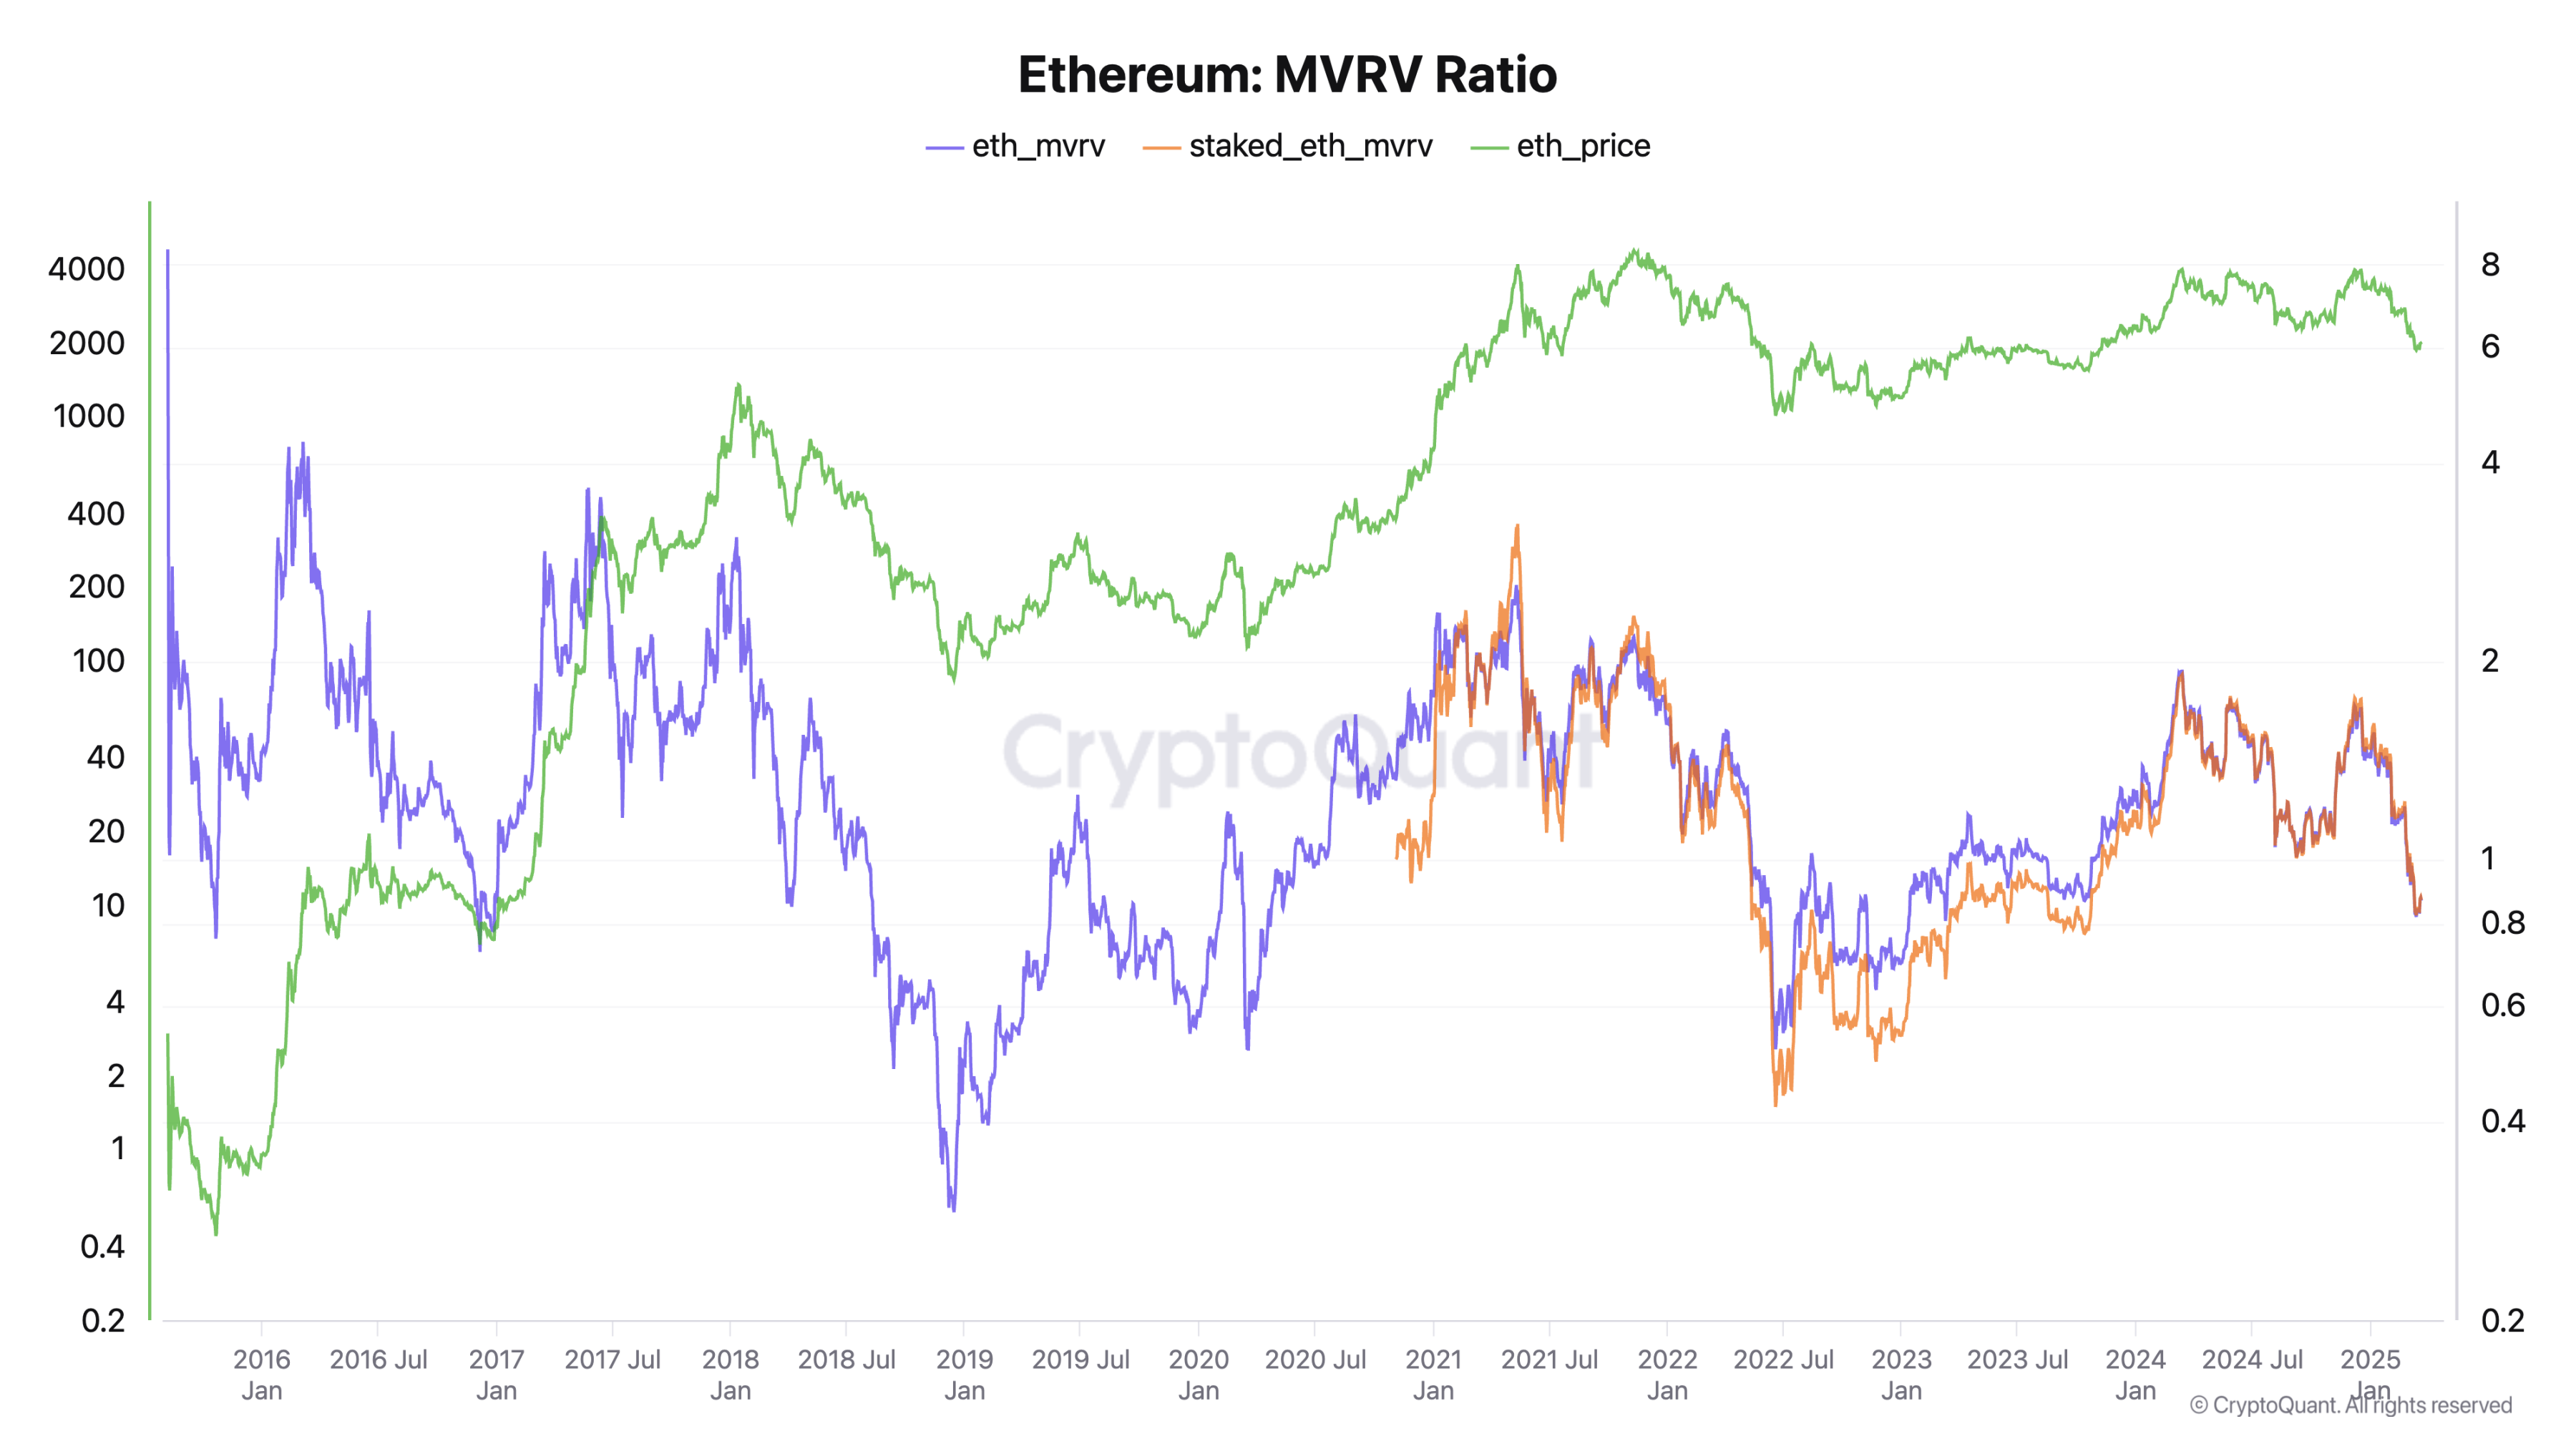
If we assess the current state using indicators, data from IntoTheBlock shows that ETH's MVRV (Market Value to Realized Value ratio) has currently dropped to around 0.8. This level is uncommon in Ethereum's history, typically occurring during bear markets.
MVRV is usually used to compare the "relationship between a token's market value and realized value," reflecting the supply-demand relationship of a particular token in the market and monitoring the extent to which the current market price of this token is undervalued or overvalued. It is also used to identify the current market top or bottom for this token.
Summary
Looking back at history, Bitcoin experienced a phase of correction before a surge in October 2023. Whether the current market is repeating a similar pattern remains to be seen. Analysts like Ki Young Ju, founder and CEO of CryptoQuant, have suggested that the bull market cycle may be nearing its end in the short term, with prices more likely to exhibit bearish or sideways trends in the next 6 to 12 months.
However, the Federal Reserve has recently signaled a shift towards a more accommodative monetary policy, and expectations of an end to quantitative tightening and a potential restart of quantitative easing have also led to some liquidity entering the market. BitMEX co-founder Arthur Hayes tweeted, "Powell has delivered on his promise; quantitative tightening (QT) essentially ends on April 1. To truly drive the market into a bull run, either the supplemental leverage ratio (SLR) exemption policy needs to be restored, or quantitative easing (QE) needs to be restarted. $77,000 may be the bottom for Bitcoin, but the stock market may need to experience some turbulence before Jay (Powell) fully aligns with the Trump team. So, everyone should stay flexible and keep cash on hand."
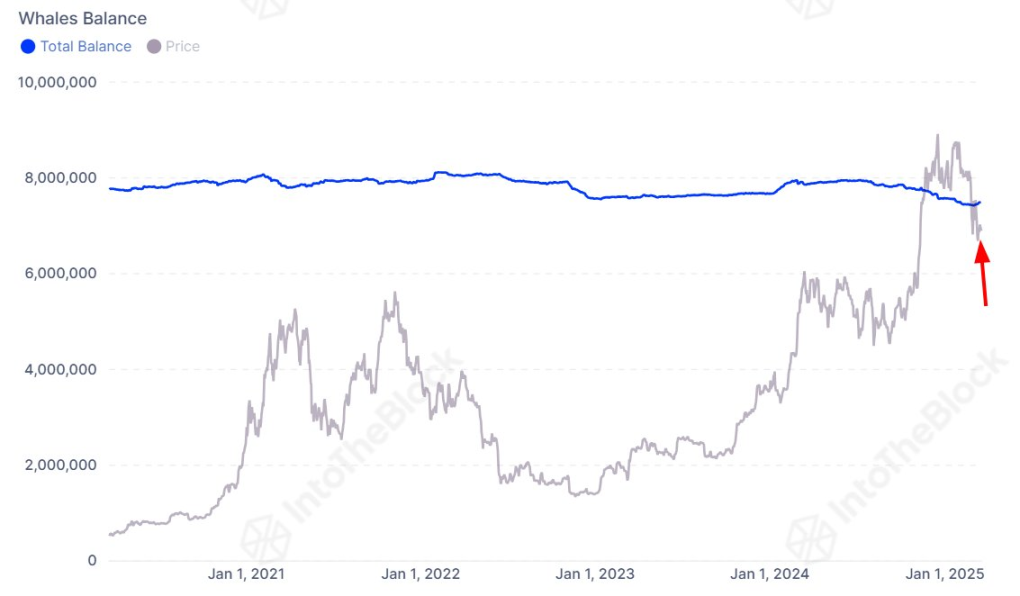
In this environment, the market's bottom and subsequent reversal remain uncertain, and investors need to closely monitor changes in overall market liquidity, on-chain fund flows, and the behavior of institutional whales. For example, IntoTheBlock has detected that although the balances of Bitcoin whales have been continuously declining over the past year, data from March suggests a potential reversal. Currently, whale holdings have increased by about 62,000 BTC since the beginning of this month, indicating signs of re-accumulation.
Overall, the current market is undergoing a transition from a high-risk, high-volatility bull market to a low liquidity, risk-averse situation. In the short term, market sentiment leans towards pessimism, with insufficient capital inflows and unwinding of arbitrage trades continuing to exert downward pressure on prices; however, the stability of long-term holders and the re-accumulation by some whales may provide necessary support for the market in the future.
免责声明:本文章仅代表作者个人观点,不代表本平台的立场和观点。本文章仅供信息分享,不构成对任何人的任何投资建议。用户与作者之间的任何争议,与本平台无关。如网页中刊载的文章或图片涉及侵权,请提供相关的权利证明和身份证明发送邮件到support@aicoin.com,本平台相关工作人员将会进行核查。


