A person's self-discipline hides infinite possibilities; the degree of your self-discipline determines the height of your life.
There are no shortcuts in life, but every step you take counts.
The more diligent, the more effort; the more self-disciplined, the more excellent. I am Zhou Yueying, focusing on the trend analysis of mainstream coins, providing insights based on my own technical analysis of the market.
Here at Yueying, the strategy only includes precise points, with no ambiguous ranges or nearby areas. Friends who like Yueying can click to follow. Let's see today's sharing!
The market is slow on Saturday; the current price of long positions has some space. The short-term strategy for Bitcoin continues to refer to the previous text, and today I will share some short-term thoughts on altcoins.
SOL Technical Analysis————
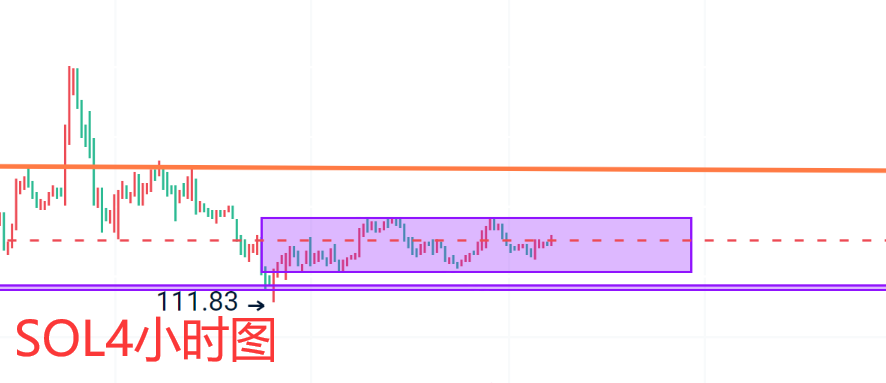
Looking at the daily chart of Solana, the market is blocked around the middle track. The Bollinger Bands are narrowing, with the MACD fast and slow lines crossing upwards, the volume bars increasing, and the KDJ turning downwards. The VR indicator is consolidating around the 120 value. On the 4-hour chart, the candlestick is moving within a range. If the upper edge can break through, we can look at the resistance around 145-150. In the short term, treat it as a range; the upper resistance to watch is around 135-136, and the lower support is around 123-121. If it effectively breaks below 120, then we need to pay close attention to the strong support range of 115-110. If this level is lost, it will accelerate downwards. In the short term, refer to the support and resistance for entry, and observe the key points provided.
XRP Technical Analysis————
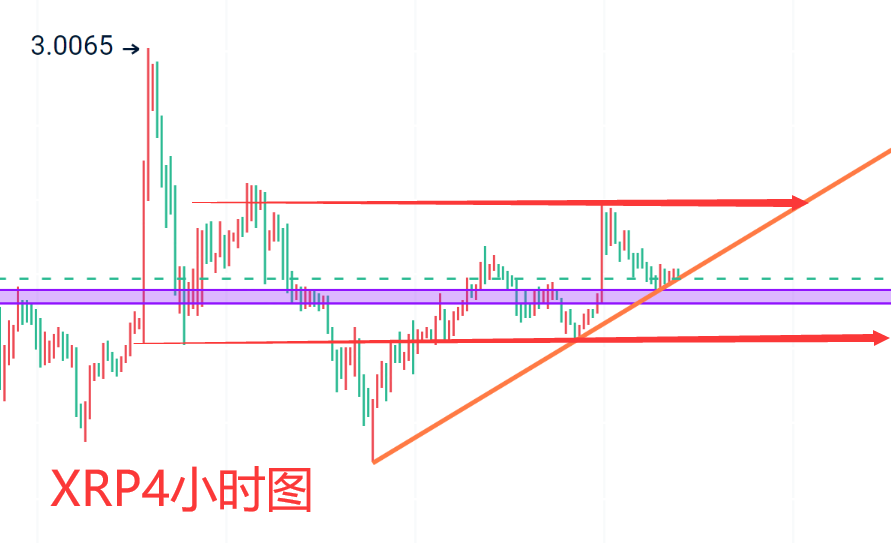
The previous short post on Ripple's trend basically met expectations. Currently, the overall structure is running within a large range, with the upper edge around 2.8 and the lower edge around 2.0. The current price is in the middle of this large range. The 4-hour candlestick structure shows a pullback to the short-term upward trend line, so in the short term, we can first focus on the support around the trend line, which is 2.35-2.3. If it breaks, then pay attention to the support around 2.25-2.23. The upper resistance to watch is 2.58-2.6; if it breaks through, then look at the key resistance level at the upper edge of 2.8. In the short term, refer to the support and resistance for entry until the structure is broken and adjustments are made.
ORDI Technical Analysis————
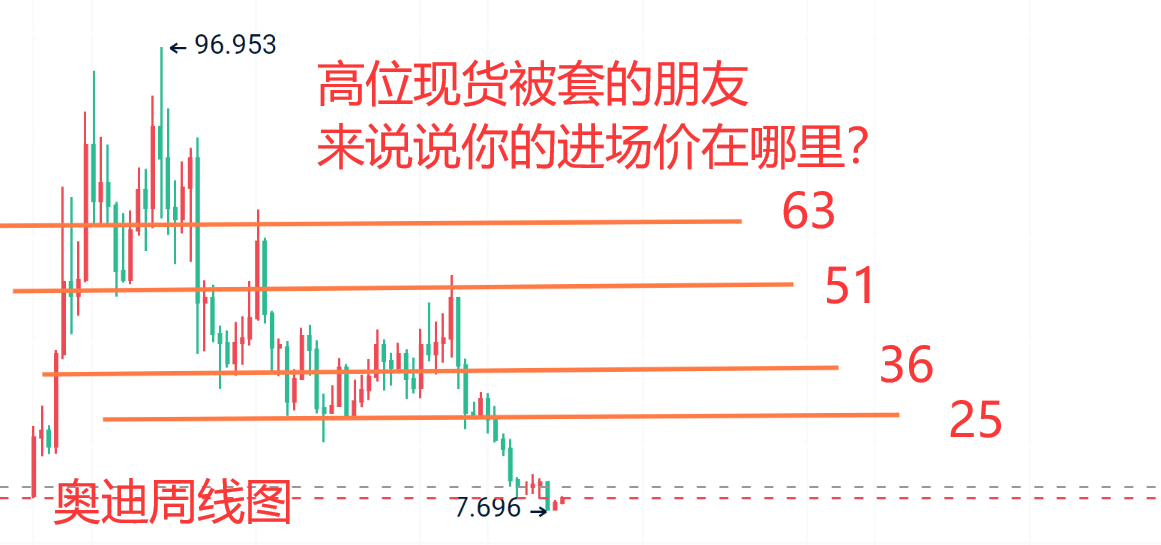
In the previous article about Audi, it was mentioned that if it loses the $10 level, it will test the $7-6 range. The market tested around $7.6 and rebounded, currently returning above $10. The key level of $10 has been broken, and there are suspicions of hitting stop-loss orders below $10. The overall harvesting of Audi is still quite aggressive; those who are stuck at high prices in the spot market are reluctant to cut losses and can only hope for the next cycle. This cycle is quite painful, but there is still a certain probability. In the short term, the resistance to watch is at $10.8 and $11.8, with a major resistance area around $13-14. The short-term support to focus on is at $8.8 and $8.3.
BNB Technical Analysis————
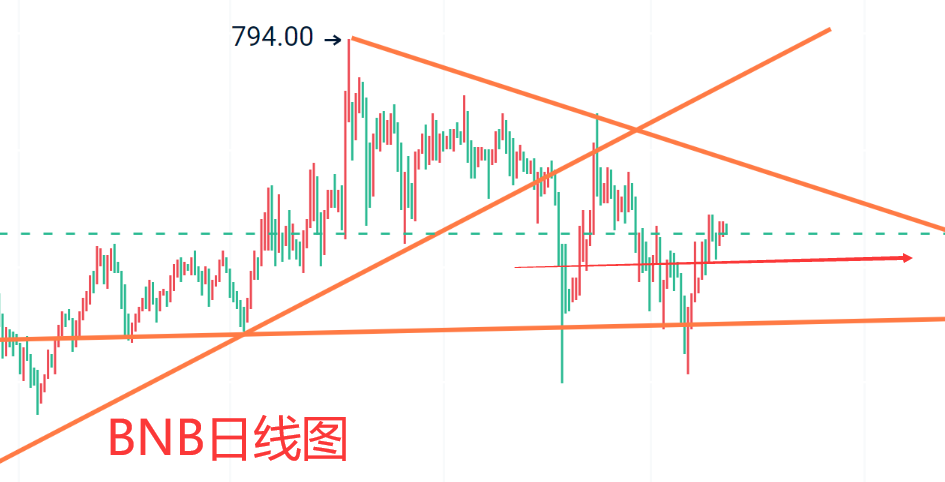
From the candlestick perspective, Binance Coin has strong support around $500. If you want to participate in platform coins for the long term, pay more attention to the development of the platform. From a technical perspective, the weekly chart is favorable for bulls. In the short term, the upper resistance to watch is at $650 and $680, while the short-term support to focus on is around $608-600, followed by $580-570. Pay attention to the short-term key point around $550; if it is lost, it is highly likely to test the $500 level again. For short-term operations, refer to the above resistance and support for entry.
ADA Technical Analysis————
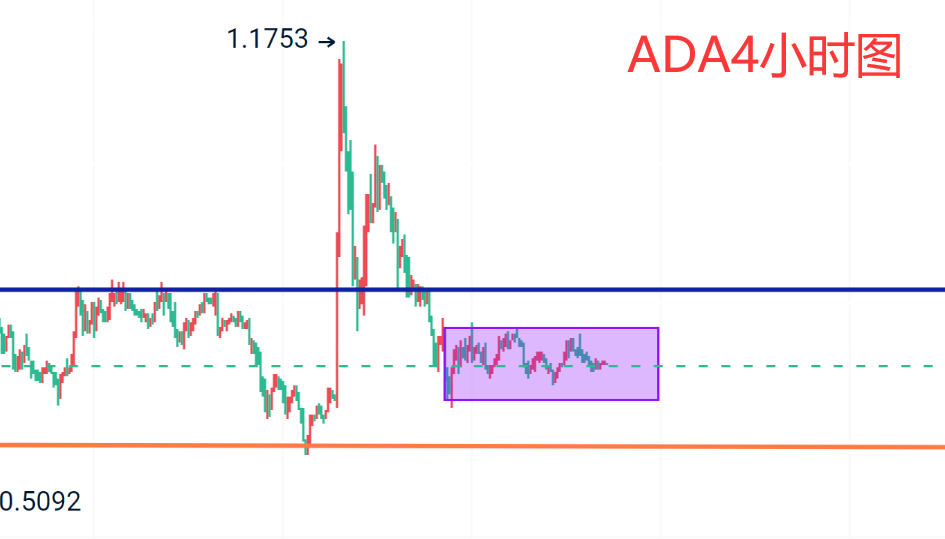
Ada and Ripple's short posts are sometimes updated, and the overall trend is within expectations, with participants achieving certain results. Currently, the candlestick pattern is moving within a range, with the upper edge at $0.75-0.77 and the lower edge at $0.68-0.65. In the short term, focus on the resistance and support at the upper and lower edges. If it breaks upwards, pay attention to the resistance around $0.81-0.83; if it breaks down, focus on the support around $0.6-0.58. These support and resistance points have also been mentioned frequently recently, so continue to refer to the corresponding prices.
——I am Zhou Yueying, a teacher focused on technical analysis. Friends who have any questions about operations or trends can communicate and learn with me! Let's share and profit together!
There may be delays in article publication and review; the market changes rapidly, and the above suggestions are for reference only, with risks borne by the individual! The market changes daily, and what I can do is use my years of practical experience to provide some slight assistance, guiding your investment decisions and management towards the right direction. Meeting is fate; I am a person who believes in fate. If you have any doubts in the crypto world, you can follow Zhou Yueying more; I believe it will be helpful to you.

免责声明:本文章仅代表作者个人观点,不代表本平台的立场和观点。本文章仅供信息分享,不构成对任何人的任何投资建议。用户与作者之间的任何争议,与本平台无关。如网页中刊载的文章或图片涉及侵权,请提供相关的权利证明和身份证明发送邮件到support@aicoin.com,本平台相关工作人员将会进行核查。


