The cost of acquiring a single wallet is closely related to market cycles, geographic regions, and the effectiveness of marketing activities.
Written by: Asaf Nadler, COO of Addressable
Translated by: Luffy, Foresight News
About a month ago, I published an article on "Cost Per Wallet" (CPW) here. This growth metric unique to the Web3 space measures the acquisition cost of website visitors who have installed a wallet in their browser.
The article received a very enthusiastic response. Marketers, advertising agencies, and project founders joined the discussion, sharing their thoughts, challenges, and data points. One thing was very clear: CPW struck a chord with everyone. Among the many private messages and replies, one question stood out:
"Tell me about the costs; what are the situations like in specific times, regions, and platforms? Does success change the way costs are calculated?"
This article will answer that question with detailed data. I analyzed over 200 programmatic advertising campaigns initiated by more than 70 advertisers on the Addressable platform in 2024, targeting over 1.5 million users worldwide, to study CPW across different market cycles, regions, execution conditions, and audience segments.
2024 CPW Trends: How Market Cycles Affect Costs?
Bull and Bear Cycles: 2024 experienced two distinctly different market cycles. At the beginning of the year, the market performed strongly, with the first quarter in a bull market, and the total cryptocurrency market cap grew by 21% to $1.7 trillion. However, this momentum reversed in the second quarter, declining by 12%, and the situation worsened further in the third quarter, with a 27% drop. By the fourth quarter, the market rebounded strongly, with a 109% increase, entering another bull market phase. These market changes naturally affected CPW, but the impact was not uniform.
The fluctuations of CPW across different market cycles reveal more than just the expected pattern of lower costs in bull markets and higher costs in bear markets. It also highlights the sensitivity of different regions to market fluctuations, the importance of timing, and the strategic advantage of targeting resilient markets.
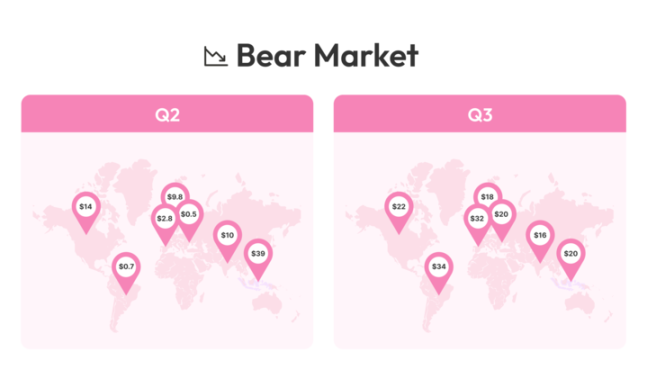
Developed Markets: Developed markets like the U.S. and Western Europe often provide more predictable CPW during bull phases, but they also exhibit significant elasticity. In the first quarter, the CPW in the U.S. remained at $5.87, but as market sentiment shifted in the third quarter, costs skyrocketed nearly fourfold to $22.81. Western Europe showed a similar pattern, with fluctuations even more dramatic, soaring from $1.18 to $32.79, a 27-fold increase. While these markets can offer scale and quality during bull markets, costs significantly increase when market sentiment turns bearish, reducing their sustainability during downturns.
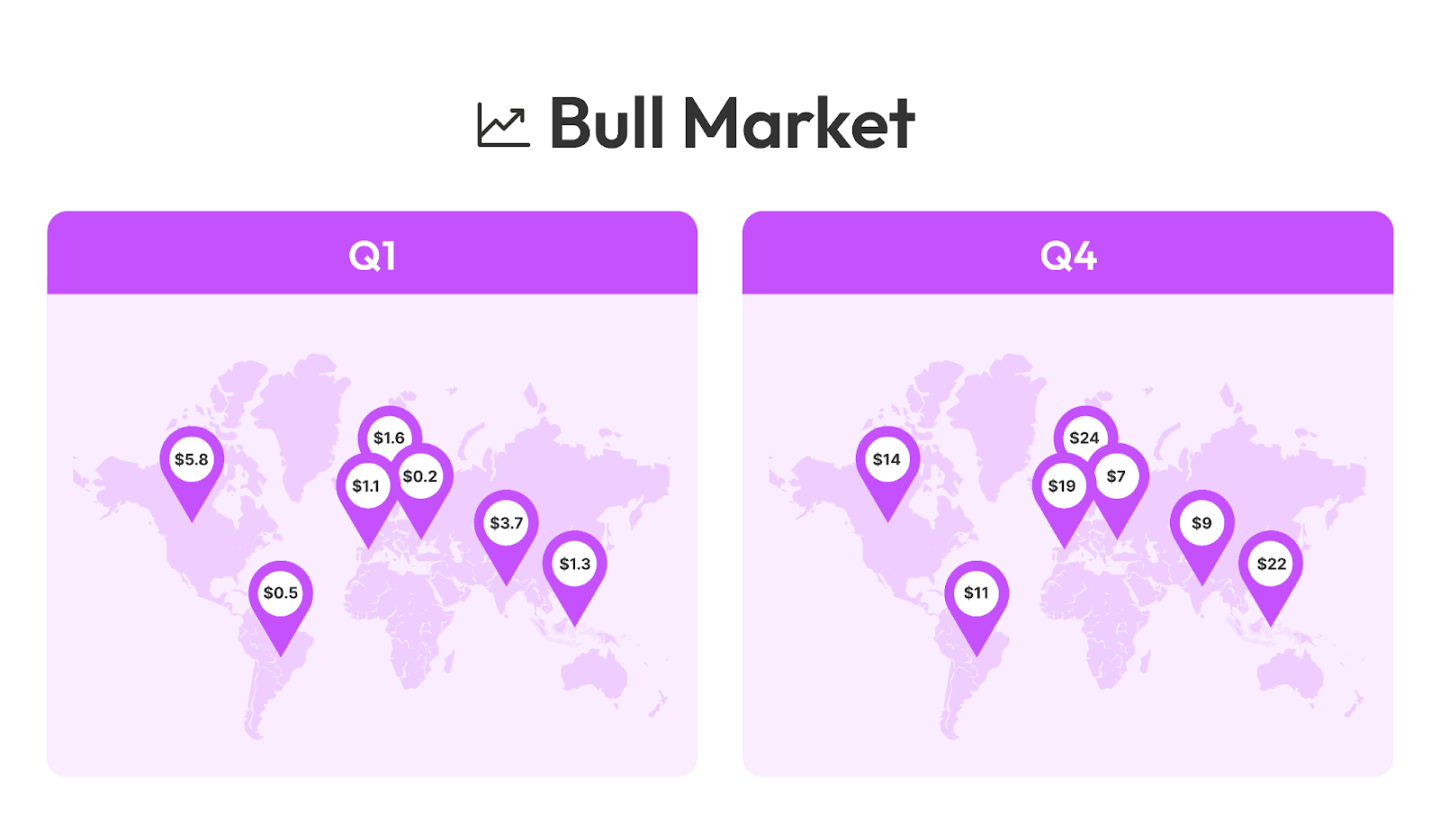
Emerging Markets: These markets exhibit different risk-return profiles. Under favorable conditions, their CPW is extremely low, but cost fluctuations can be extreme. For example, in Latin America, the CPW in the first quarter was nearly free at $0.56, but by the third quarter, costs surged 60 times to $34.38, reflecting sudden liquidity constraints and changes in demand. Eastern Europe saw even more astonishing increases, with CPW soaring from $0.21 to $20.79, a 99-fold rise, indicating that costs can spike dramatically when market conditions worsen.
Southeast Asia: This region performed the most robustly across various market cycles, with CPW fluctuations within a factor of 5, from $3.73 in the first quarter to $16.61 in the third quarter. This stability suggests that local market factors, adoption curves, or advertiser demand may create a more predictable environment, making it an attractive region for brands looking to maintain stable costs under different macro conditions, especially for projects wanting to test product usage without being affected by market cycles.
The key point is that market cycles not only affect CPW but also determine when and where it is feasible to attract wallet holders. While developed regions are highly efficient during bull markets, costs are high during downturns. Emerging markets have extremely low costs but come with significant volatility. Southeast Asia, with its relative stability, may offer the best long-term potential for brands looking to reduce risk across different market cycles.
Best and Worst Performing Marketing Campaigns' CPW
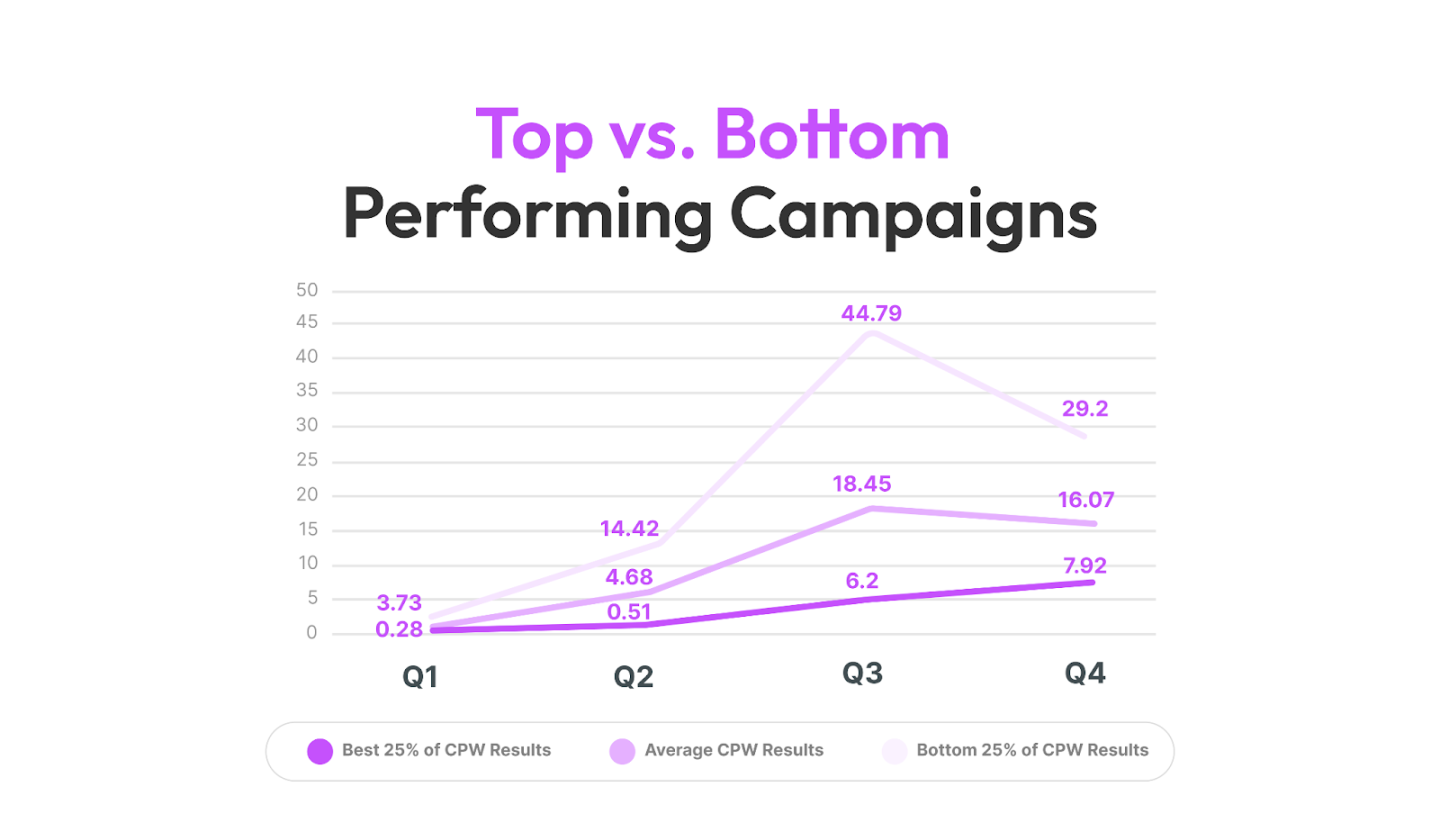
Market cycles are not the only factor. The best-performing marketing campaigns consistently maintain a low CPW, even during market downturns. In fact, the top 25% of marketing campaigns managed to keep their CPW at just $6 - $8 per wallet, even during bear market cycles, which is impressive. Meanwhile, the poorer-performing campaigns saw their CPW fluctuate between $4.68 and $44.79.
This performance gap can be attributed to product-market fit (PMF), community strength, market heat, incentives, and creative execution. Campaigns that resonate well with their audience and have optimized messaging can maintain an acceptable CPW regardless of market conditions.
For campaigns struggling with high CPW, shifting to lower-cost regions is not the only solution. Optimizing target audience segmentation, messaging, incentives, and creative strategies can enhance efficiency, keeping CPW stable in any market.
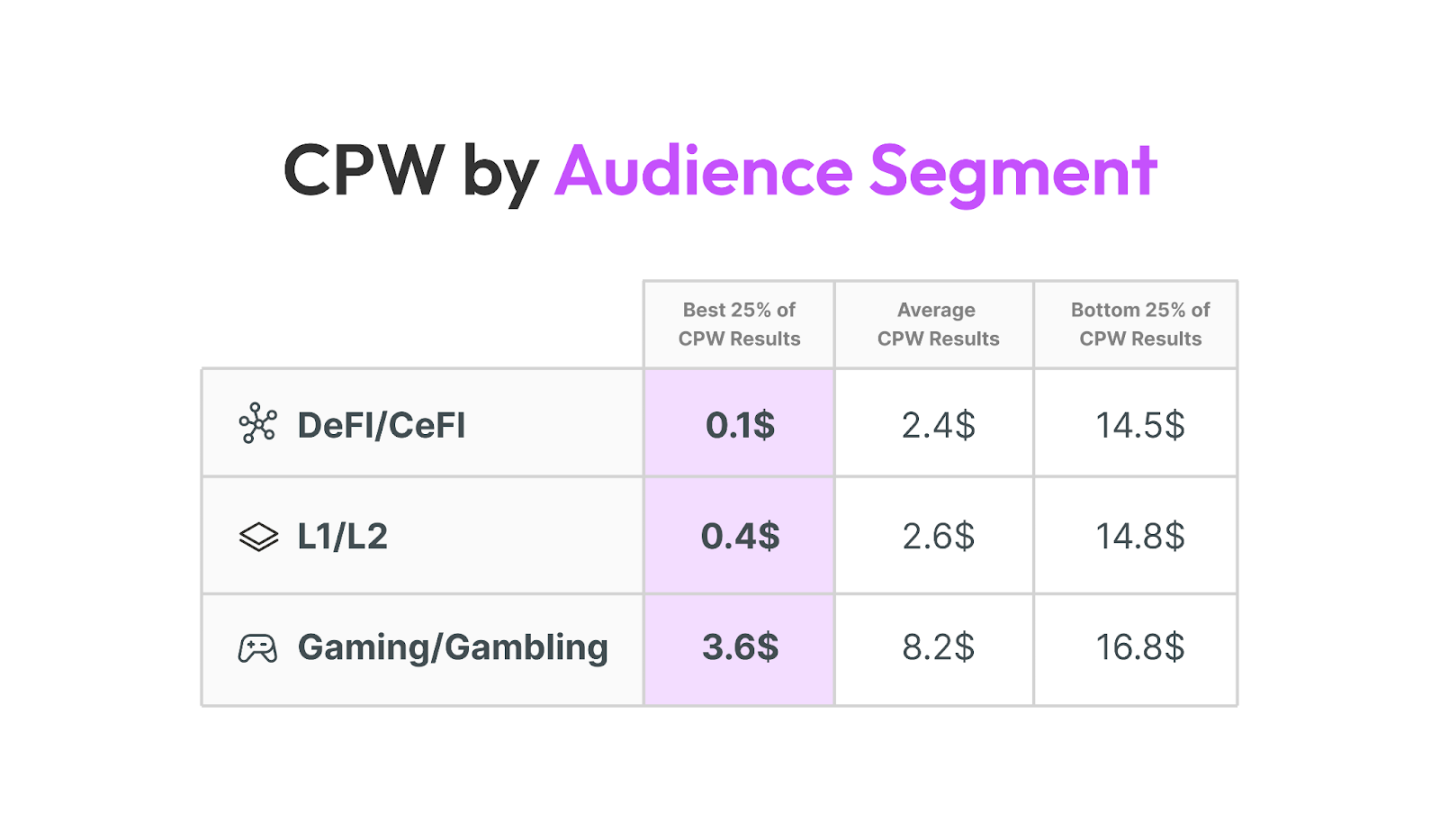
CPW by Audience Segmentation
Decentralized Finance (DeFi) and Centralized Finance (CeFi) marketing campaigns are the most cost-effective, with a median CPW of $2.79 and a lower quartile of just $0.10. L1/L2 projects follow closely, with a median CPW of $3.23, reflecting their higher adoption rates.
Gaming and gambling marketing campaigns have the highest costs, with a median CPW of $8.74 and a lower quartile of $3.40, possibly due to high user churn rates, frequent speculative behavior, and intense competition. If Web3 gaming is indeed "unstoppable," we need to find a more robust user acquisition engine to make it sustainable like Web2 gaming.
Conclusion: Using CPW as a Framework for Web3 Growth
CPW is not solely determined by market cycles; it is also influenced by the effectiveness of marketing campaign execution. The top 25% of marketing campaigns can maintain a CPW of $6 - $8 throughout the year, even during market downturns, while the poorer-performing campaigns see their CPW fluctuate significantly from $4.68 to $44.79. This proves that market conditions are not an excuse; marketing teams that track data, optimize audience targeting, and continuously refine messaging and incentives can outperform market cycles; regardless of macro trends, they can maintain efficient costs.
This also prompts us to shift strategies when launching products. Targeting large investors in the U.S. during a bear market is an extremely costly gamble, with CPW reaching unsustainable levels. In contrast, starting from more stable and cost-effective regions like Southeast Asia allows brands to optimize their product-market fit before expanding into developed markets. Teams that do not adopt this strategy risk exhausting their budgets too early before proving market demand and optimizing conversion rates.
Finally, the data derived from advertising-driven marketing activities challenges the notion that Web3 advertising is "unworkable." In fact, these results indicate that advertising-driven Web3 growth is measurable and scalable, rather than a dead end.
免责声明:本文章仅代表作者个人观点,不代表本平台的立场和观点。本文章仅供信息分享,不构成对任何人的任何投资建议。用户与作者之间的任何争议,与本平台无关。如网页中刊载的文章或图片涉及侵权,请提供相关的权利证明和身份证明发送邮件到support@aicoin.com,本平台相关工作人员将会进行核查。


