
Overnight, the US stock market rebounded as expected. In yesterday's post, I also mentioned that the Asian and European markets were rising, and the US market opened with a rebound, so I felt there was a chance for the US market to rebound as well. The Nasdaq closed up 2.61%, the Dow Jones up 1.65%, and the S&P 500 up 2.13%. Bitcoin also broke upward after a spike and then retraced.
The three major US stock indices are in a downward rebound wave B, with a chance to test the rising trend line before continuing to decline. The Dow Jones has completed a deep-sea crab rebound, and all three indices have dropped to the MA60 on the weekly chart, presenting an opportunity for a rebound. Therefore, since the 11th, I have been reminding to look for short-term rebounds after the second test of the breakdown.
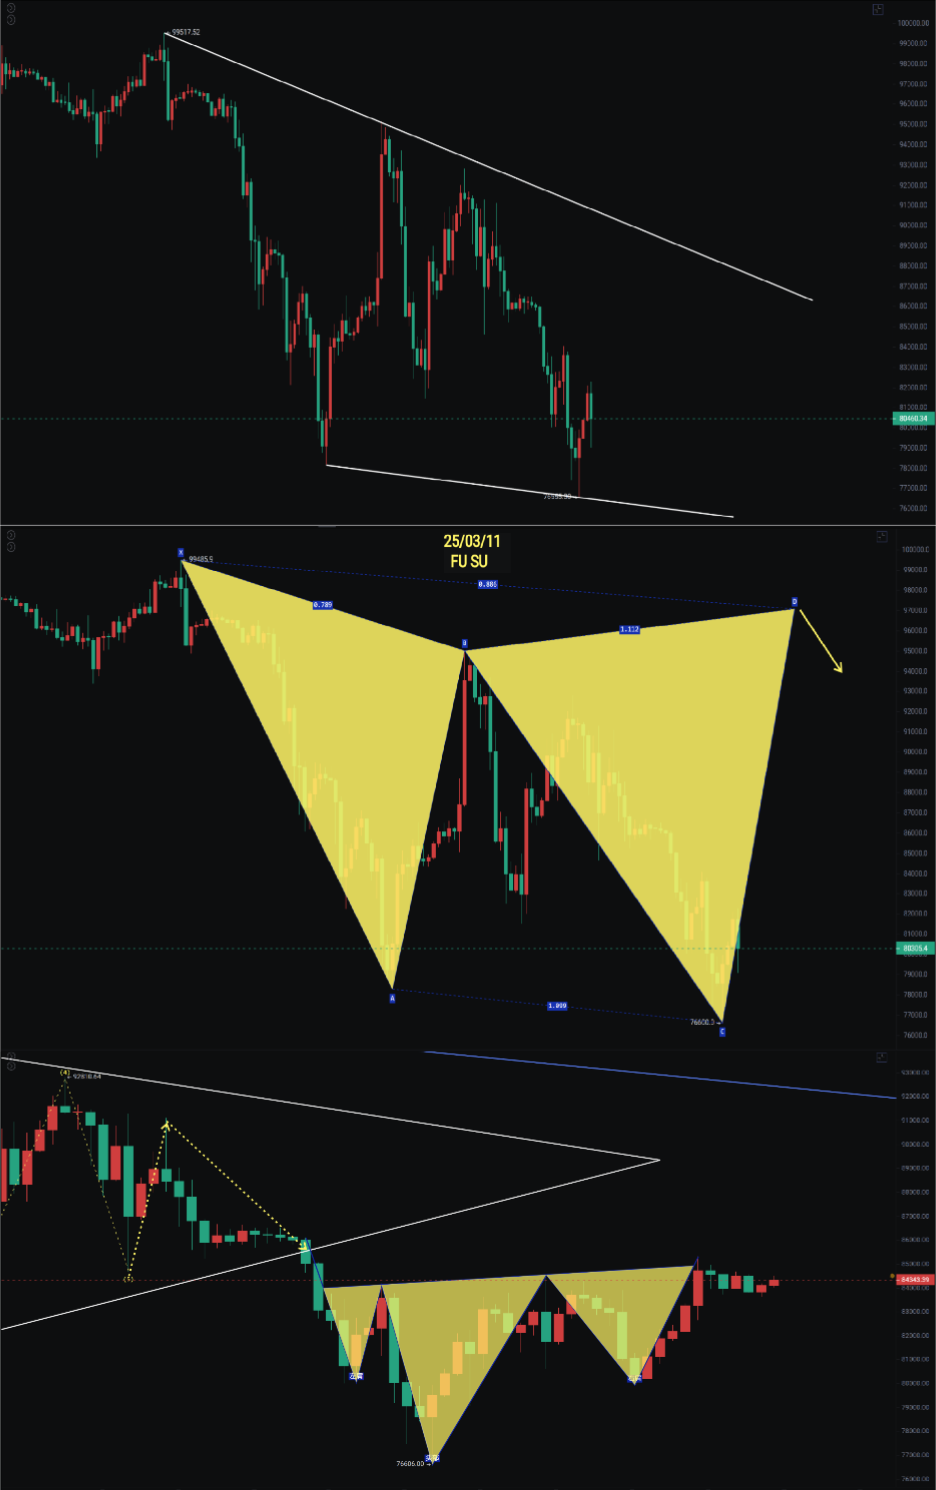
Bitcoin
The daily chart has broken above the MA200 and is retracing today. The MACD continues to show a bottom divergence, and the histogram has crossed the zero axis. On the 4-hour chart, I mentioned on the 11th that a descending wedge and a potential shark pattern had appeared. Last night, the 4-hour head and shoulders bottom pattern spiked and retraced, and we continue to wait for a rebound breakthrough.
The first target for the shark pattern is 87,500, and the second target is 97,000. Continue to pay attention to the market trends.
Support: Resistance:
Ethereum is still in a narrow range of fluctuations, with not much to say, still oscillating below 1,963. Pay attention to future opportunities for a catch-up rally.
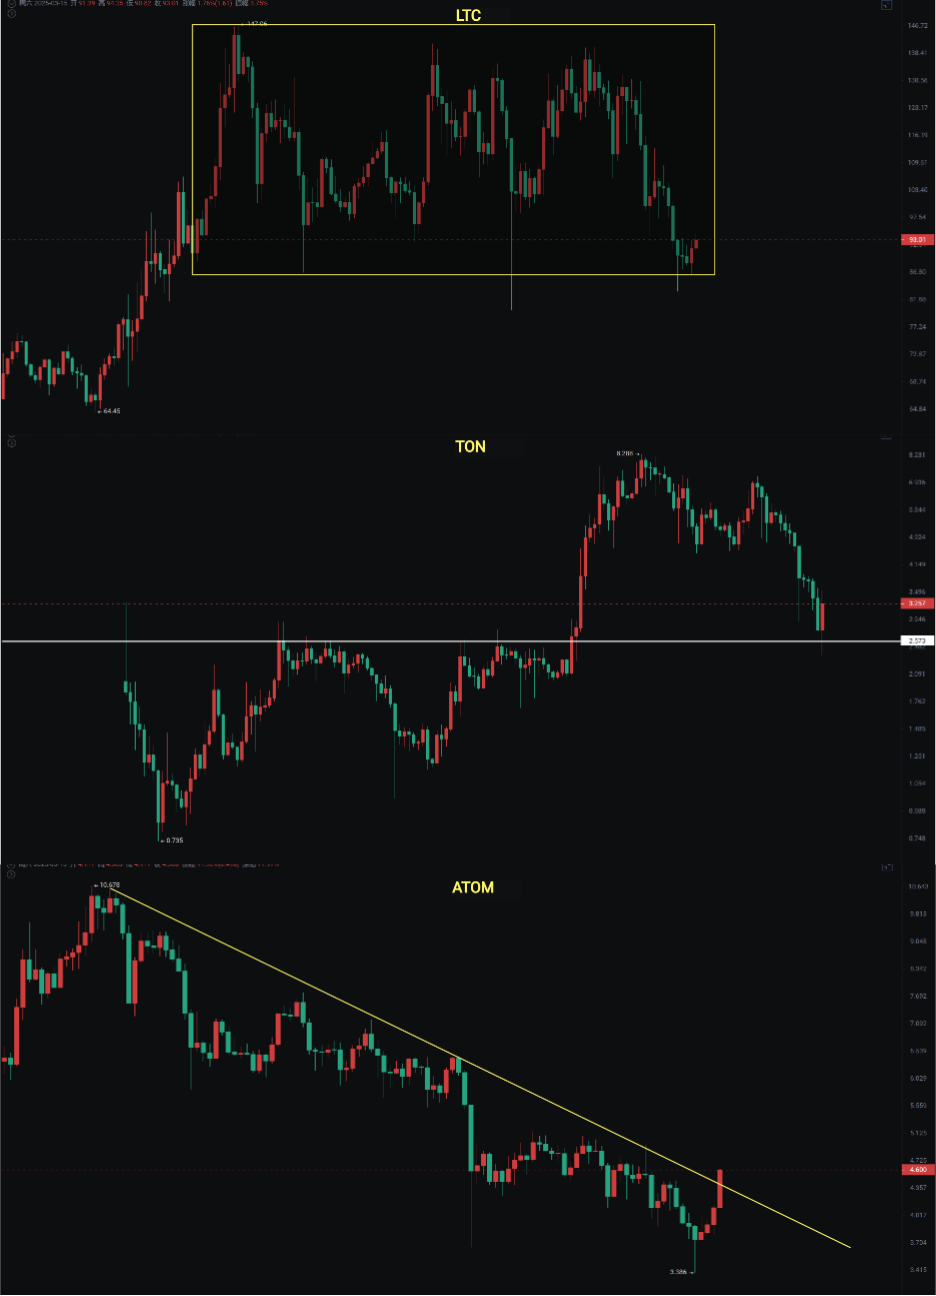
Still, pay more attention to altcoins that show opportunities. Some of the ones I mentioned yesterday, apart from ID, which has shown a short-term pullback, are still within expectations. LTC: The daily chart is oscillating within a box and is currently at the bottom of the box. If it spikes without breaking, continue to look for a rebound.
TON: Following the news that founder Pavel Durov has left France and moved to Dubai after receiving approval from a French court, there has been a short-term rebound. The weekly chart is also retracing to the previous breakout platform support.
ATOM: The daily chart has re-tested and closed back, breaking above the BOLL middle band and the descending trend line. Only small-level pullbacks can be entered; do not chase. The first resistance is at 5.1, and the second resistance is at 6.1.
If you like my views, please like, comment, and share. Let's navigate through the bull and bear markets together!!!
The article is time-sensitive and for reference only, updated in real-time.
Focusing on K-line technical research, sharing global investment opportunities. Public account: Trading Prince Fusu

免责声明:本文章仅代表作者个人观点,不代表本平台的立场和观点。本文章仅供信息分享,不构成对任何人的任何投资建议。用户与作者之间的任何争议,与本平台无关。如网页中刊载的文章或图片涉及侵权,请提供相关的权利证明和身份证明发送邮件到support@aicoin.com,本平台相关工作人员将会进行核查。


