Master Discusses Hot Topics:
In the past few days, Master has noticed that everyone is still discussing whether the current market is a rebound or a reversal. To put it simply, a rebound is just a small splash on the way down, lively for a moment and then gone. A reversal, on the other hand, opens up a whole new story.
So what is the situation now? Personally, Master still believes that the conditions for a reversal have not yet come together. The recent decline in U.S. stocks and Bitcoin is mainly due to concerns about economic recession, soaring inflation, and the turmoil caused by the trade war. Until these major issues are resolved, a reversal is likely to take some time.
Now, let's talk about recession expectations. The GDPNow data on GDP growth rate is quite alarming, still at -2.4% as of now, which is unsettling to hear.
Although the former U.S. Treasury Secretary has stated that there is no basis for calling a recession now, he also admits that the recent drop in U.S. stocks is largely due to Trump's aggressive trade policies.
Therefore, whether it’s the shadow of recession, the chaos of the trade war, or the possibility of rising inflation, these are the main reasons why the risk market is struggling to climb.
Returning to Bitcoin, although some friends believe that the recent rise indicates a shift in sentiment, Master sees it merely as a rebound. As a result, when the decline returned, those who were shouting to buy the dip became anxious again. This is true not only for Bitcoin but also for U.S. stocks.
Last night’s drop wiped out all the gains made during the day. Why? Because the confidence for a reversal simply isn’t there. Just look at the turnover data, and you’ll understand that the main sellers are still those short-term dip buyers.
Early investors, even if they are at a loss, haven’t really run away; this is just the process of short-term players passing their chips to long-term players. In the current situation, the main issues are still inflation and recession expectations causing trouble.
Master has seen some say that a drop in inflation is actually a result of recession expectations, so even if the CPI and PPI data look decent, investors are still on edge. Coupled with the tariff policies and the ongoing Russia-Ukraine situation, the market is understandably cautious.
Overall, the timing for a reversal is still not ripe. Investor confidence is lacking, and after the U.S. stock market opened, it plummeted, erasing all of yesterday's gains. So let’s take it easy and not rush to look for a reversal just yet.
Master Looks at Trends:
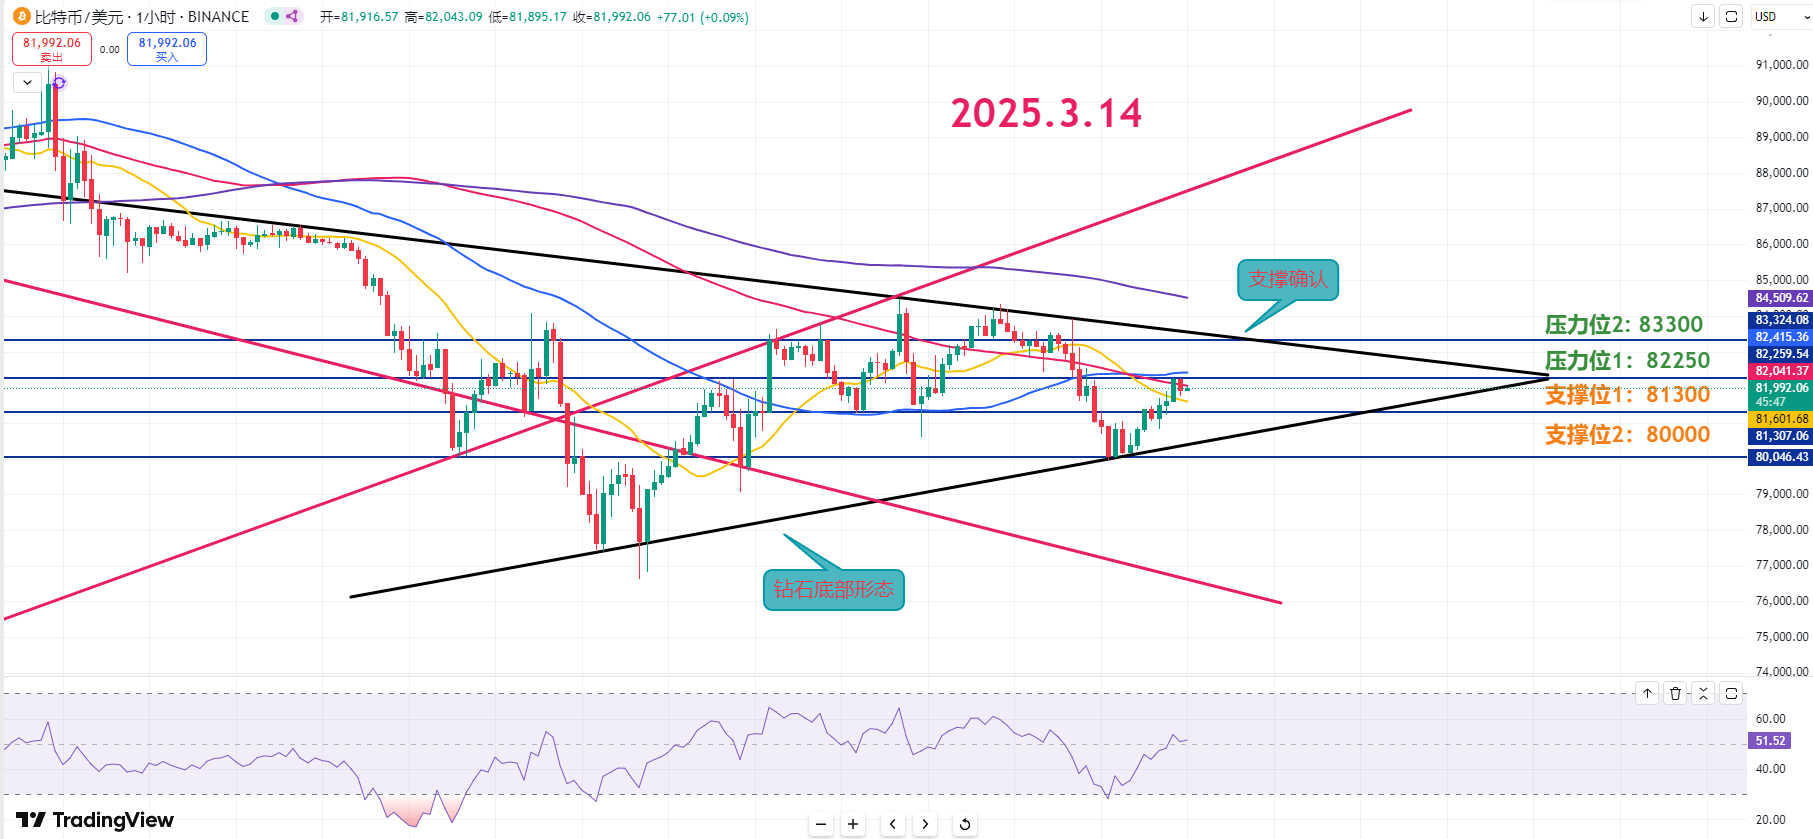
Resistance Levels Reference:
First Resistance Level: 83300
Second Resistance Level: 82250
Support Levels Reference:
First Support Level: 81300
Second Support Level: 80000
Today's Suggestions:
Currently, a diamond bottom pattern has formed on the hourly chart. It is recommended to watch whether the price breaks through the descending trend line to confirm the formation of an upward trend. Even if there is continued selling pressure during the day, as long as the previous low of 77.5k is maintained, there are still positive signals in the long term.
At this stage, it is expected that the price will test the first resistance level around 82.2k again. If it breaks through, a rebound to the strong resistance at 83.3k can be anticipated.
The 83.3k level is currently a strong resistance level, coinciding with the descending trend line. If it successfully breaks through and trading volume gradually increases, there may be a strong upward movement during the next test.
The first support at 81.3k is a key short-term support level to maintain the rebound trend, so it can be set as an important level. If there is an adjustment during the day, it can be seen as a reasonable retracement range and also a short-term entry opportunity.
The second support is the low point from yesterday, and 80k is also a psychological barrier. As long as it does not fall below 80k, the rebound view can continue; however, if it deviates from the upward trend before reaching 80k, it may trigger disappointing sell-offs, leading to further bearish pressure.
3.14 Master’s Band Trading Setup:
Long Entry Reference: Light long in the 80000-80888 range, Target: 82250-83300
Short Entry Reference: Light short in the 82250-83300 range, Target: 81300-80000
This article is exclusively planned and published by Master Chen (public account: Coin God Master Chen). For more real-time investment strategies, solutions, spot trading, short, medium, and long-term contract trading techniques, operational skills, and knowledge about candlesticks, you can join Master Chen for learning and communication. A free experience group for fans and community live broadcasts are now available!

Friendly Reminder: This article is only written by Master Chen on the official account (as shown above). Any other advertisements at the end of the article and in the comments section are unrelated to the author!! Please be cautious in distinguishing authenticity. Thank you for reading.
免责声明:本文章仅代表作者个人观点,不代表本平台的立场和观点。本文章仅供信息分享,不构成对任何人的任何投资建议。用户与作者之间的任何争议,与本平台无关。如网页中刊载的文章或图片涉及侵权,请提供相关的权利证明和身份证明发送邮件到support@aicoin.com,本平台相关工作人员将会进行核查。


