Master's Discussion on Hot Topics:
Last night's CPI data met expectations, and the market seemed to receive a shot of adrenaline, stabilizing the price of Bitcoin a bit. However, don't celebrate too early, and don't hastily judge whether the trend is reversing or just bouncing back.
To be honest, regardless of the data, the Federal Reserve will definitely not cut interest rates in March. As for how the dot plot changes, it depends on tariffs and the Russia-Ukraine situation. Currently, the probability of a rate cut in June is quite high, with market expectations already soaring to 59.8%.
If it can reach over 72% in the next two months, it will basically be stable. From May to July, the opportunities and risks can be summarized in two scenarios: one is if there is a rate cut in June, the Bank of Japan's meeting on May 1 might raise rates, causing the market to plummet; after the Federal Reserve's meeting on May 8, the market might catch a breather. But before that, from March to early May, it is expected to be volatile, and it might even continue to drop.
The other scenario is if there is a rate cut in July, the market will slowly warm up after the Bank of Japan's meeting on June 17 and the Federal Reserve's meeting on June 18. The previous period from March to May would still be volatile with a downward trend, and if Japan raises rates again in May or June, the extent of the drop would be significant.
Traders are currently betting on a 25 basis point rate cut in June, but Japan might raise rates in May, so don't be too optimistic from March to May. The Master hopes everyone can safely navigate through May; don't rush to bottom-fish in the short term. Worrying about missing out on a few hundred million is secondary; the priority is not to get caught in a deep drop. After all, who is afraid of rising prices? What technical skills are needed to chase after a rise?
Recently, after a significant market drop, the bulls are in a state of panic. Those who were once die-hard bulls have now turned into natural bears, quickly selling at any slight rebound for fear of being trapped again. So for now, it's better to wait until the sentiment calms down and not to act impulsively.
If the impulsiveness continues, we will have to reassess how long and how strong this rebound can last. The current market sentiment is as fragile as glass; don't expect any reversal. The simultaneous decline of Bitcoin and U.S. stocks, whether for structural repair or emotional recovery, will rely on time and opportunity.
Speaking of Bitcoin, today’s daytime trading should be okay. U.S. stocks slightly rose on Wednesday, and there wasn't much of a pullback during the day, but whether the European session in the afternoon and the U.S. session in the evening can hold is uncertain.
If the price cannot stabilize in the range of 84k to 85k, it just retreated to around 80,600 last night, barely confirming a preliminary stabilization at 80k. The Federal Reserve's meeting is coming next Thursday morning, and after next Monday, the main players will definitely be cautious, and there will likely be no rise.
Master's Trend Analysis:
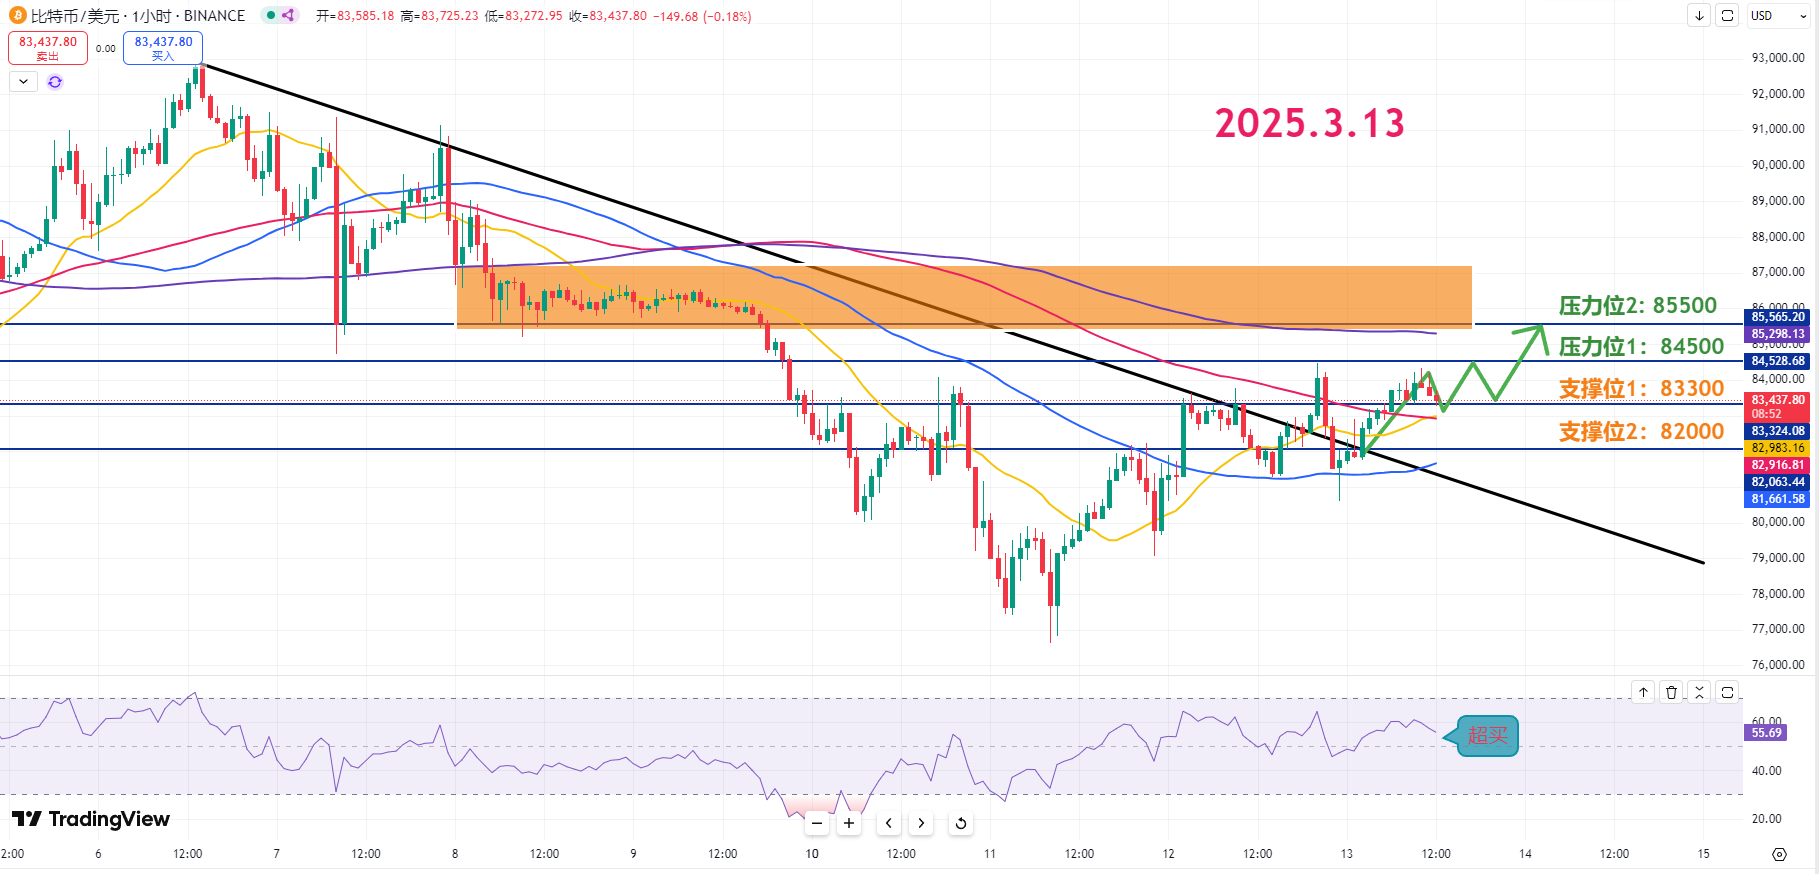
Resistance Levels Reference:
First Resistance Level: 85,500
Second Resistance Level: 84,500
Support Levels Reference:
First Support Level: 83,300
Second Support Level: 82,000
Today's Suggestions:
The current first resistance level at 84.5K can serve as a short-term resistance line, which is also the area of the previous high point and may undergo a retest adjustment. After the retest, a solid bottom must be established to increase the probability of further breakthroughs.
The second resistance level at 85.5K is a strong resistance because there are many trapped positions above, so a significant trading volume is needed to digest these chips, requiring new upward momentum. If the rebound is in place, one can consider taking profits in the resistance area near the 200-day moving average.
The first support is the previous high point at 83.3K; only by breaking through the previous high and retesting to hold can the short-term rise continue. Even if there is a short-term breakthrough, attention must be paid to the trends of the 120-day and 20-day moving averages.
If a large bearish candle appears and breaks the support at 83.3K, a bearish outlook can be adopted. However, if the K-line slowly forms a lower shadow and shows adjustments, one can look for ultra-short-term entry opportunities around 81.5K to 82K.
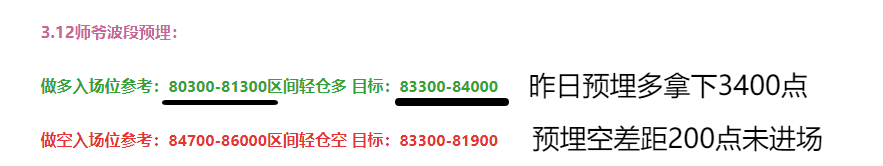
3.13 Master's Wave Strategy:
Long Entry Reference: Light position in the range of 82,000-83,300, Target: 84,500-85,500
Short Entry Reference: Light position in the range of 85,500-86,600, Target: 84,500-83,300
This article is exclusively planned and published by Master Chen (WeChat public account: Coin God Master Chen). Master Chen is the same name across the internet. For more real-time investment strategies, solutions, spot trading, short, medium, and long-term contract trading techniques, operational skills, and knowledge about candlesticks, you can join Master Chen for learning and communication. A free experience group for fans has been opened, along with community live broadcasts and other quality experience projects!

Warm Reminder: This article is only written by Master Chen on the official account (as shown above), and any other advertisements at the end of the article and in the comments section are unrelated to the author!! Please be cautious in distinguishing authenticity, and thank you for reading.
免责声明:本文章仅代表作者个人观点,不代表本平台的立场和观点。本文章仅供信息分享,不构成对任何人的任何投资建议。用户与作者之间的任何争议,与本平台无关。如网页中刊载的文章或图片涉及侵权,请提供相关的权利证明和身份证明发送邮件到support@aicoin.com,本平台相关工作人员将会进行核查。


