Original Title: "Market Crash: Bitcoin Dips Below $80,000 Again, Is a Bear Market Coming?"
Original Author: Luke, Mars Finance
Introduction
The cryptocurrency market is currently in turmoil. On March 9, Bitcoin—the barometer of the crypto world—plummeted by 7%, causing widespread panic in the market as its price fell from a high. According to data from The Block, the trading volume in centralized exchanges (CEX) for February reached $1.77 trillion, a new low for the year, but down 23.7% from January's $2.32 trillion, indicating a significant contraction in market activity. Meanwhile, crypto analyst Miles Deutscher pointed out on social media that only 12 of the top 100 cryptocurrencies by market capitalization achieved positive returns in the past 90 days. For instance, BERA surged by 579.63%, TRUMP rose by 85.61%, while Bitcoin fell by 13.47%, and LINK plummeted by 40%. This severe divergence, coupled with declining trading volumes, paints a picture of extreme market panic. Does this mean a bear market has quietly arrived?
Market Sentiment and Fear Index
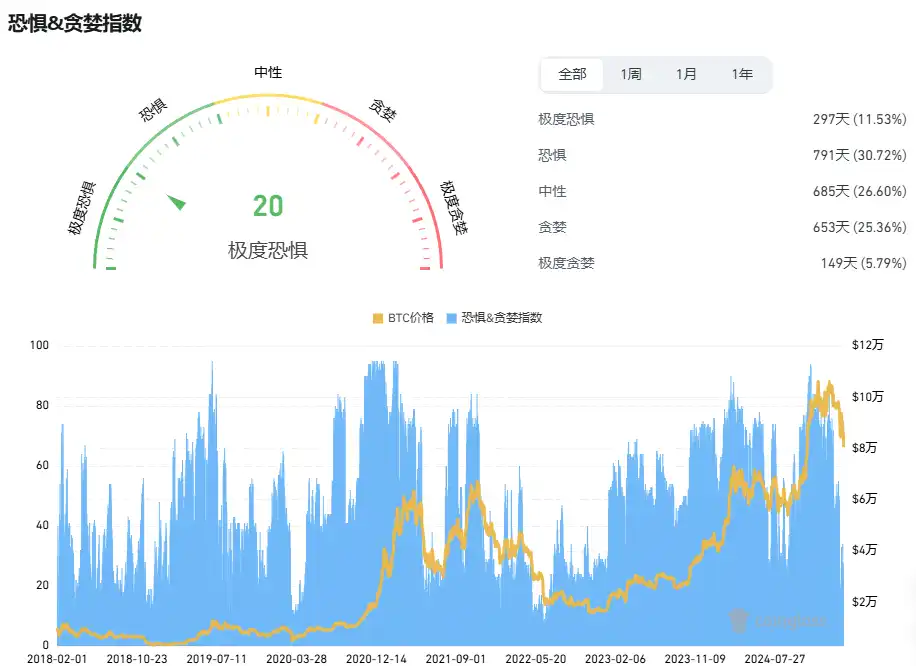
Market sentiment is one of the important indicators for judging trends, and liquidation data serves as a direct reflection of market sentiment, providing key insights for this analysis. Currently, the cryptocurrency Fear & Greed Index has dropped to 35, indicating a state of "fear," a significant decline from 70 ("extreme greed") a month ago. This index combines factors such as volatility (25%), market trading volume (25%), social media sentiment (15%), surveys (15%), Bitcoin dominance (10%), and trends (10%), clearly reflecting the rapid deterioration of investor confidence. Glassnode's Net Unrealized Profit/Loss (NUPL) indicator further confirms this trend, dropping from 0.6 (high greed) to 0.2, nearing levels typical of the early stages of historical bear markets. Values below 0 usually indicate that the market has entered a capitulation phase; the current figure suggests that while the market has not completely collapsed, panic sentiment is approaching a critical point.
CryptoQuant data shows that demand in the Bitcoin spot market is slowing down, with a significant increase in short positions in the futures market. As of March 9, short positions in CME Bitcoin futures accounted for 45% of total open interest, up 15 percentage points from 30% at the beginning of February. This short-dominated trend has intensified market panic, with investors increasingly expecting price declines, and some even discussing whether Bitcoin will fall below the psychological level of $60,000.
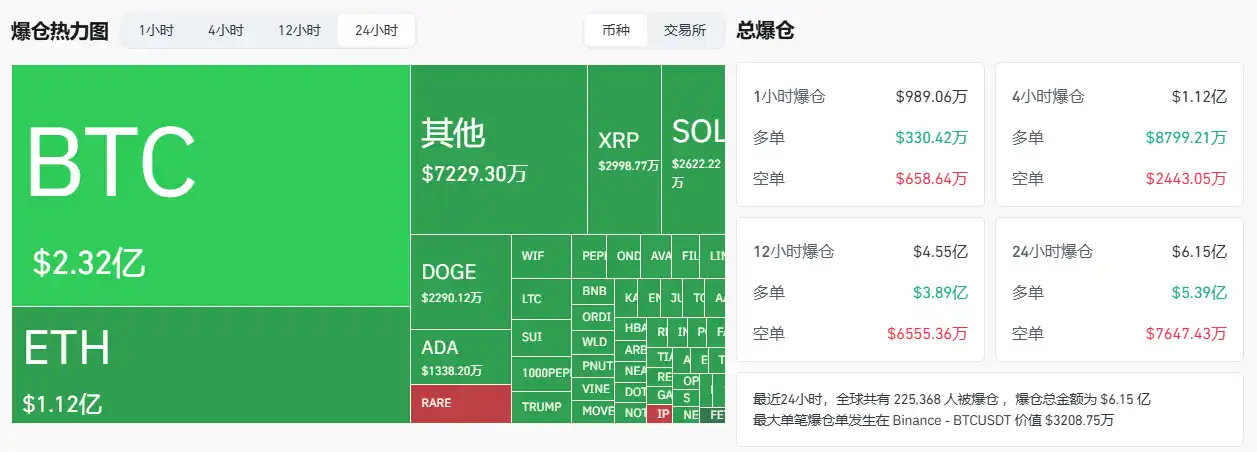
Liquidation data further reveals market dynamics, with $4.7072 million in BTC liquidations and $1.3061 million in ETH liquidations in the past hour, totaling $11.5482 million. Among these, long liquidations amounted to $8.2925 million, while short liquidations reached $24.3301 million, indicating that short liquidations far exceeded long liquidations, which could trigger a "short squeeze" leading to a short-term rebound. In the past 24 hours, total liquidations reached $616 million, with long liquidations at $540 million and short liquidations at $76.3075 million. The dominance of long liquidations reflects the ongoing pressure of the bear market, consistent with the deterioration of NUPL and the rise in short positions. Short-term volatility coexists with long-term risks, and investors need to be cautious of complexities, focusing on short squeeze opportunities while guarding against bear market downside risks.
Technical Analysis: Key Support and Resistance
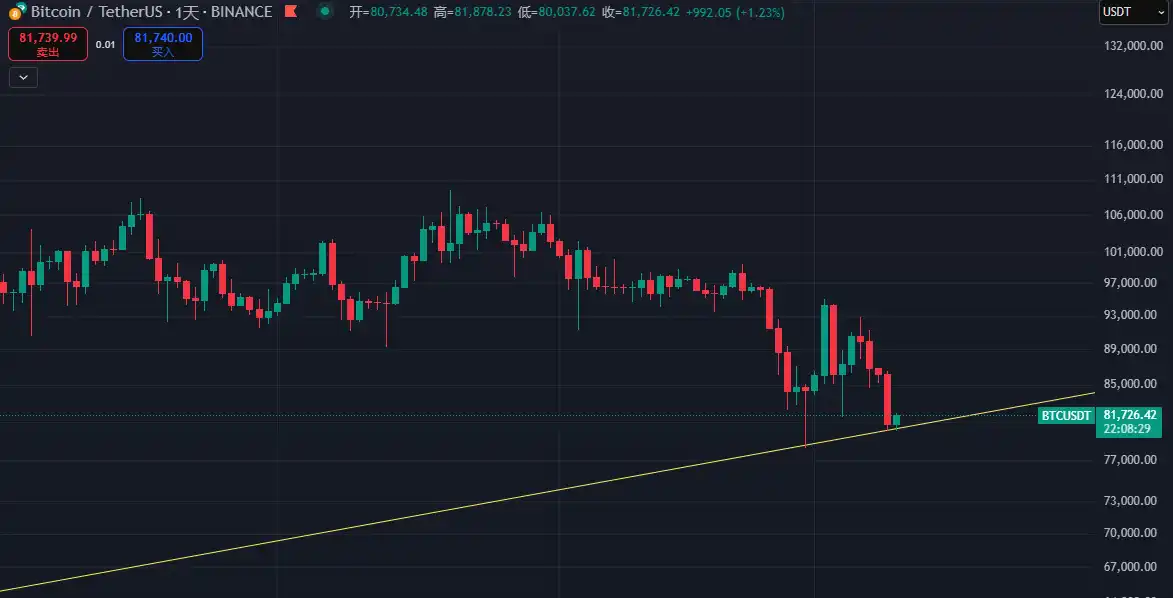
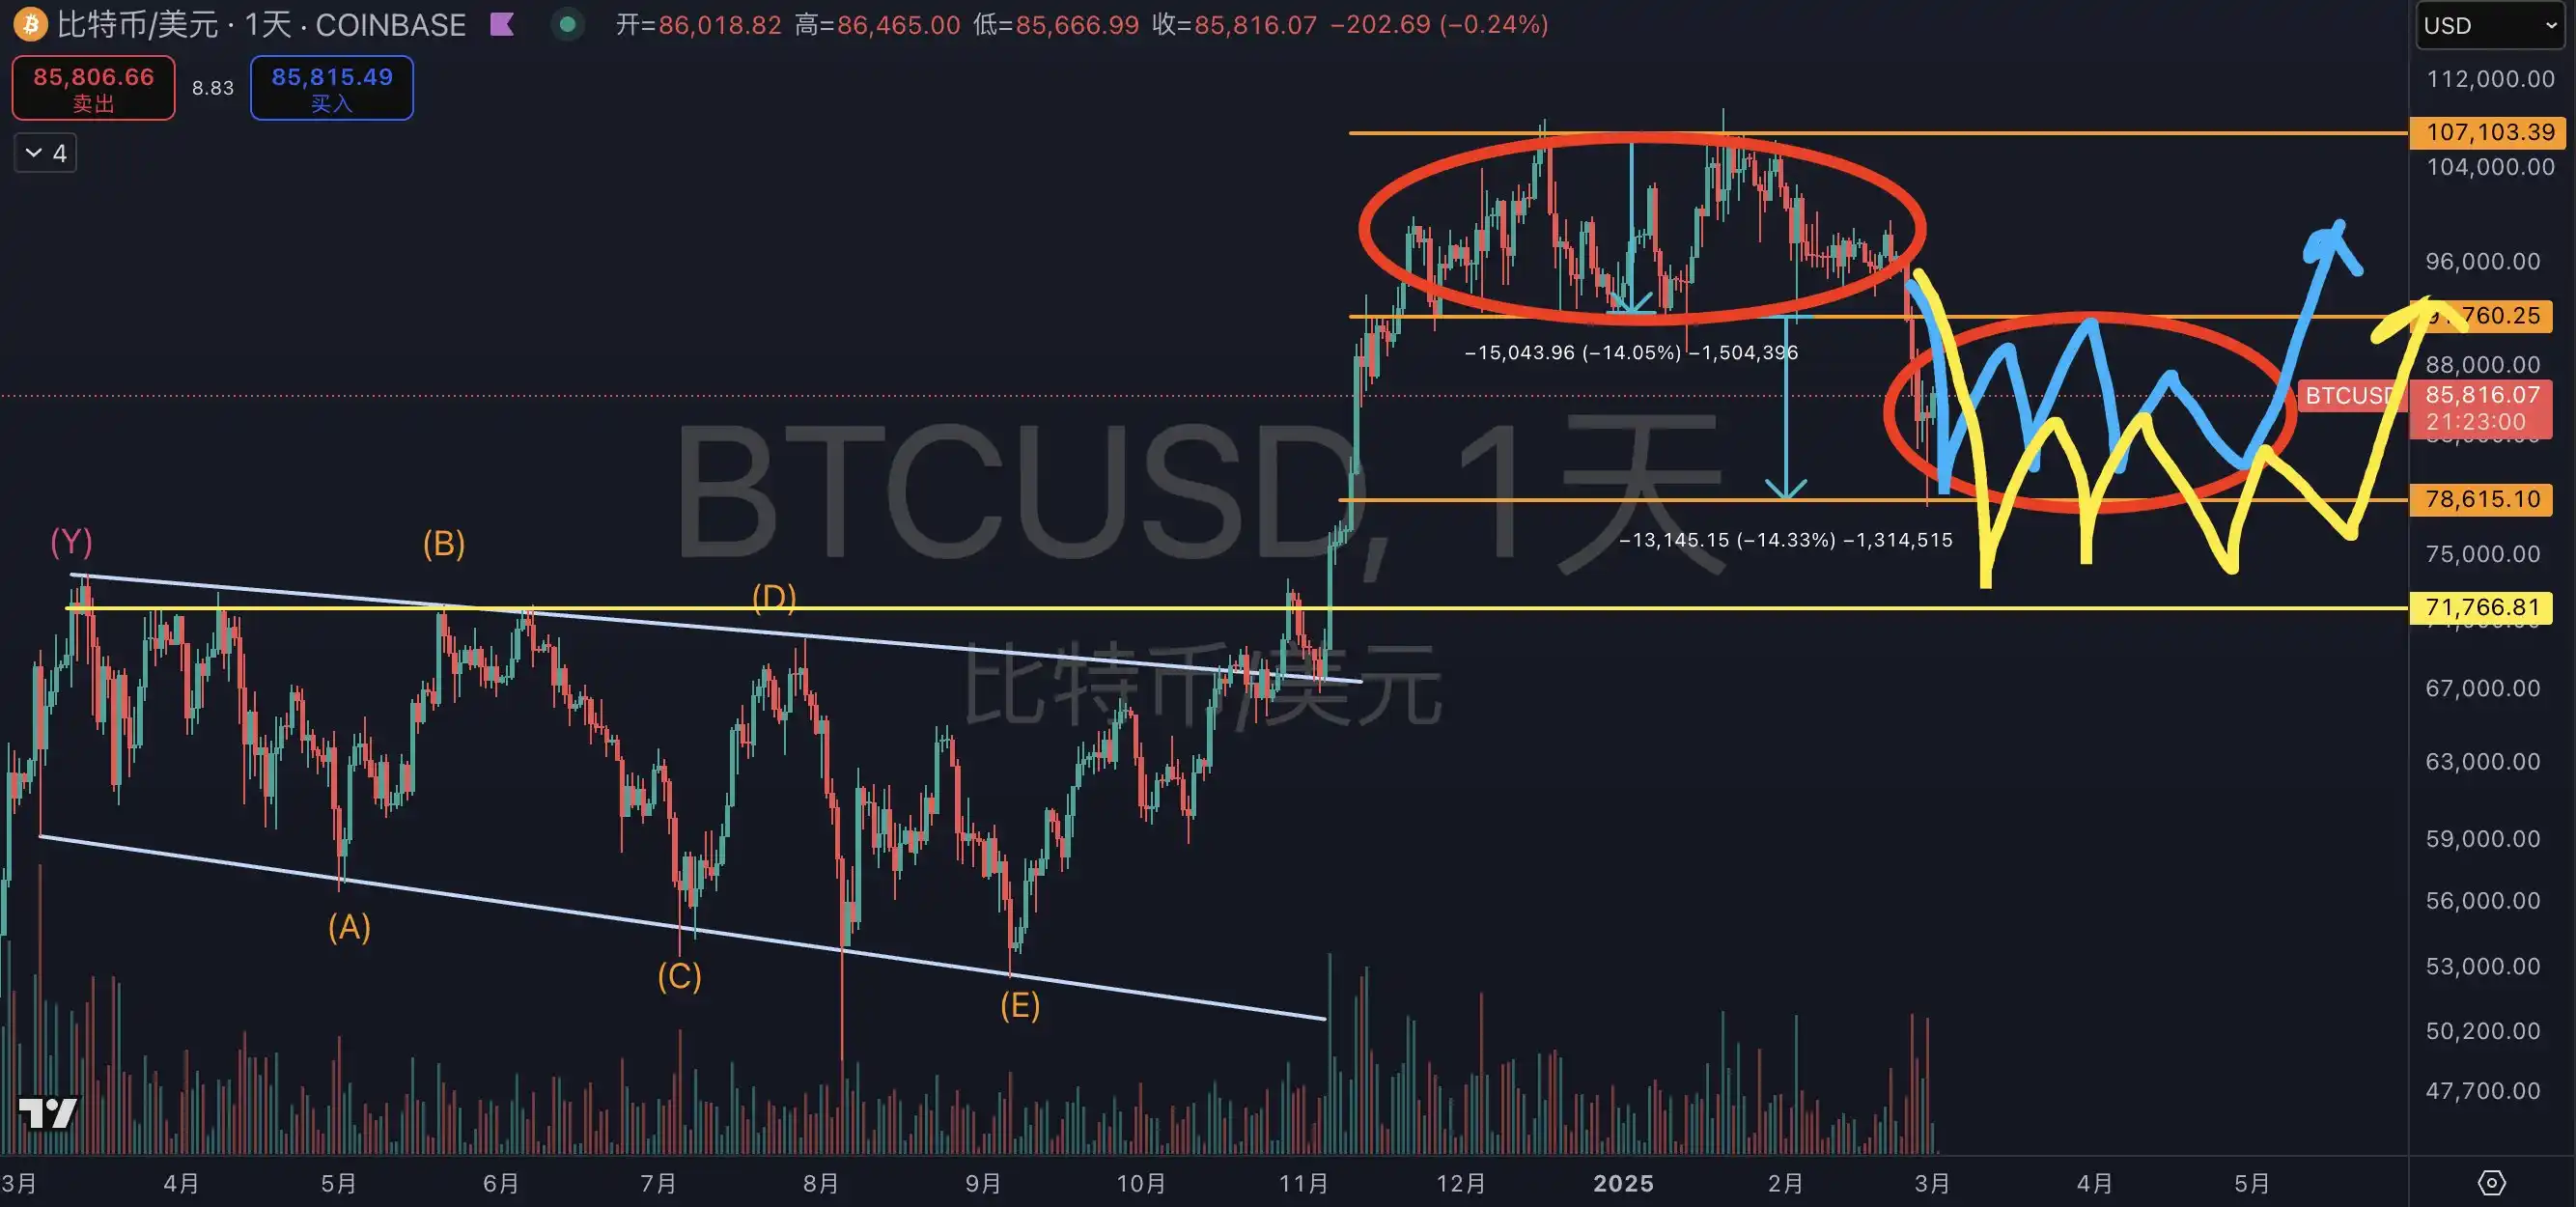
From a technical perspective, Bitcoin's price is at a critical juncture. Following the end of the high-level consolidation from November 20, 2024, to February 24, 2025, the price has formed a potential double top pattern—a typical bearish signal. After breaking below the double top neckline, the price has retreated from a high of $82,000 to around $76,000, with the volatility nearing the expected target (approximately 10%), but the time dimension has not yet fully digested.
Analysts generally believe that the market may face two potential paths:
· Path One: Time for Space If $78,000 becomes the bottom, both bulls and bears will need to patiently wait two to three months to confirm the trend. Currently, the range between the 50-day moving average (around $77,500) and the 200-day moving average (around $72,000) has become the focal point for short-term speculation. If the price can hold above $78,000, it may form a W-bottom pattern, laying the groundwork for a subsequent rebound.
· Path Two: Further Decline If bearish forces dominate, the price may drop to the left trading zone of $70,000-$72,000. This area not only serves as a support level for the 200-day moving average but is also an important retracement level following the low in August 2024. Trader Eugene Ng Ah Sio stated in a Telegram group: "I am not in a hurry to participate in bidding at the current price; $75,000 is the only level I am interested in." This cautious attitude reflects the uncertainty in the market.
Additionally, the Relative Strength Index (RSI) is currently at 42, having fallen from the overbought zone (above 70) to a neutral-low level, suggesting that short-term selling pressure has eased, but it has not yet entered the oversold zone (below 30). Technical analysis suggests that investors should remain on the sidelines, avoiding blind chasing of highs or bottom fishing, and wait for the trend to clarify.
Macroeconomic Background: Good News Exhausted and Uncertainty
Macroeconomic factors cannot be ignored in their impact on the cryptocurrency market. Firstly, changes in the global interest rate environment are putting pressure on high-risk assets. The yield on the U.S. 10-year Treasury bond recently rose to 4.2%, an increase of 40 basis points from 3.8% at the beginning of the year, attracting funds back from the crypto market to traditional safe-haven assets. Meanwhile, high inflation expectations may lead the Federal Reserve to delay interest rate cuts, further diminishing Bitcoin's appeal as "digital gold."
On the legislative front, the weakening of positive news has also intensified market pressure. For example, Utah's Bitcoin bill passed the state Senate on March 7 with 19 votes in favor and 7 against and is about to be signed into law by the governor. However, its core provision—allowing Utah to hold Bitcoin as a reserve asset—was removed during the final review. The original provision would have authorized the state treasurer to invest in Bitcoin, capped at 5% of its market value (approximately $25 billion), which could have made Utah the first state in the U.S. to hold Bitcoin reserves. Now, the bill only retains basic rights such as custodial protection and Bitcoin mining and node operation, significantly diminishing its impact.
The exhaustion of macroeconomic positives has undermined market confidence, while external uncertainties (such as potential adjustments to crypto policies by the Trump administration) are adding variables to the market. Bloomberg analysts predict that if Trump is re-elected, his tax cuts and deregulation policies may provide a short-term boost to the crypto market, but the long-term effects remain to be seen.
ETF Outflows: Institutional Enthusiasm Dwindles
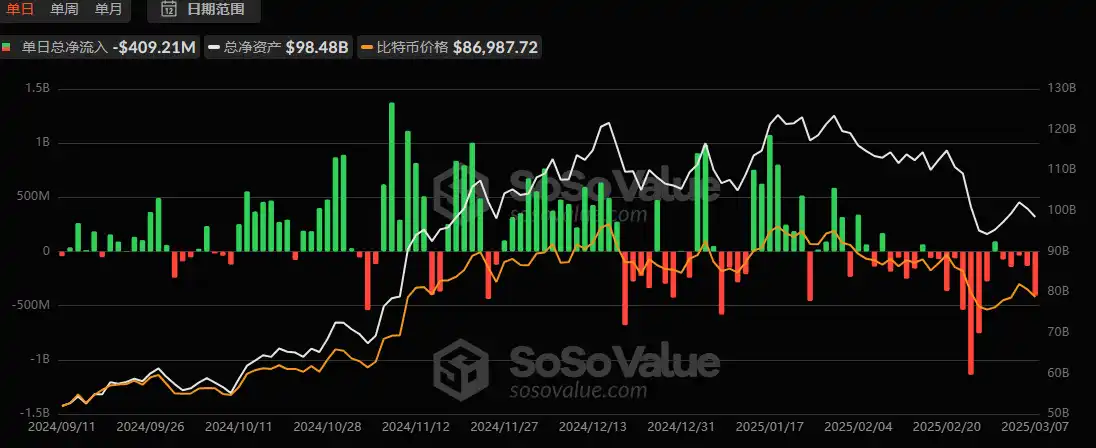
Institutional demand was a significant driver of Bitcoin's price increase in 2024, but recent outflows from spot ETFs are concerning. According to sosovalue data, net outflows from U.S. Bitcoin spot ETFs have exceeded $500 million since March, with Grayscale's GBTC seeing particularly significant outflows. CryptoQuant's research director Julio Moreno pointed out: "The growth of Bitcoin spot demand is contracting, while short positions in the futures market dominate, directly leading to price declines."
WhaleWire founder Jacob King bluntly stated: "The Bitcoin bear market has arrived. ETF outflows are at record levels, the narrative of institutional demand has collapsed, and Bitcoin is heading towards multi-year lows." Although this view is somewhat extreme, ETF outflows indeed reflect a decline in institutional enthusiasm. At the beginning of 2024, the average daily net inflow into ETFs was as high as $200 million, but it has now turned into net outflows, indicating that institutional investors are reassessing the risk-reward ratio of crypto assets. This change poses a further blow to market confidence.
On-Chain Data: Hope and Uncertainty Coexist
On-chain data provides a glimmer of hope for the market. According to Glassnode's analysis, the behavior of long-term holders (investors holding for over a year) is shifting from a distribution phase to an accumulation phase. As of March 9, the net position change of long-term holders has turned positive, with an average daily inflow of about 5,000 Bitcoins. Historically, this shift in trend has often been a reliable signal for the market transitioning from a top to a bottom, such as during the bottom formation periods in early 2019 and March 2020.
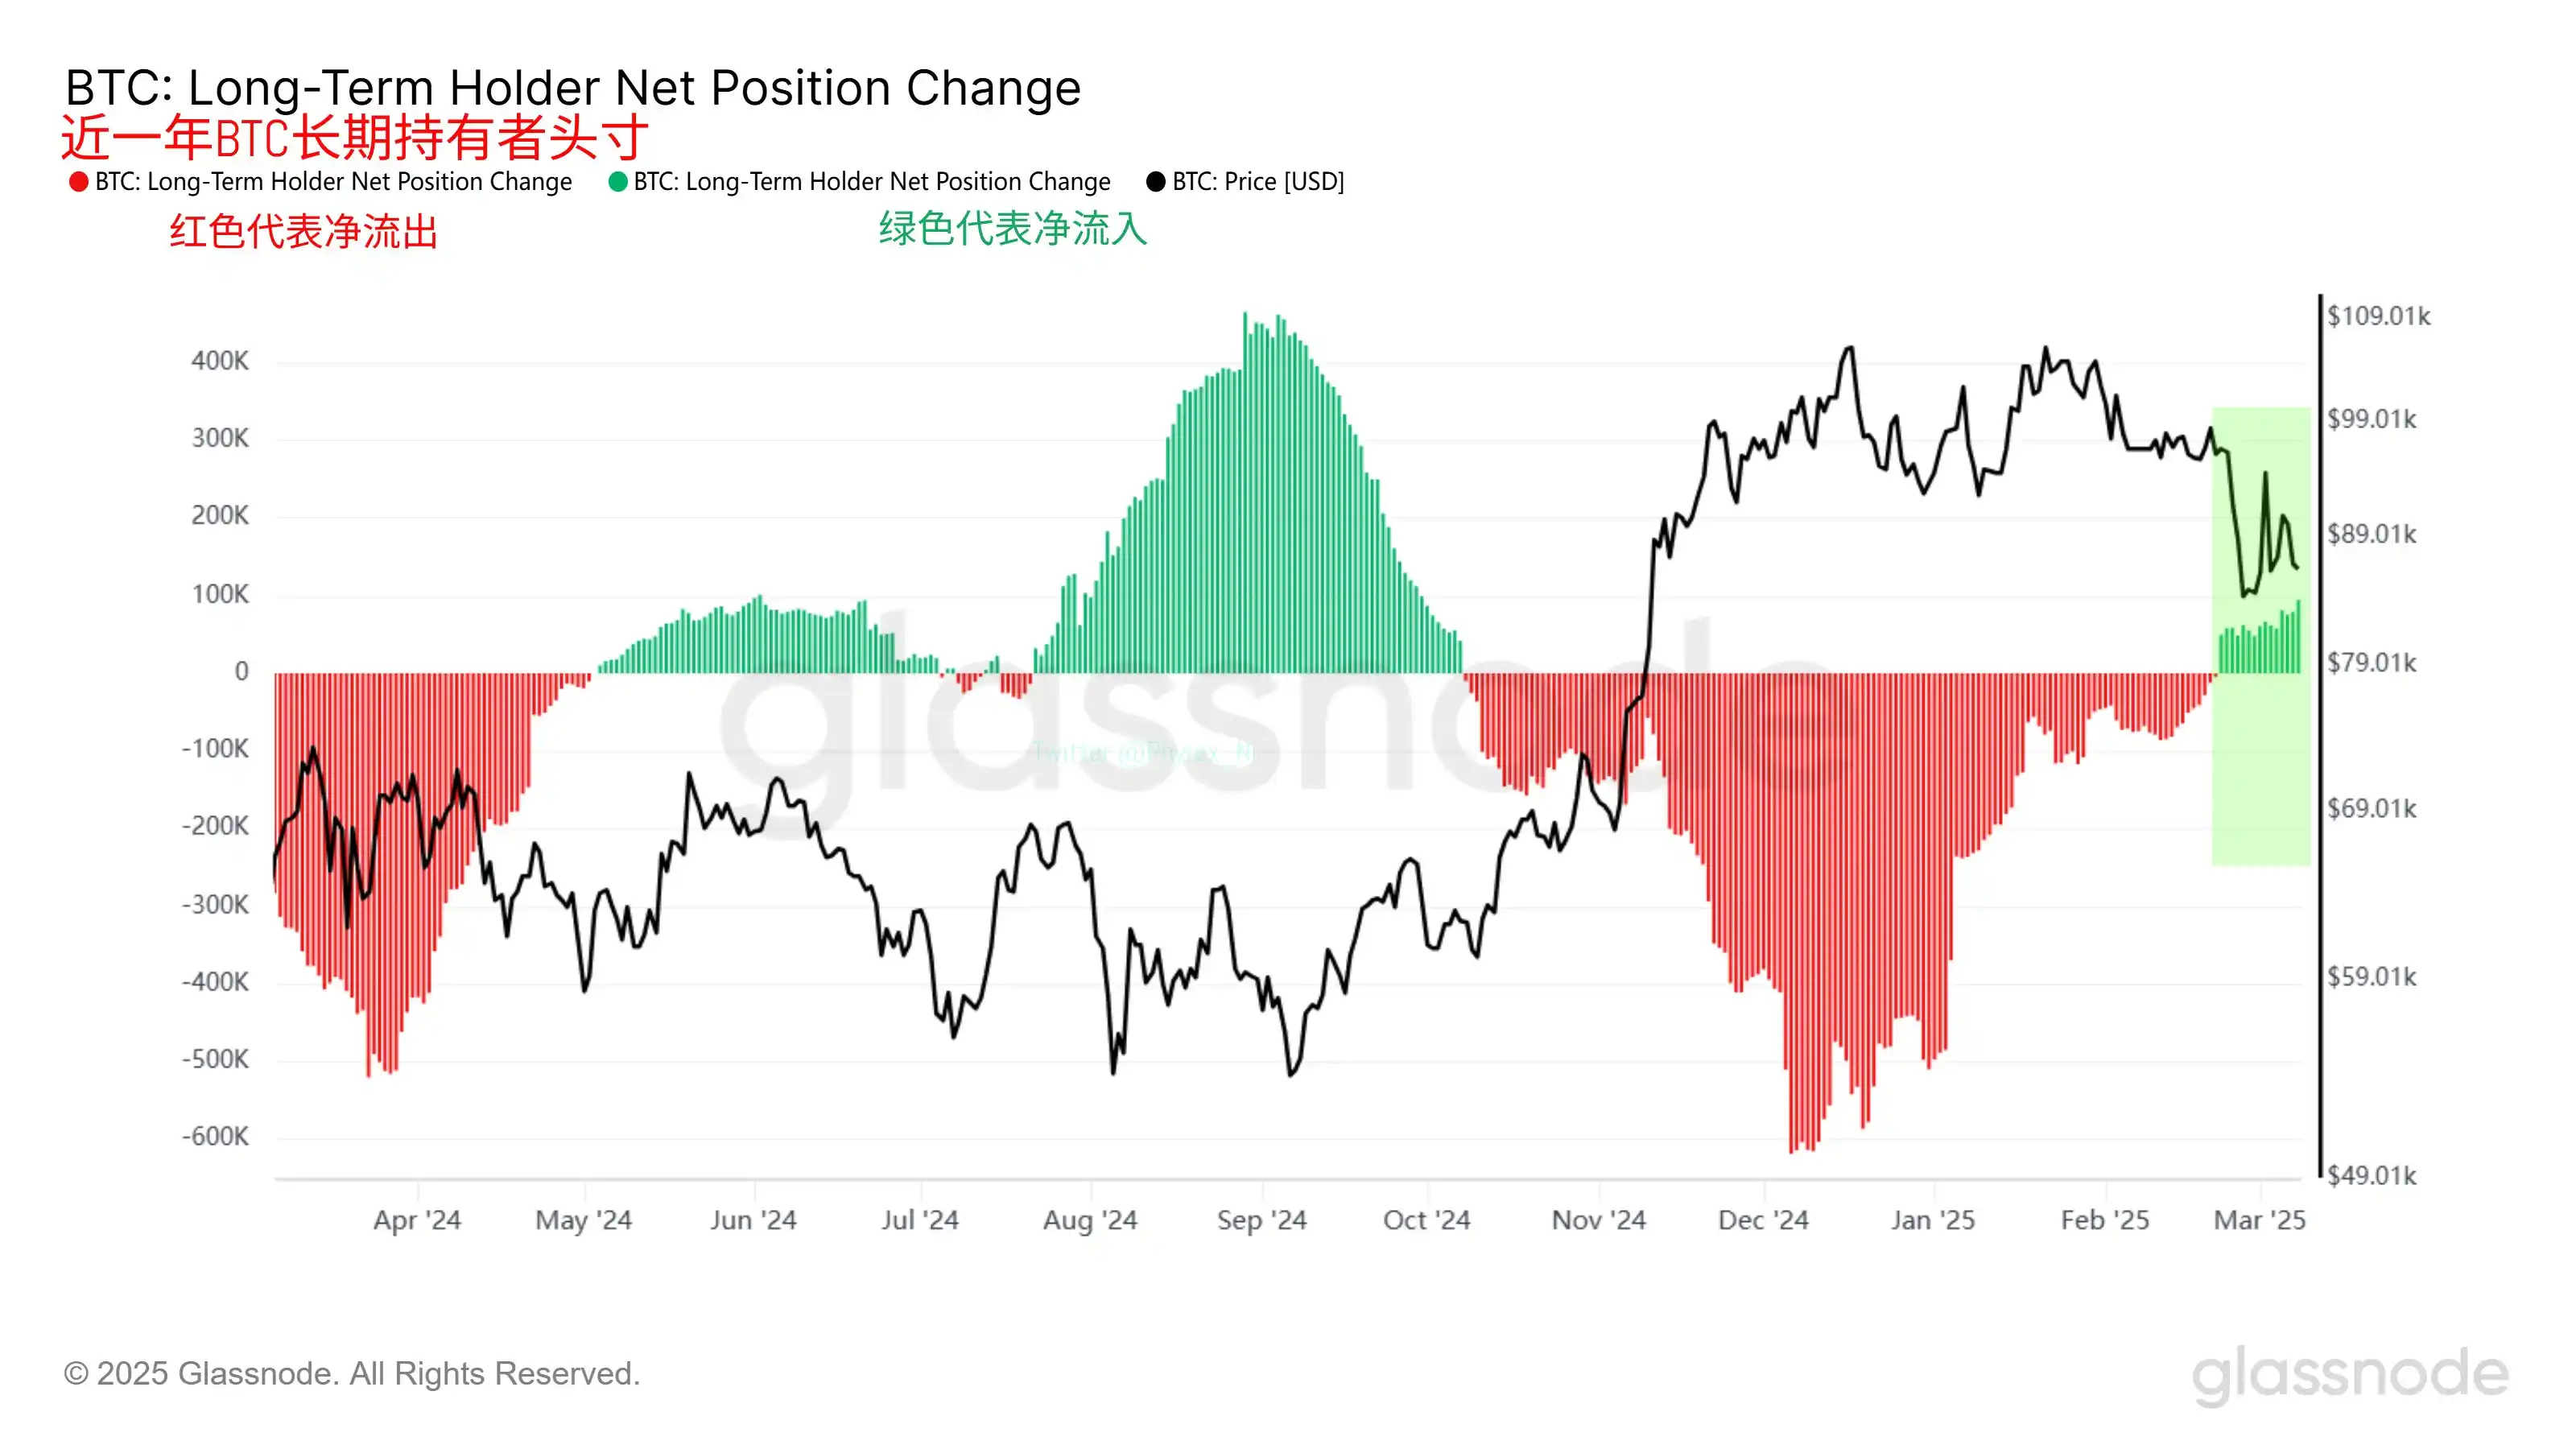
However, the current situation differs from previous cycles. Firstly, the price decline may be slow and sustained, and only when long-term holders' holdings reach new highs (e.g., exceeding 700,000 Bitcoins) might a relative bottom be reached. Secondly, the rise of spot ETFs has changed the holder structure. Arkham Intelligence data shows that ETF holders currently control about 4% of the circulating Bitcoin supply (approximately 840,000 Bitcoins), while the proportion of traditional on-chain long-term holders has dropped from 65% in 2023 to 60%. This may weaken the predictive power of traditional on-chain indicators.
Although the shift of long-term holders to a buying mode is encouraging, it is still in the early stages of inflow, and the possibility of a reversal has not been ruled out. Predictions for the market bottom still need to be validated with more external signals.
Historical Comparison: Similarities and Differences in Bear Markets
Looking back at history, the current market shares similarities with the bear markets of 2018 and 2022, but there are also significant differences. In 2018, Bitcoin fell from $20,000 to $3,200, a decline of over 80%, accompanied by the bursting of the ICO bubble and shrinking trading volumes; in 2022, it dropped from $69,000 to $16,000, a decline of about 76%, influenced by the FTX collapse and interest rate hikes. Currently, Bitcoin has decreased by about 7%-13% from its peak of $82,000, which is far from the levels seen in historical bear markets.
The similarities include a decline in trading volume and market differentiation. For example, in 2018, CEX trading volume fell by 70% from its peak, while the current decline is only 23.7%. The difference lies in institutional participation and the emergence of ETFs, which provide a new buffer mechanism for the market. Therefore, the current panic may be a period of adjustment rather than a full-blown bear market, but if ETF outflows continue to expand, historical tragedies may repeat themselves.
Whether the market has entered a bear market is still inconclusive. Technical analysis shows that the risk of a pullback remains, with key support levels like $78,000 and $75,000 being tested; on the macro level, positive factors are limited, ETF outflows are intensifying, and institutional narratives are weakening. Although on-chain data suggests a recovery in confidence among long-term holders, the bottom has not yet become clear. The current panic may be a precursor to a deeper adjustment, or it could be the darkness before dawn.
For investors, caution is paramount. As Miles Deutscher said, "This is a rotating market, and holders are being punished." Instead of chasing short-term fluctuations, it is better to focus on the intersection of technical support, macro dynamics, and on-chain signals. Drawing on Warren Buffett's wisdom—"Be fearful when others are greedy, and greedy when others are fearful"—in the turbulent waters of the crypto market, risk management and a long-term perspective are the keys to survival.
免责声明:本文章仅代表作者个人观点,不代表本平台的立场和观点。本文章仅供信息分享,不构成对任何人的任何投资建议。用户与作者之间的任何争议,与本平台无关。如网页中刊载的文章或图片涉及侵权,请提供相关的权利证明和身份证明发送邮件到support@aicoin.com,本平台相关工作人员将会进行核查。


