The information, opinions, and judgments regarding the market, projects, and cryptocurrencies mentioned in this report are for reference only and do not constitute any investment advice.
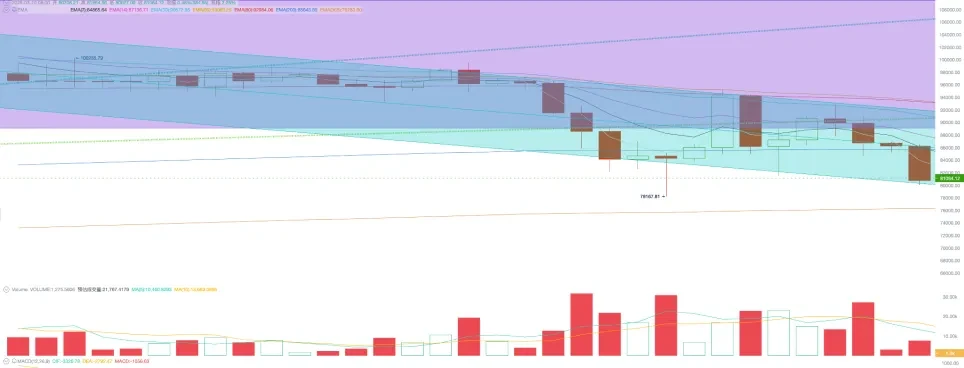
This week, BTC opened at $94,265.47 and closed at $80,699.17, plummeting 14.39% over the week, with a volatility of 15.29%. Trading volume decreased compared to last week but remained high. The BTC price fell below the "Trump bottom" (the $89,000~$110,000 range), significantly retracing the gains from the "Trump trade."
Over the past two weeks, BTC has been experiencing a tumultuous situation.
On one hand, due to the repeated and chaotic nature of Trump's tariff policies, U.S. stocks began to trade on "economic recession," giving back most of the gains since the "Trump trade," which also led to the largest outflow of BTC Spot ETF since its inception.
On the other hand, Trump signed the "BTC Strategic Reserve Executive Order" and held the first White House cryptocurrency summit, conveying many positive messages regarding the regulation and use cases of crypto assets. Texas also passed a state-level BTC reserve bill, indicating that the use cases and policy environment for crypto assets, including BTC, are genuinely improving in the U.S.
However, investor sentiment dominated the short-term price movements. As U.S. stocks retraced the "Trump trade" rally, BTC also fell sharply by 14.39% this week, marking the second largest weekly drop of this cycle. Although it did not fall below the lowest point of February 28, it has broken through both the "Trump bottom" and the 200-day bull-bear dividing line. The Fear & Greed index has dropped back to "extreme fear" at 20 points.
With the release of non-farm payroll data on Friday and the "dovish" remarks from the Federal Reserve Chairman, U.S. stock indices rebounded and temporarily stabilized, but the mid to short-term outlook remains uncertain, depending on Trump's tariff policies and U.S. economic data trends. BTC's movements will continue to be constrained by U.S. stock trends and lack the conditions to develop an independent market.
Macroeconomic and Financial Data
On Friday, new signs of a slowdown emerged in the U.S. job market. Non-farm payrolls in February increased by 151,000, slightly below market expectations, and the unemployment rate unexpectedly rose from the previous 4% to 4.1%, reaching a new high since November of last year.
Subsequently, Federal Reserve Chairman Powell stated that despite facing uncertainties, the current U.S. economic situation remains good, with a robust and balanced job market. The Federal Reserve should remain cautious and does not need to rush to adjust policy rates at this stage, as it can afford to wait for the situation to become clearer. The uncertainty brought about by changes in Trump's policies remains relatively high. The Federal Reserve is assessing the impact of changes in trade policies, which have exacerbated economic uncertainty.
This statement continues the Federal Reserve's consistent stance and lacks novelty. However, possibly in response to the decline in U.S. stocks and market fears of recession, subsequent "dovish" remarks were released.
Powell indicated that if the economy continues to remain robust and inflation does not further decline to the 2% target, the Federal Reserve may maintain the current benchmark interest rate. However, if the job market unexpectedly weakens or inflation significantly decreases in the future, the Federal Reserve will consider resuming rate cuts.
Based on signs of weakening economic data and adjustments in U.S. stocks, CME Fed Watch shows that traders are now betting that the Federal Reserve will cut rates three times this year, totaling about 75 basis points.
As a result, the U.S. dollar index fell sharply by 3.52% over the week, closing at 103.882. The Nasdaq rebounded on Friday, breaking through the annual line and closing above it, while the S&P 500 broke through the 200-day line and closed above it. The yield on 2-year U.S. Treasury bonds rose slightly, while the yield on 10-year U.S. Treasury bonds increased by over 1.89%.
Friday's non-farm payroll data slightly improved traders' previously lowered expectations. However, concerns about a U.S. economic recession or stagflation have not been eliminated, and this is merely a correction of the previously significant downward pricing. Whether the rebound in U.S. stocks and BTC can be sustained requires further observation, and whether it can bottom out and reverse needs more economic data guidance.
One psychological support for bulls is that the "Trump trade" in U.S. stocks has completed its retracement. All three major stock indices have returned to the levels before Trump's victory on November 5.
Technical Analysis
Compared to U.S. stocks, BTC has maintained a relatively strong trend, currently priced about 15% higher than the high on November 5.
Technically, BTC's trend remains difficult to be optimistic about. It has fallen below the "Trump bottom" and is operating below the first bullish trend line (the dark green dotted line in the chart). Moreover, since the historical high on January 21, BTC has formed a descending channel (the green box in the chart), which has repeatedly suppressed BTC's rebounds.
On Sunday evening, bears attacked the market again, causing BTC to plummet below the 200-day moving average. The intensity of this adjustment and weak performance is reminiscent of the market performance from July to September 2024. The market is currently in an extremely oversold state in the short term, but recovering from this downturn may require more external conditions and time.
Selling Pressure and Liquidation
After last week's panic selling following a breakdown, selling pressure has significantly decreased this week. Long and short positions combined sold 147,351 BTC, returning to previous normal levels. However, the inventory on exchanges increased by over 5,000 BTC, indicating that while selling pressure has diminished, buying power remains insufficient.
According to on-chain data, the overall floating profit rate in the market is 198%, with long positions at 347% and short positions at a floating loss of 6%. Short positions continue to be under pressure. In a bull market, short positions being in a floating loss state often represent a good mid-term entry opportunity.
Stablecoins and BTC Spot ETF
Compared to last week's net outflow of $4.081 billion from the dual-channel, this week saw some relief from high pressure, with a total inflow of $1.295 billion, including $2.107 billion in stablecoins and an outflow of $719 million from BTC Spot ETF. The outflow from the BTC Spot ETF channel is a source of selling pressure that led to the market decline.
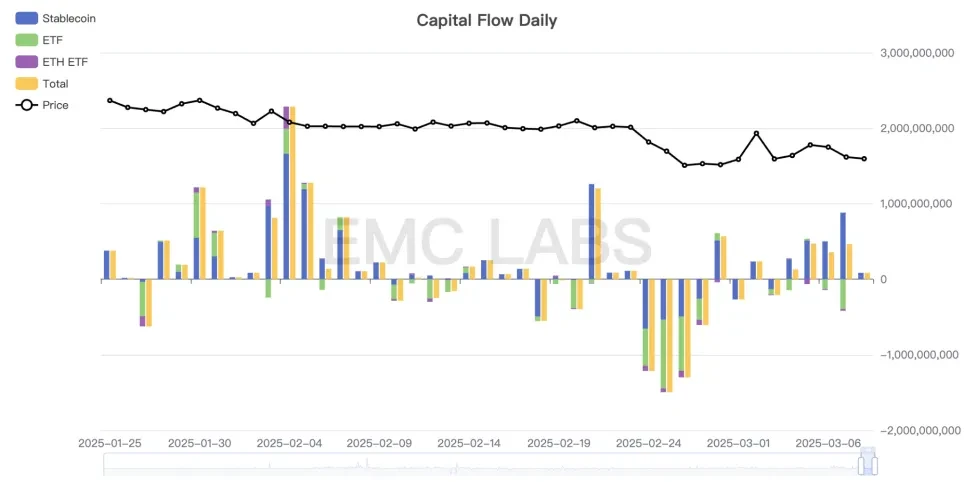
Cryptocurrency market inflow and outflow statistics (eMerge Engine)
In February, the 11 BTC Spot ETFs in the U.S. experienced the largest outflow since their approval, totaling $2.3 billion. As March began, the outflow continued but at a reduced scale. The outflow group includes retail and institutional selling, as well as liquidation by CME contract arbitrage traders. In terms of transmission paths, for BTC prices to stabilize, U.S. stocks need to stabilize, and ETF holders need to shift from net outflow to net inflow.
Cycle Indicators
According to the eMerge engine, the EMC BTC Cycle Metrics indicator is at 0.375, indicating that the market is in an upward continuation phase.
EMC Labs was established in April 2023 by cryptocurrency asset investors and data scientists. It focuses on blockchain industry research and investments in the crypto secondary market, with industry foresight, insights, and data mining as its core competencies, aiming to participate in the thriving blockchain industry through research and investment, promoting the well-being of humanity through blockchain and crypto assets.
For more information, please visit: https://www.emc.fund
免责声明:本文章仅代表作者个人观点,不代表本平台的立场和观点。本文章仅供信息分享,不构成对任何人的任何投资建议。用户与作者之间的任何争议,与本平台无关。如网页中刊载的文章或图片涉及侵权,请提供相关的权利证明和身份证明发送邮件到support@aicoin.com,本平台相关工作人员将会进行核查。


