Hello everyone! This afternoon at 16:00, the AICoin editor will discuss with you the "K-Line Reversal Techniques." This is the foundation of market analysis. Once you learn these patterns, you will be better able to capture market turning points! Without further ado, let's get straight to the point.
First, let's review the basic knowledge of K-lines. Concepts like bullish and bearish judgments, and doji stars are fundamental content that I believe everyone has already mastered, so I won't elaborate on them here. Today, we will focus on several common reversal patterns. Once these patterns appear, they often indicate that the market may be about to change direction.
Pattern One: Hammer, Hanging Man, and Shooting Star
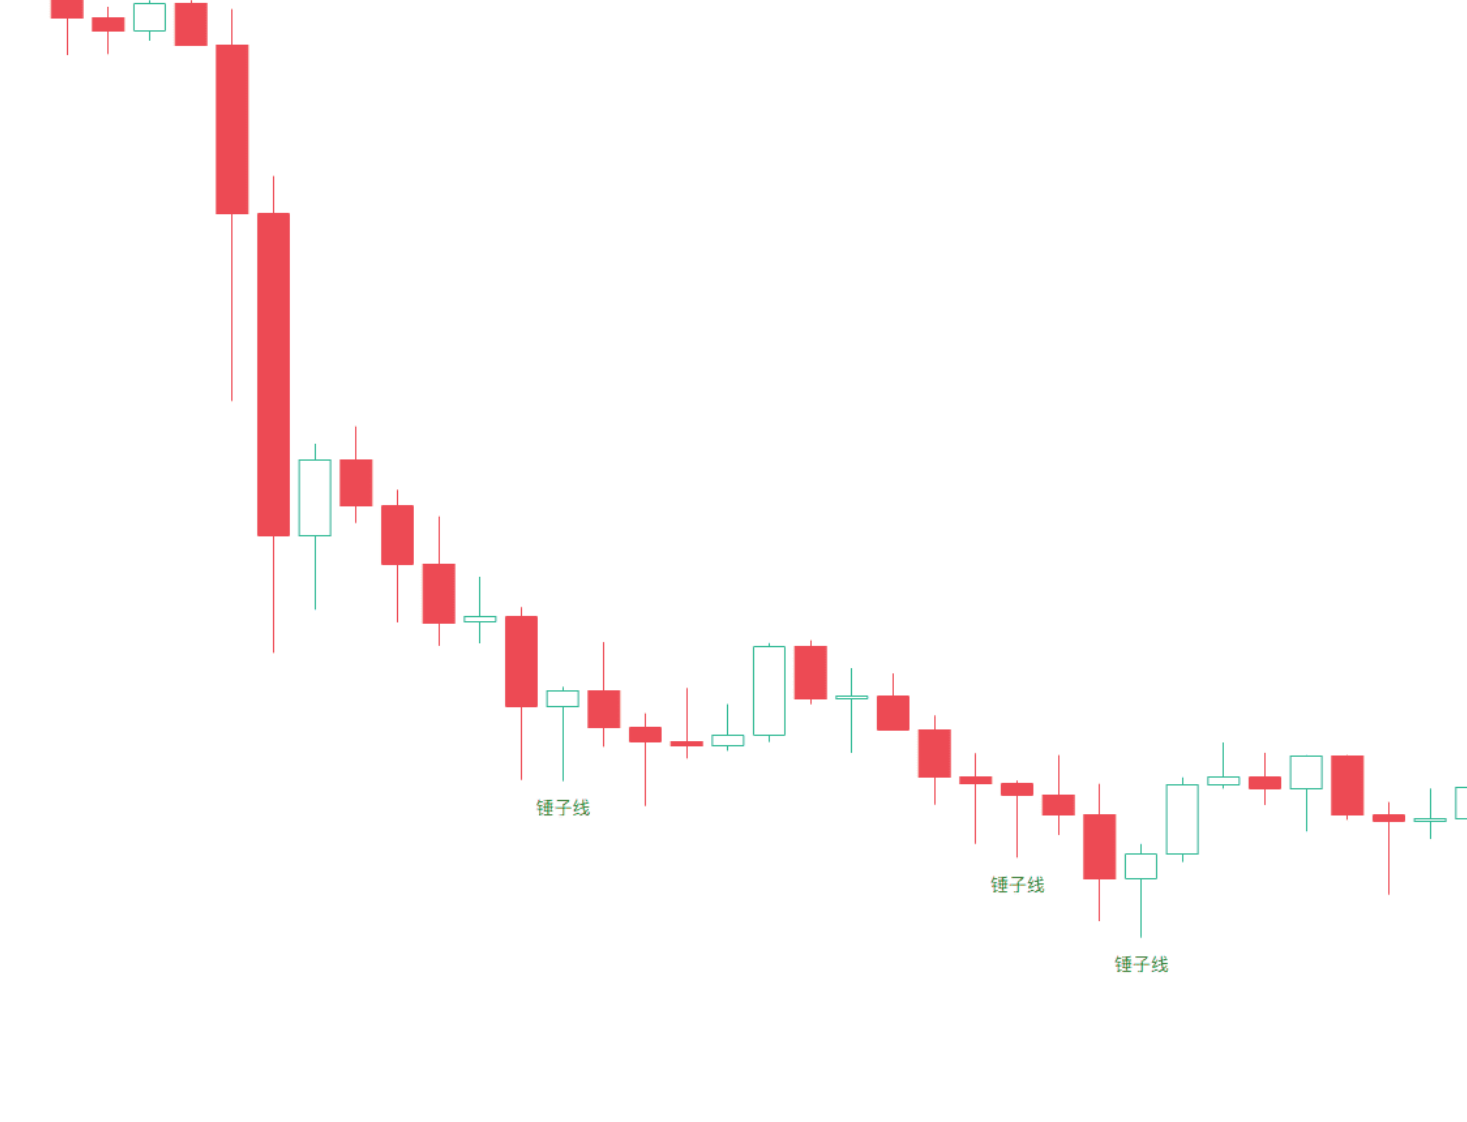
The hammer is characterized by a small body at the top and a long lower shadow (the lower shadow is at least twice the size of the body), with little to no upper shadow, usually appearing in a downtrend. It indicates that the decline has encountered support, and the market may be about to rebound.
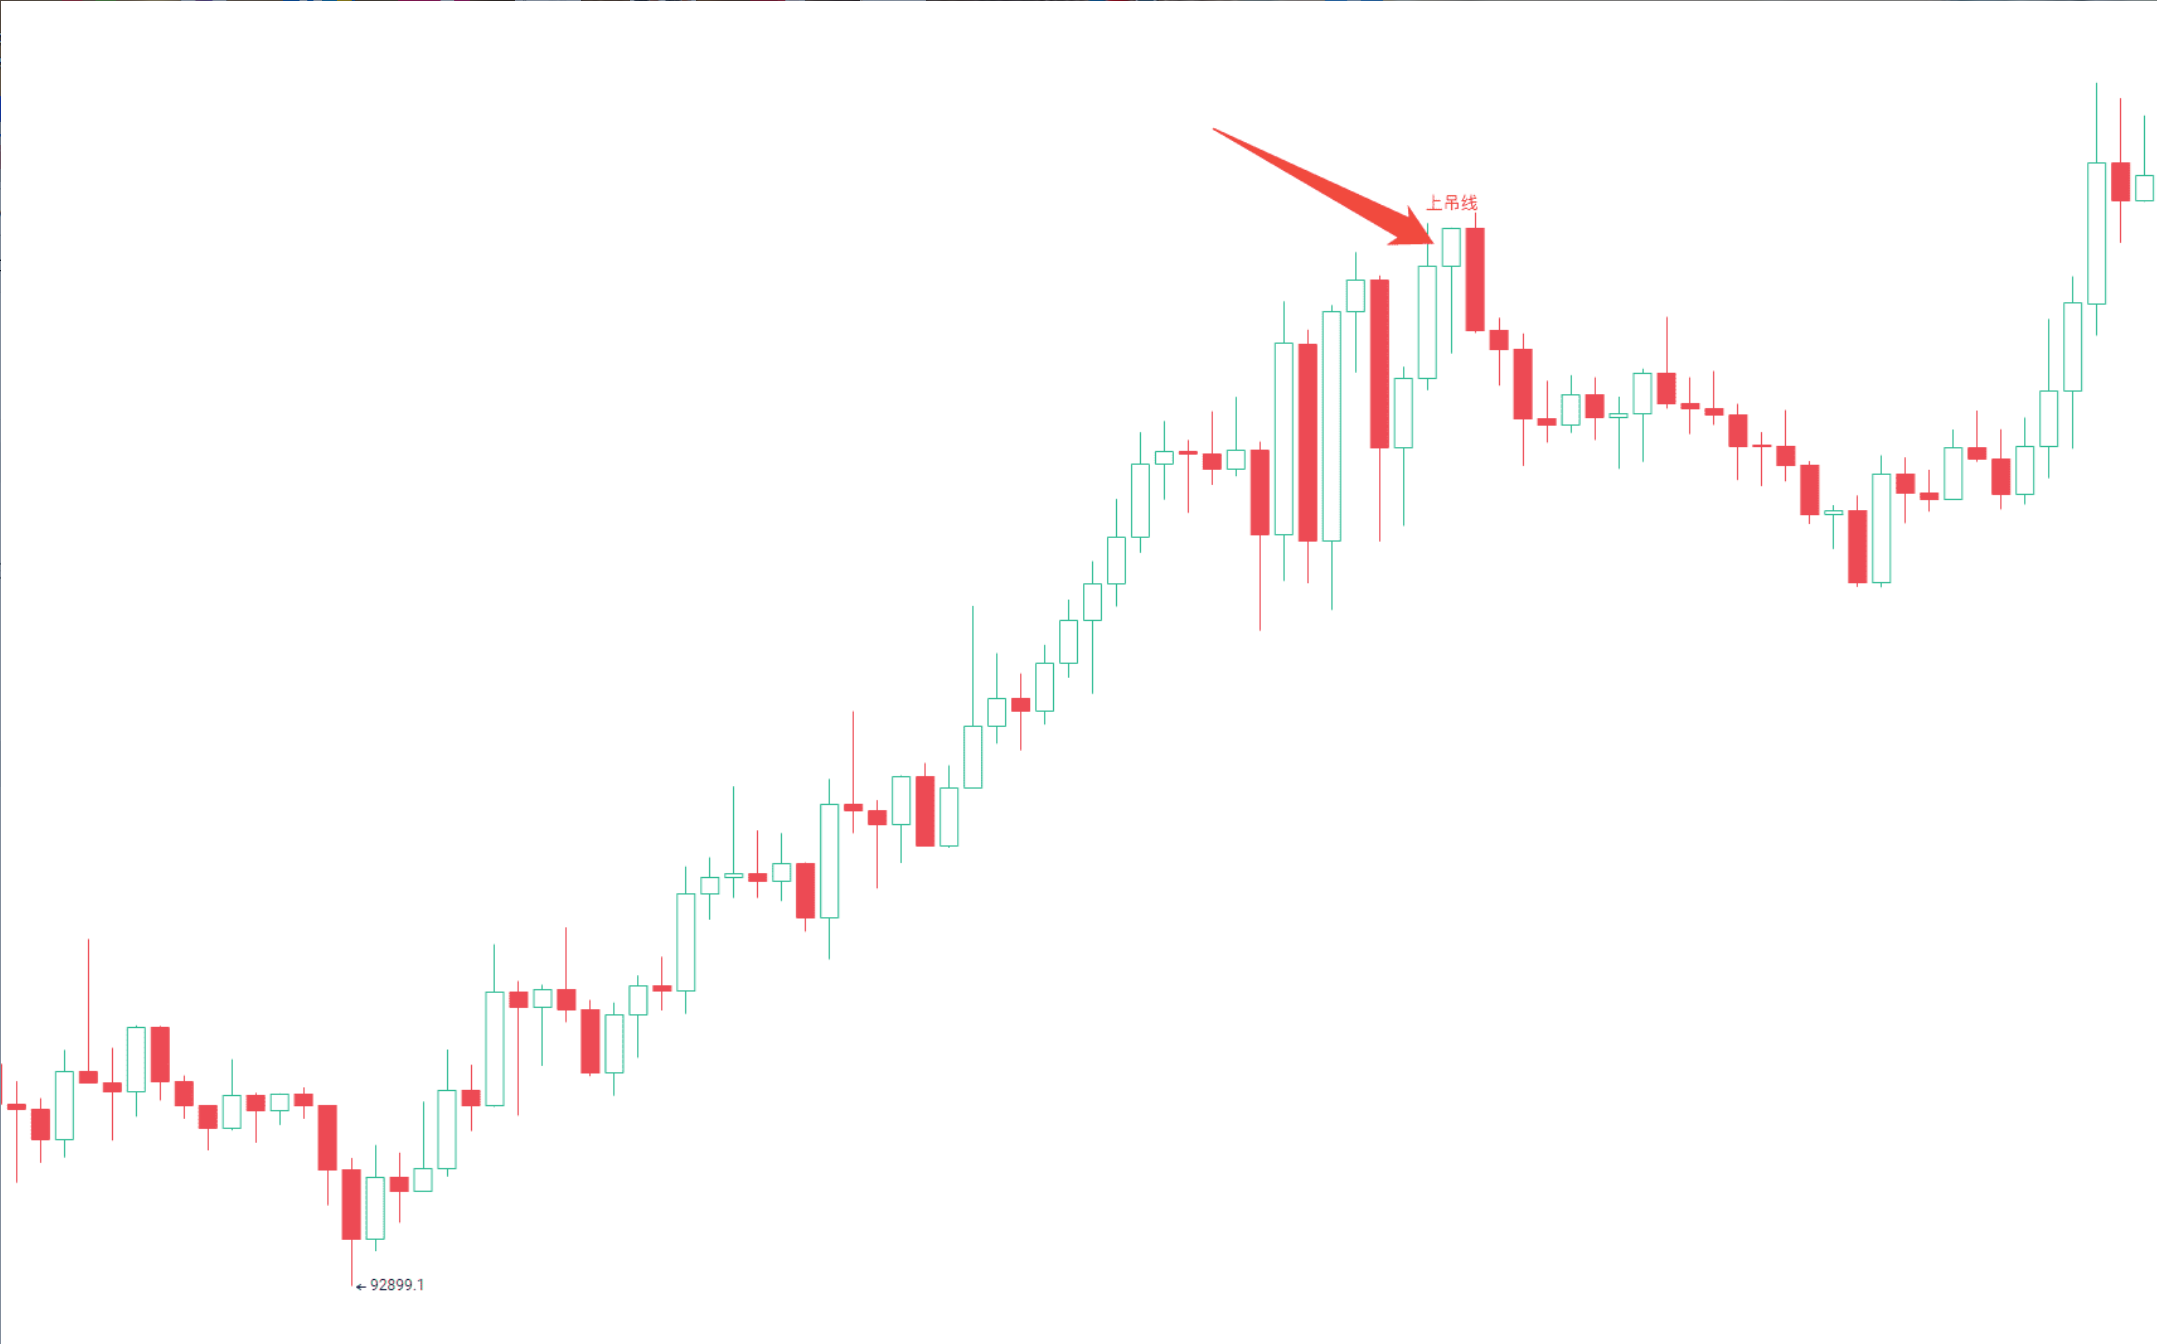
The hanging man is similar to the hammer but appears in an uptrend. It indicates that the rise has encountered resistance, and the market may be about to correct.
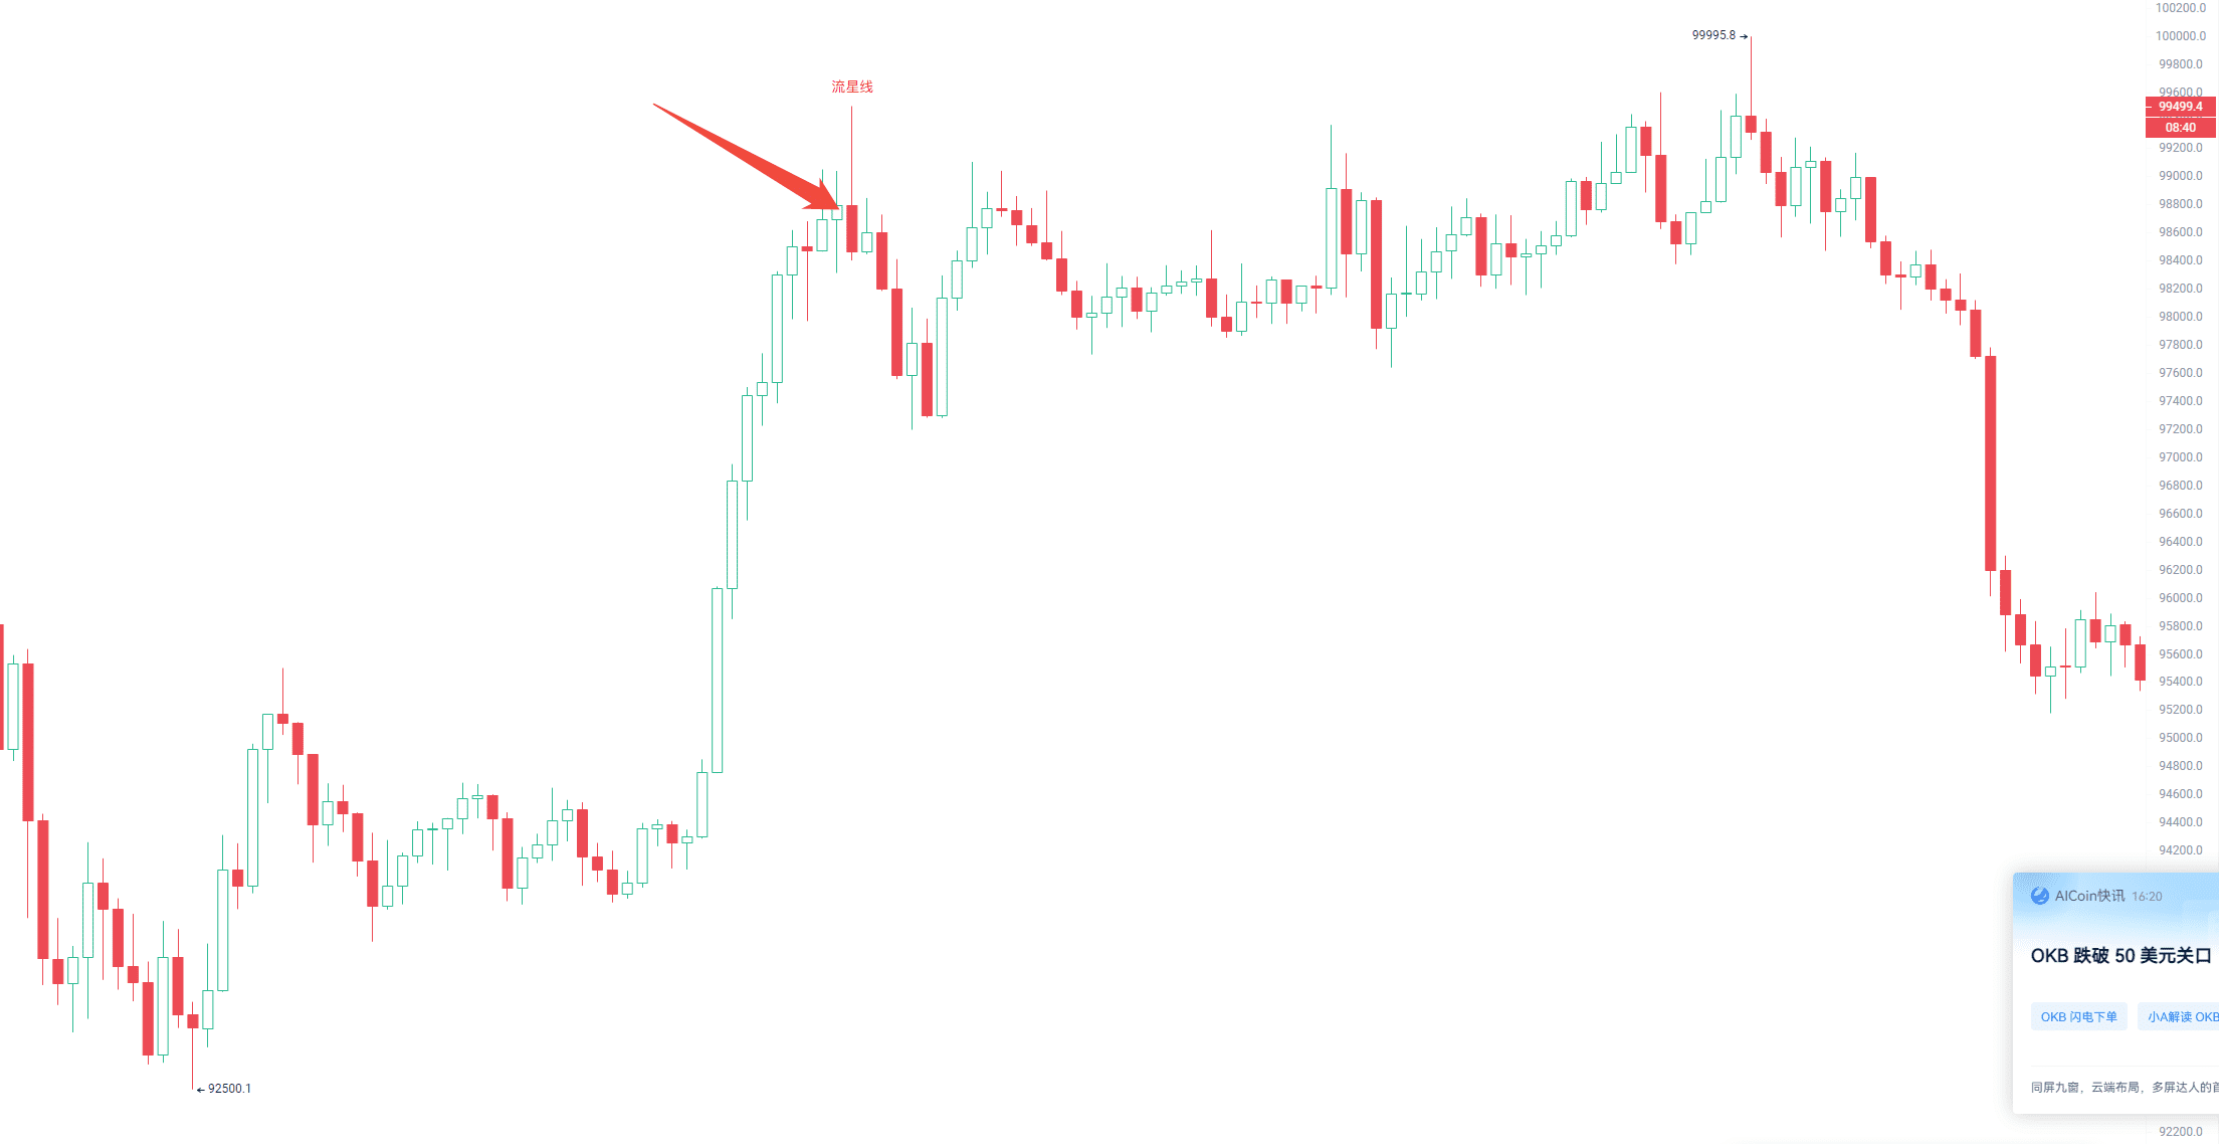
The shooting star also has a small body with a long shadow, but its upper shadow is longer (at least twice the size of the body), and the lower shadow is very short or nonexistent, usually appearing in an uptrend. It indicates that the rise is losing momentum, and the market may be about to turn.

In simple terms, these patterns consist of a small body with a long shadow (not a doji or an evening star) and often serve as reversal signals when they appear at the end of a trend. If you have a fixed trading period, you can directly look at the K-lines corresponding to that period.
Pattern Two: Dark Cloud Cover and Piercing Pattern
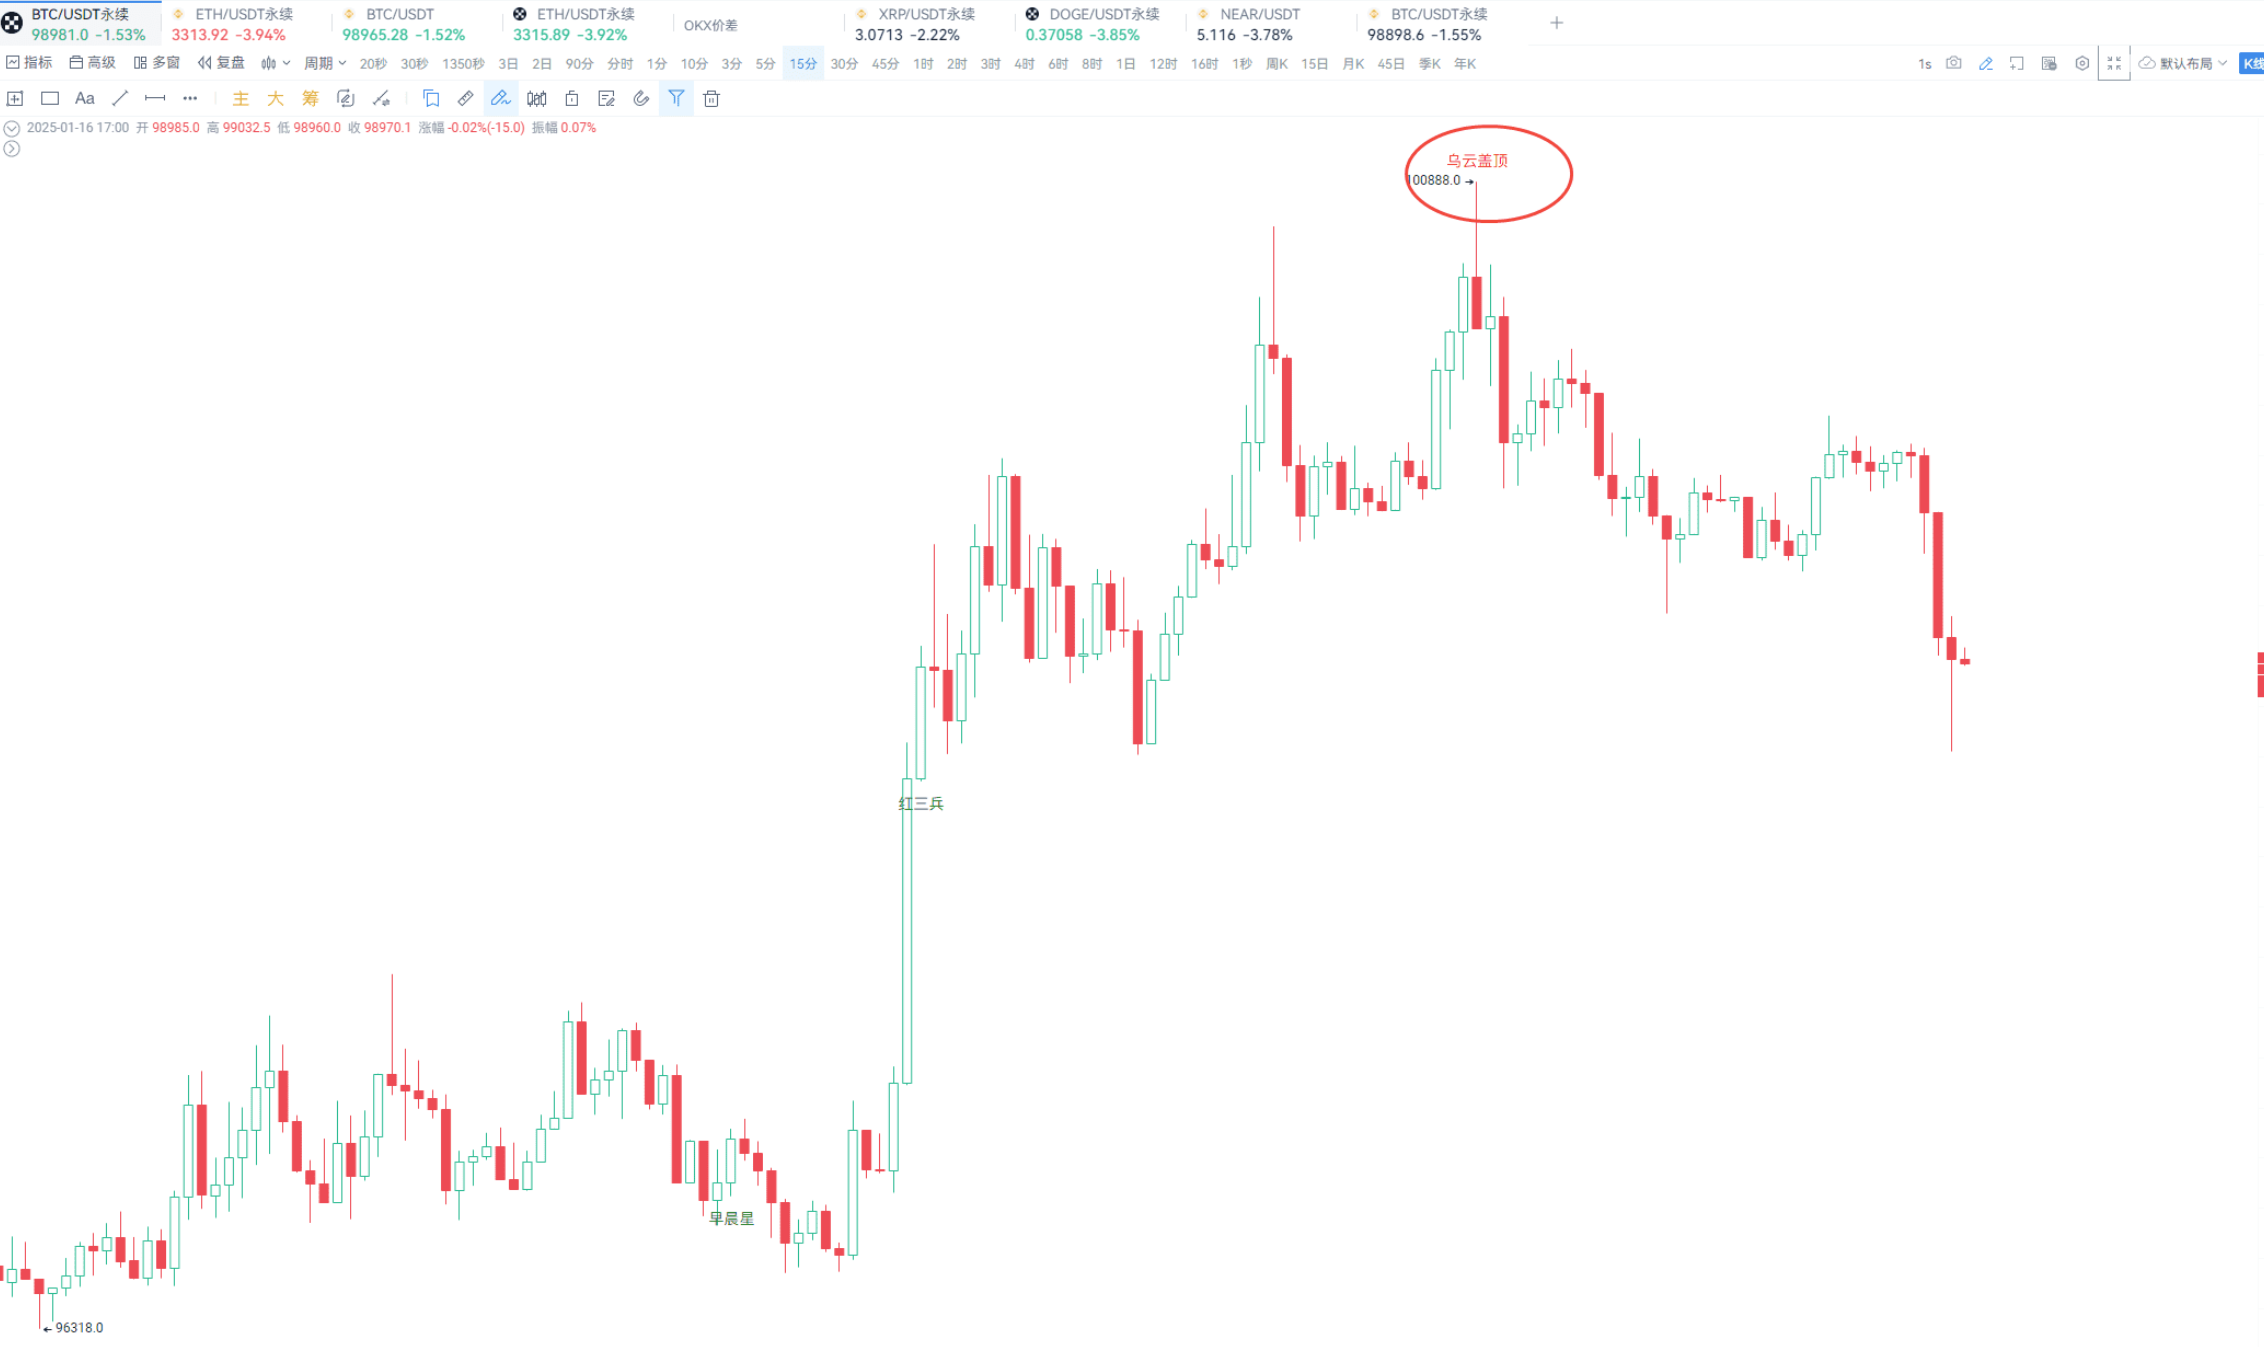
The dark cloud cover usually appears in an uptrend. It consists of two K-lines: the first is a large bullish candle, and the second is a bearish candle that opens above the previous bullish candle's closing price and closes below the halfway point of the previous bullish candle's body. This pattern indicates that the uptrend may be about to end.
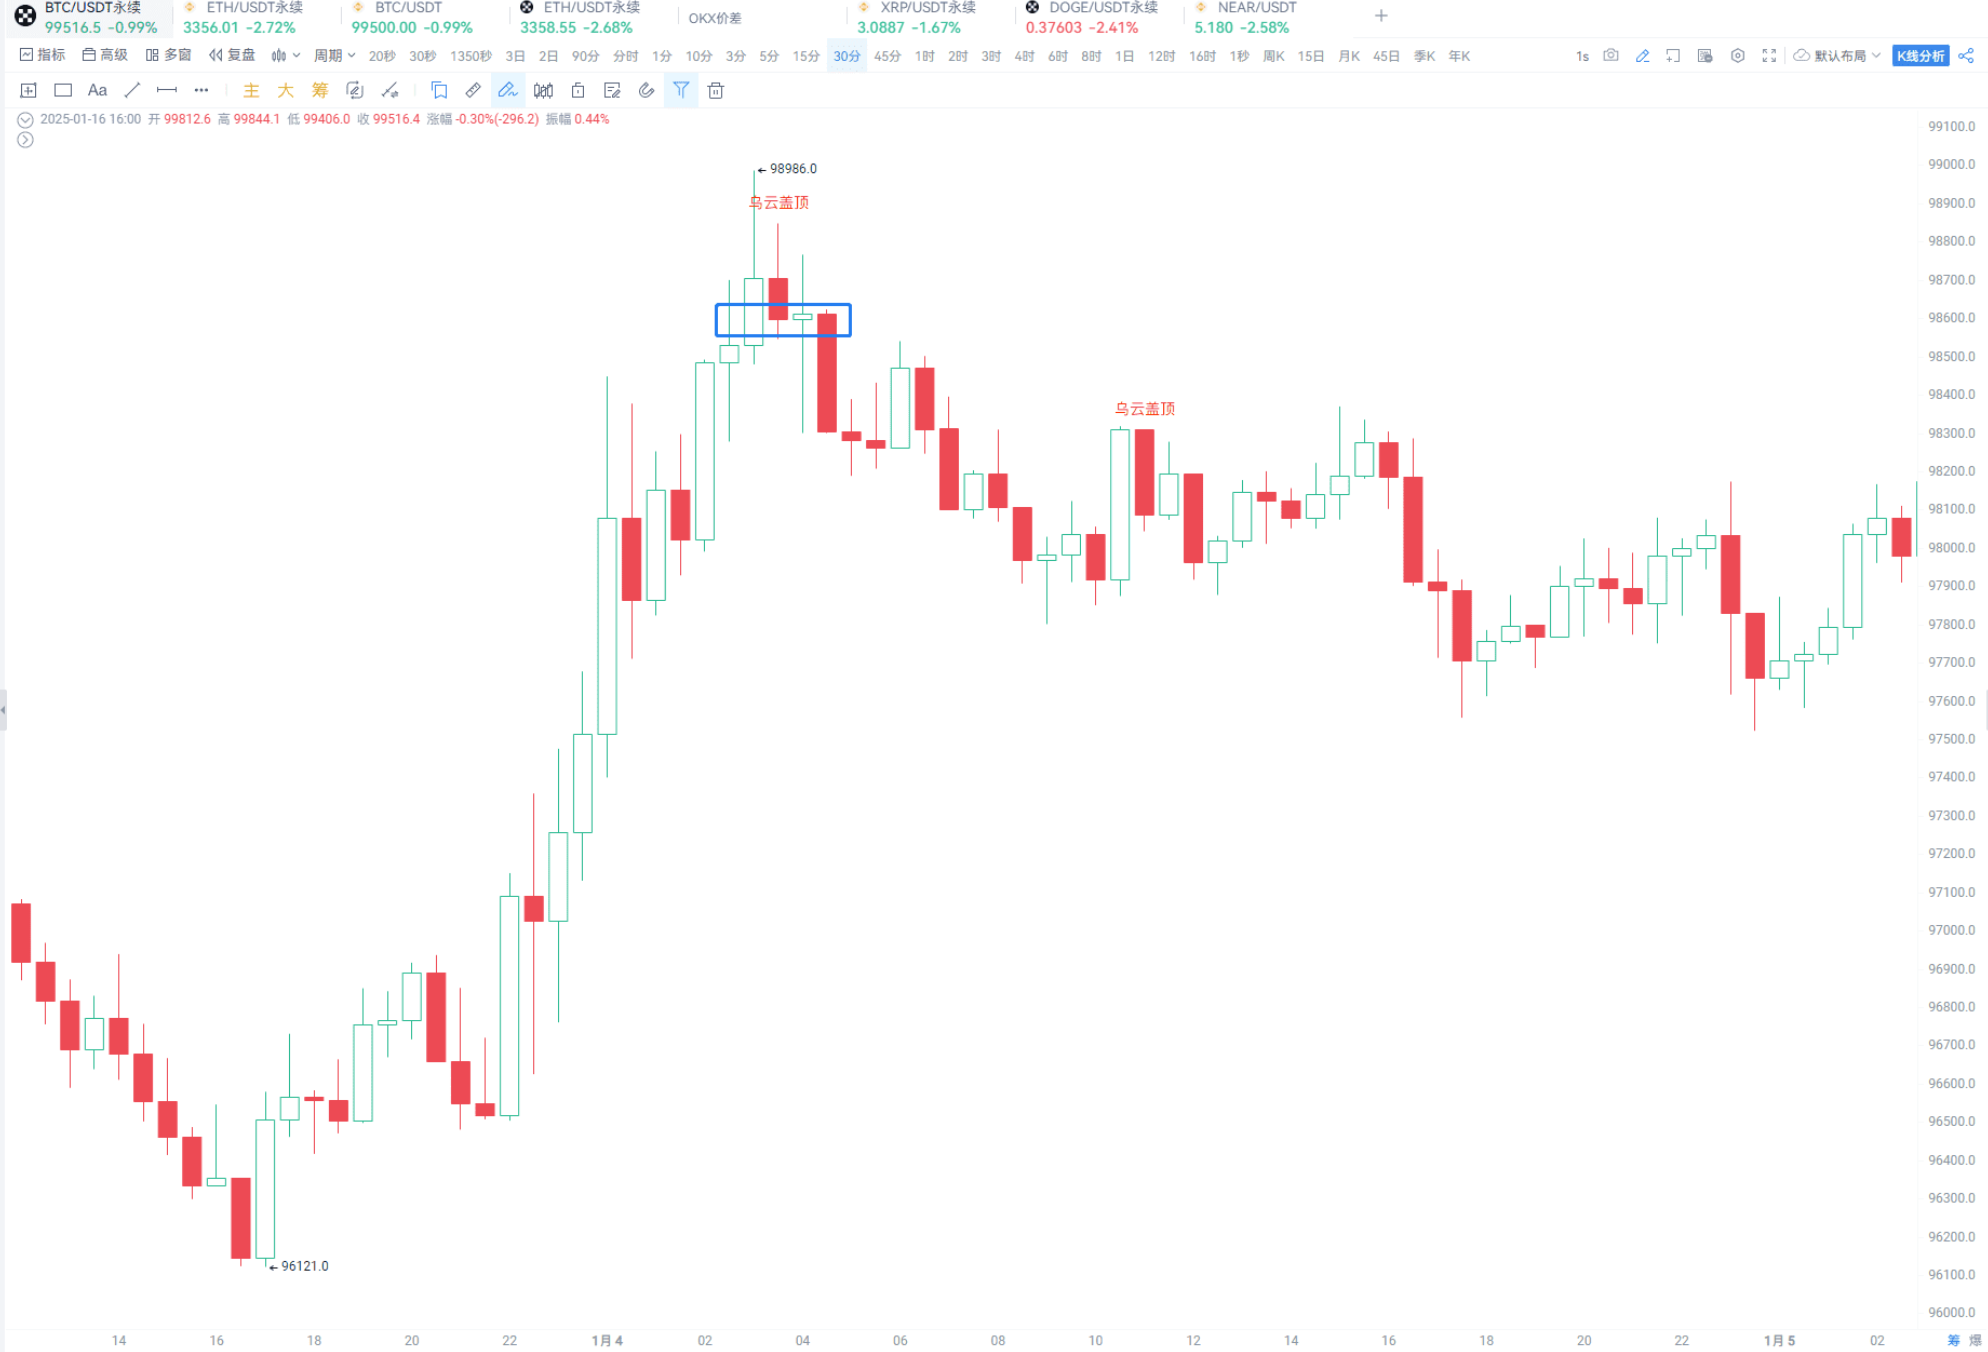
The piercing pattern, on the other hand, usually appears in a downtrend. It also consists of two K-lines: the first is a large bearish candle, and the second is a bullish candle that opens below the previous bearish candle's closing price and closes above the halfway point of the previous bearish candle's body. This pattern indicates that the downtrend may be about to end.
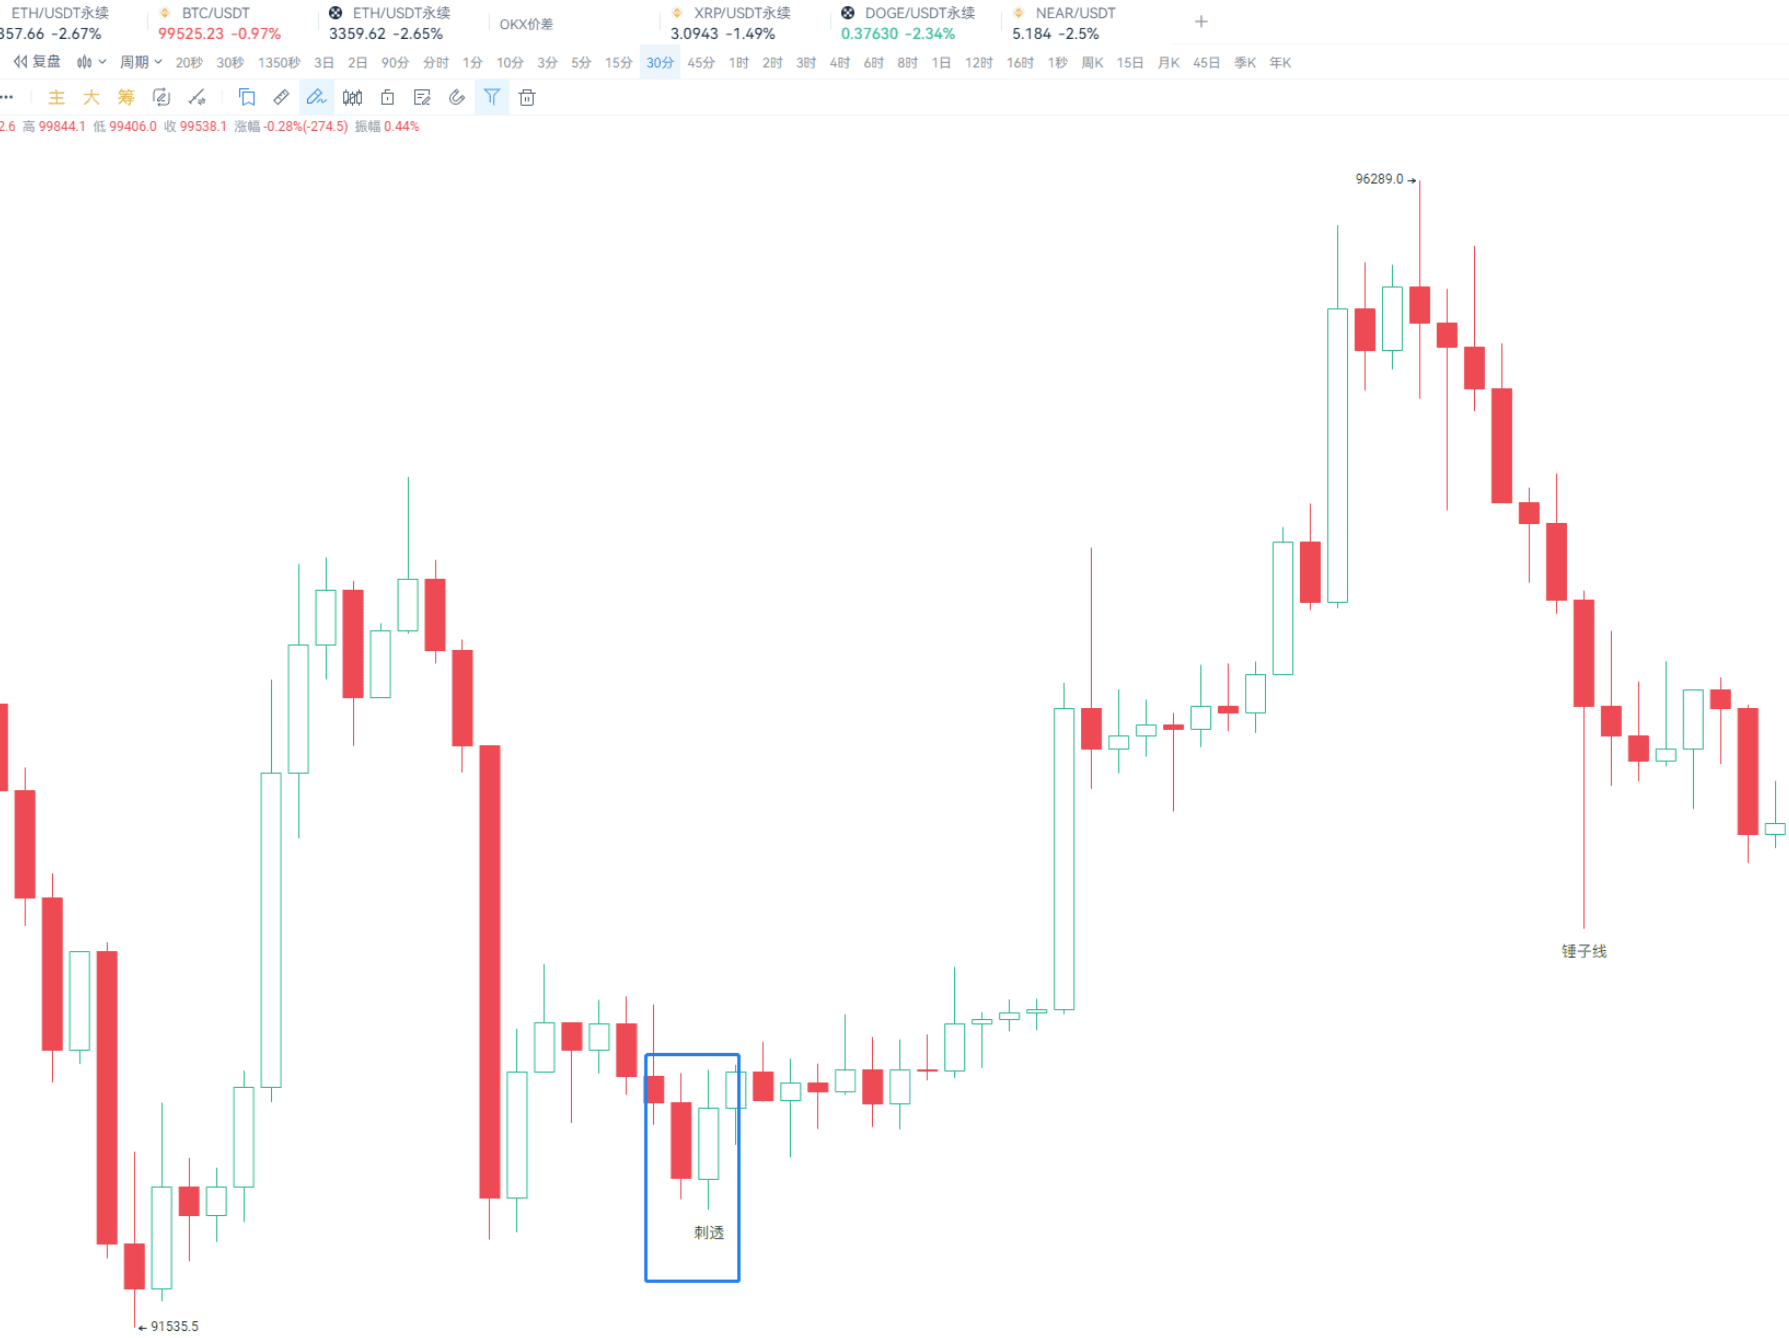
These two patterns are classic reversal signals, and you can find more examples on K-line charts to understand them in conjunction with theory.
Pattern Three: Morning Star and Evening Star
The morning star usually appears in a downtrend and consists of three K-lines. The first is a large bearish candle, the second is a small K-line (which can be either bullish or bearish), often accompanied by a gap down, forming a star shape. The third is a large bullish candle, with the closing price close to or exceeding the halfway point of the first bearish candle's body. Ideally, the second K-line opens lower, and the third K-line opens higher, but in the 24/7 cryptocurrency market, the conditions can be slightly relaxed.
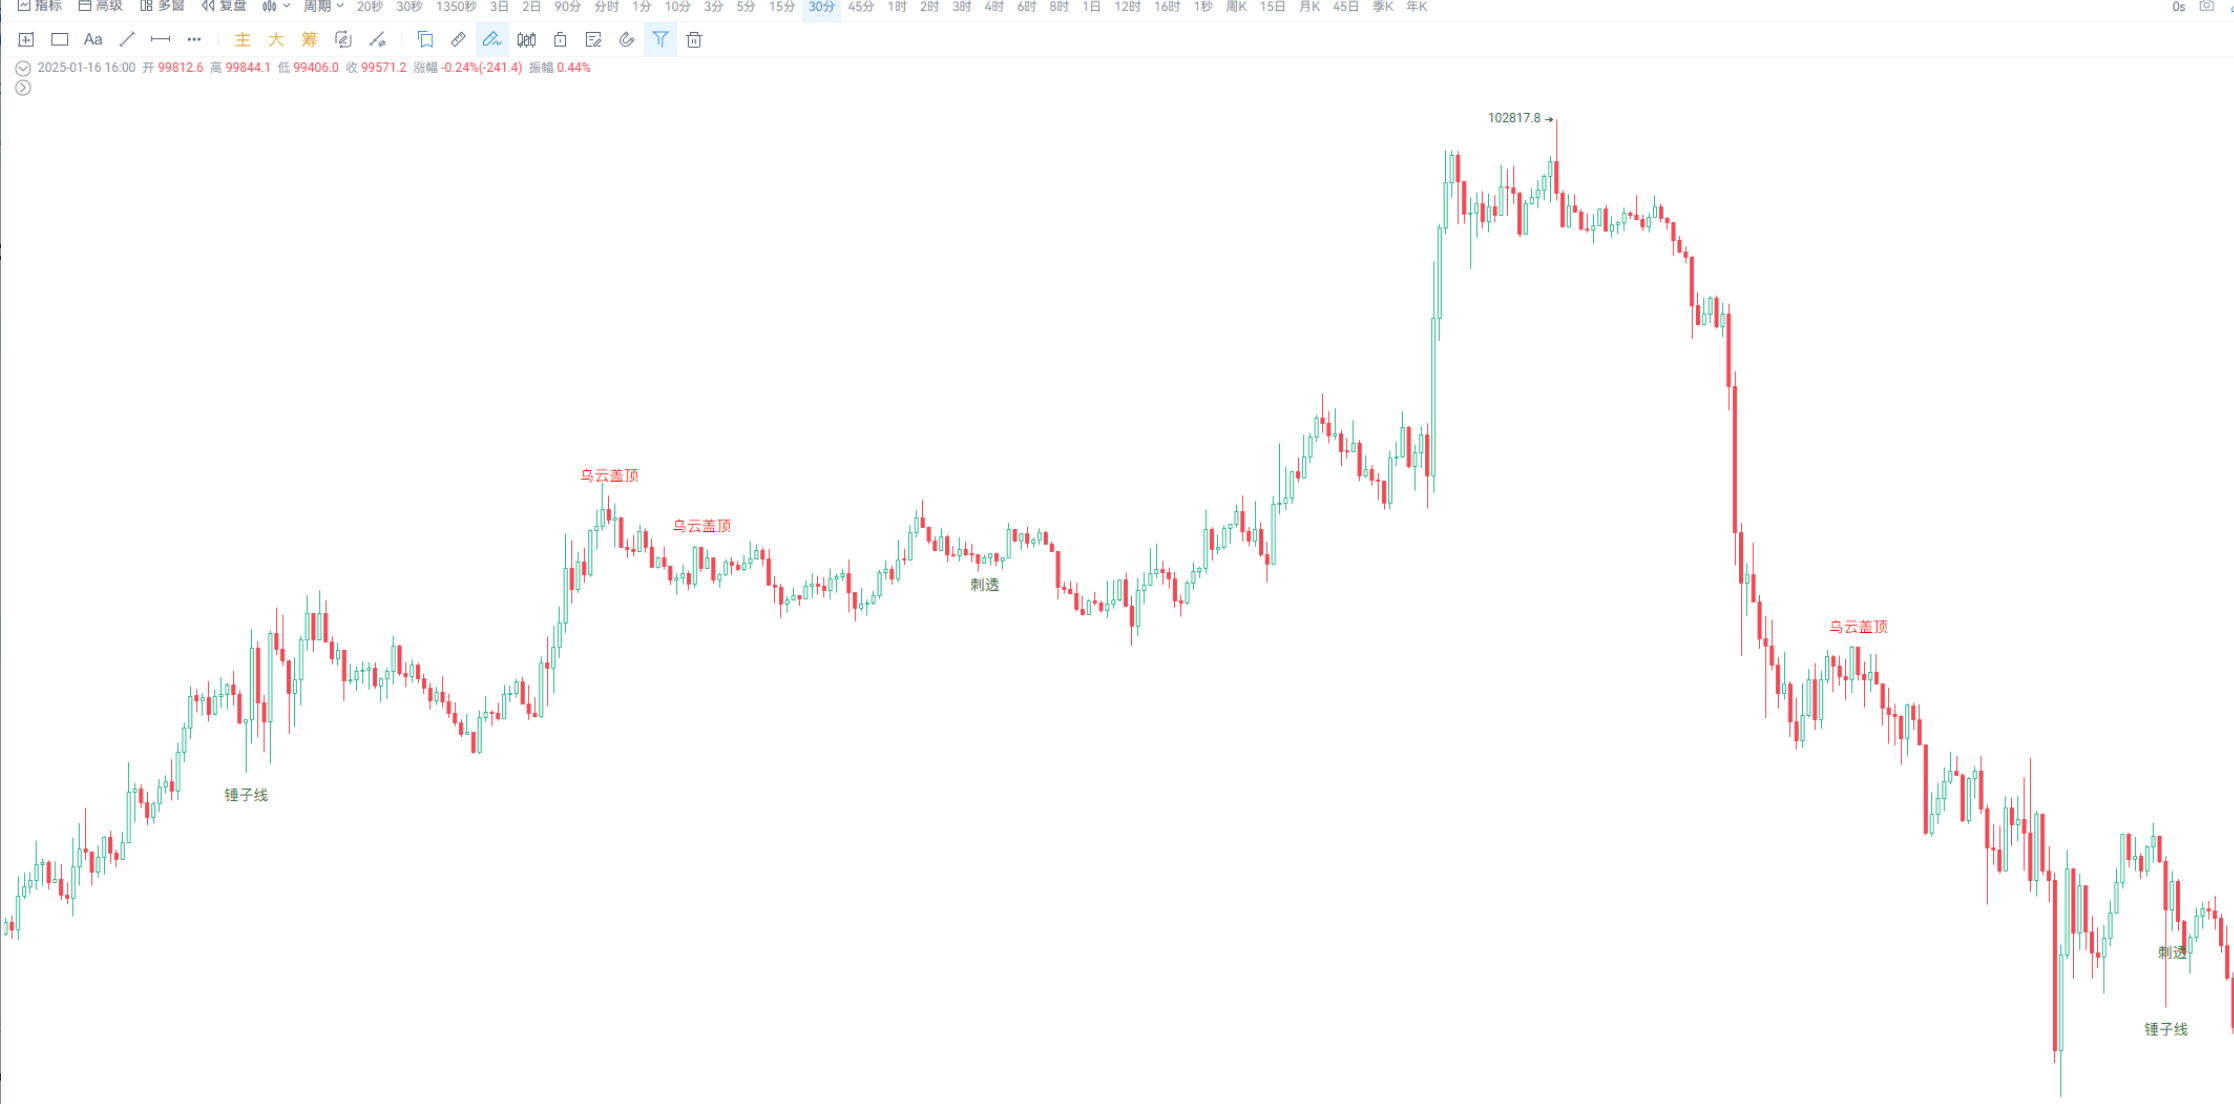
The evening star is the opposite of the morning star and usually appears in an uptrend. It also consists of three K-lines: the first is a large bullish candle, the second is a small K-line (which can be either bullish or bearish), often accompanied by a gap up, forming a star shape. The third is a large bearish candle, with the closing price close to or crossing the halfway point of the first bullish candle's body.
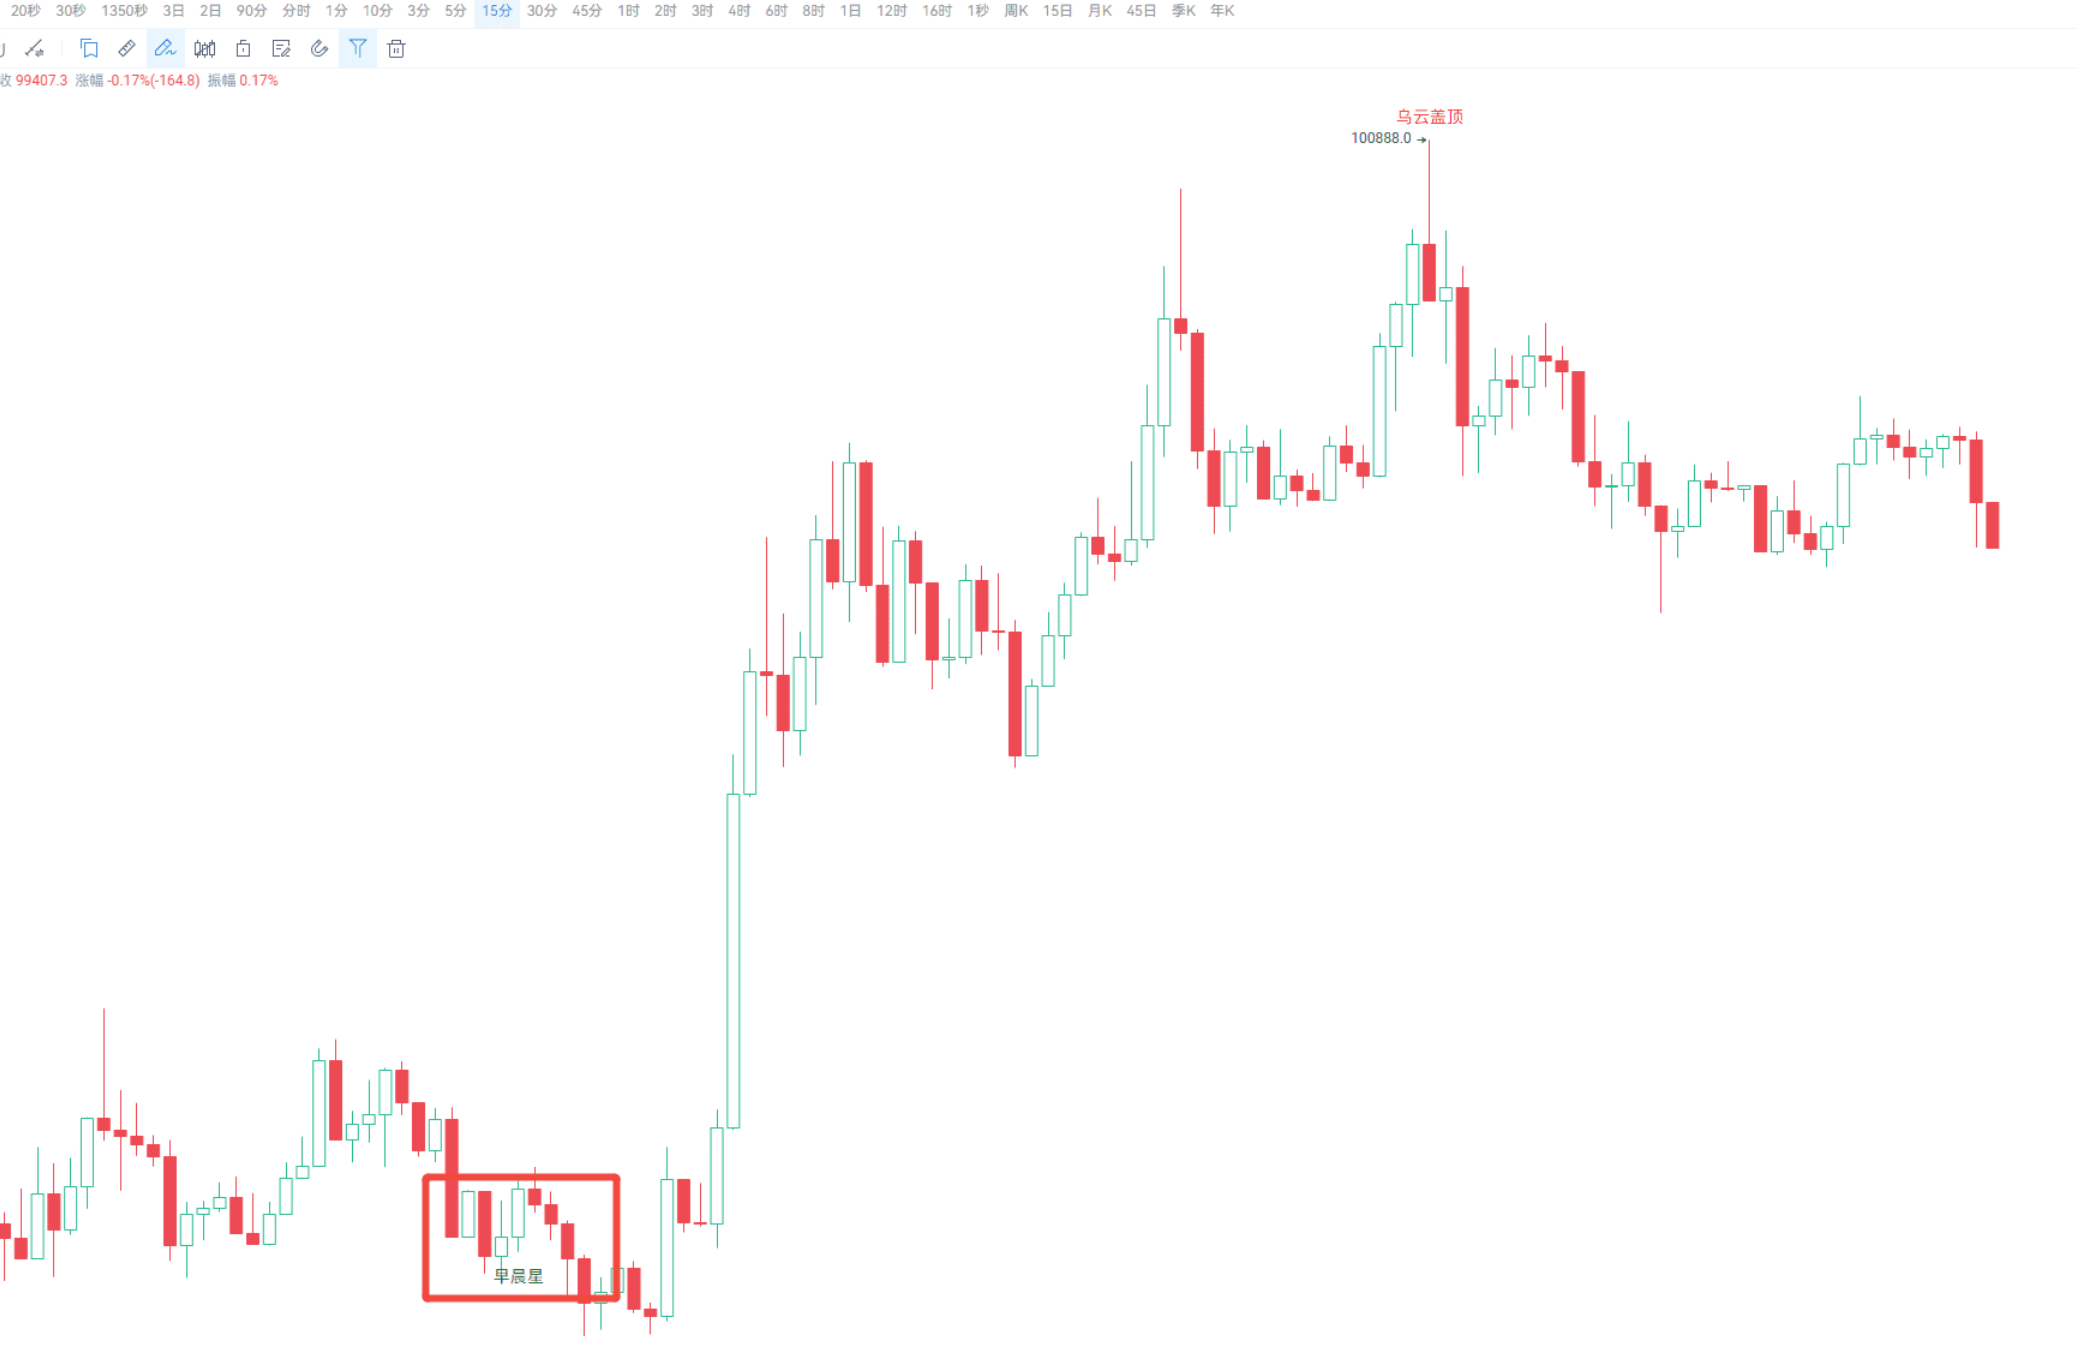
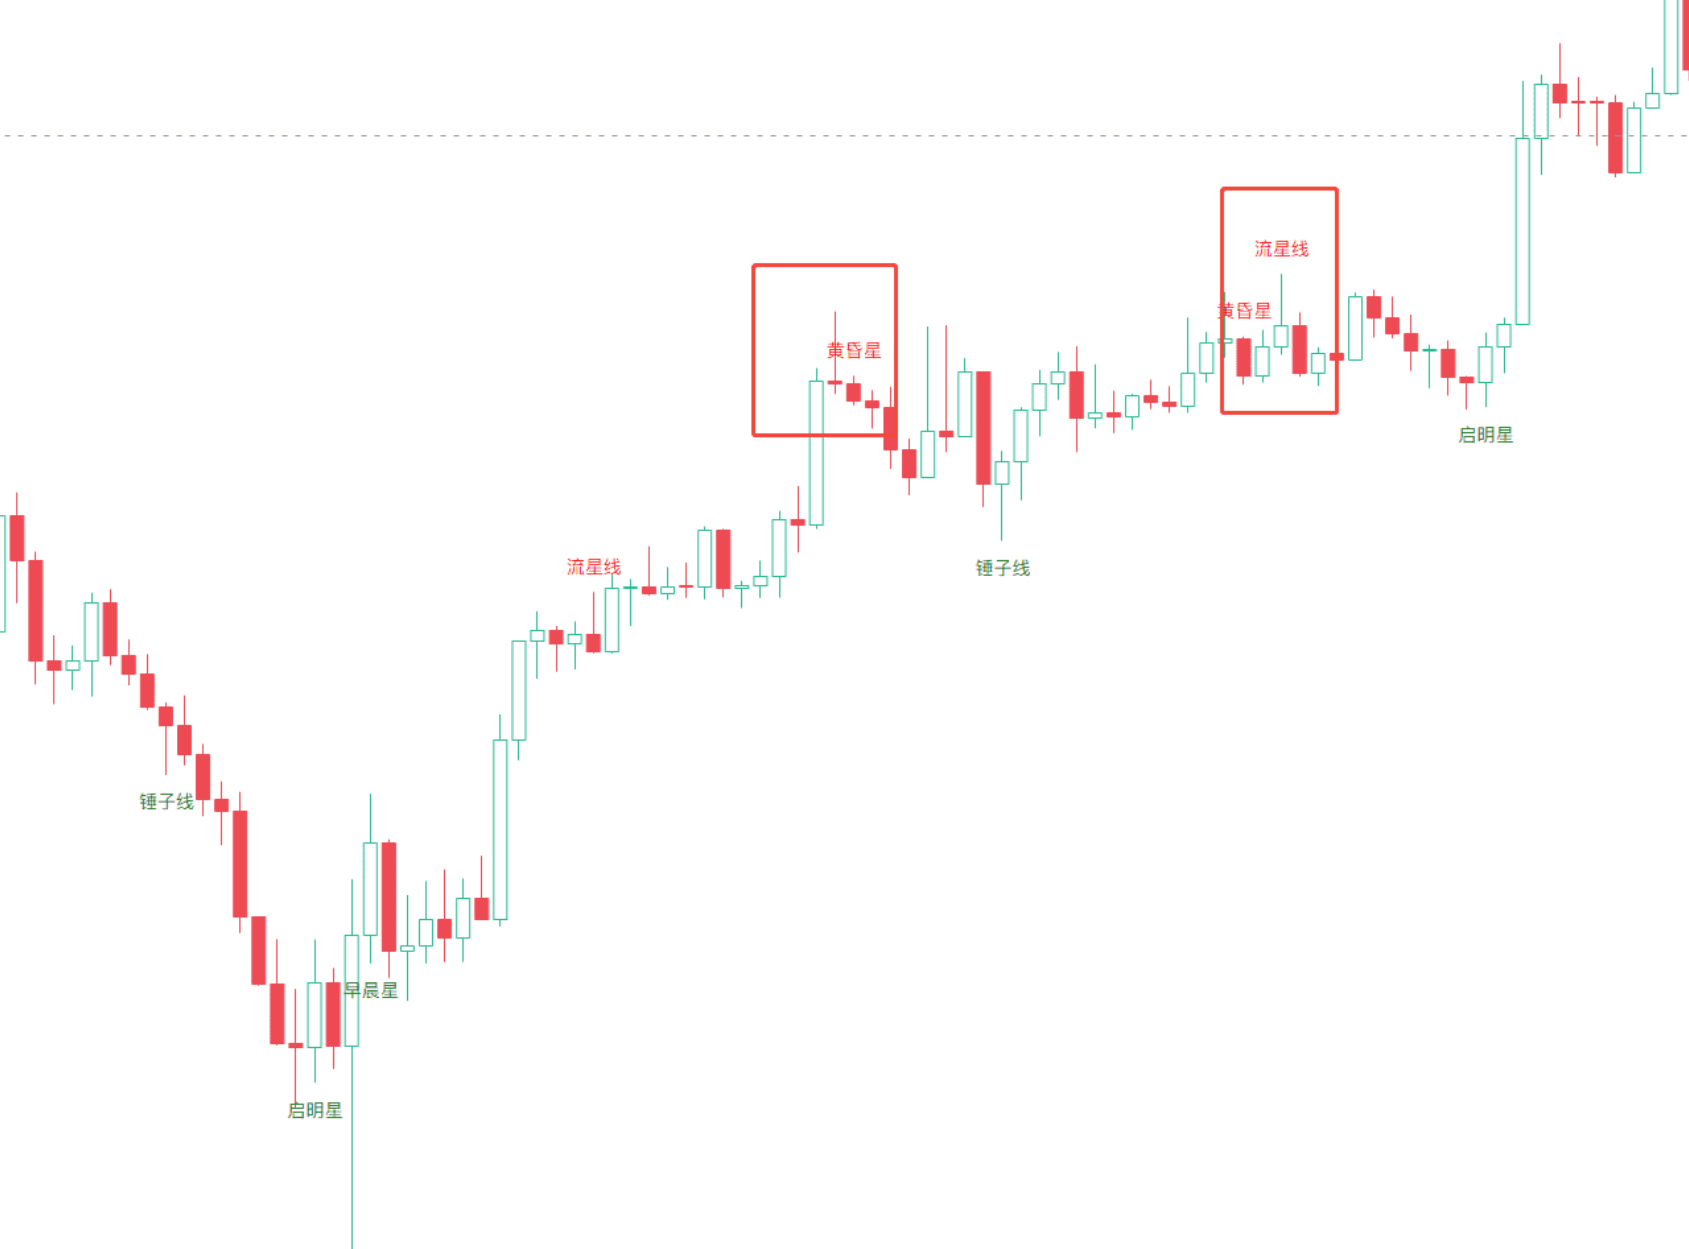
Both of these patterns have a very good reversal effect, especially the morning star and evening star, which can effectively reduce the errors in manual judgment.
Pattern Four: Double Top and Double Bottom
A double top is formed when two or more consecutive K-lines have the same or similar high points, creating a flat top. If two K-lines with long upper shadows appear simultaneously, the effect is even better, signaling a potential top.
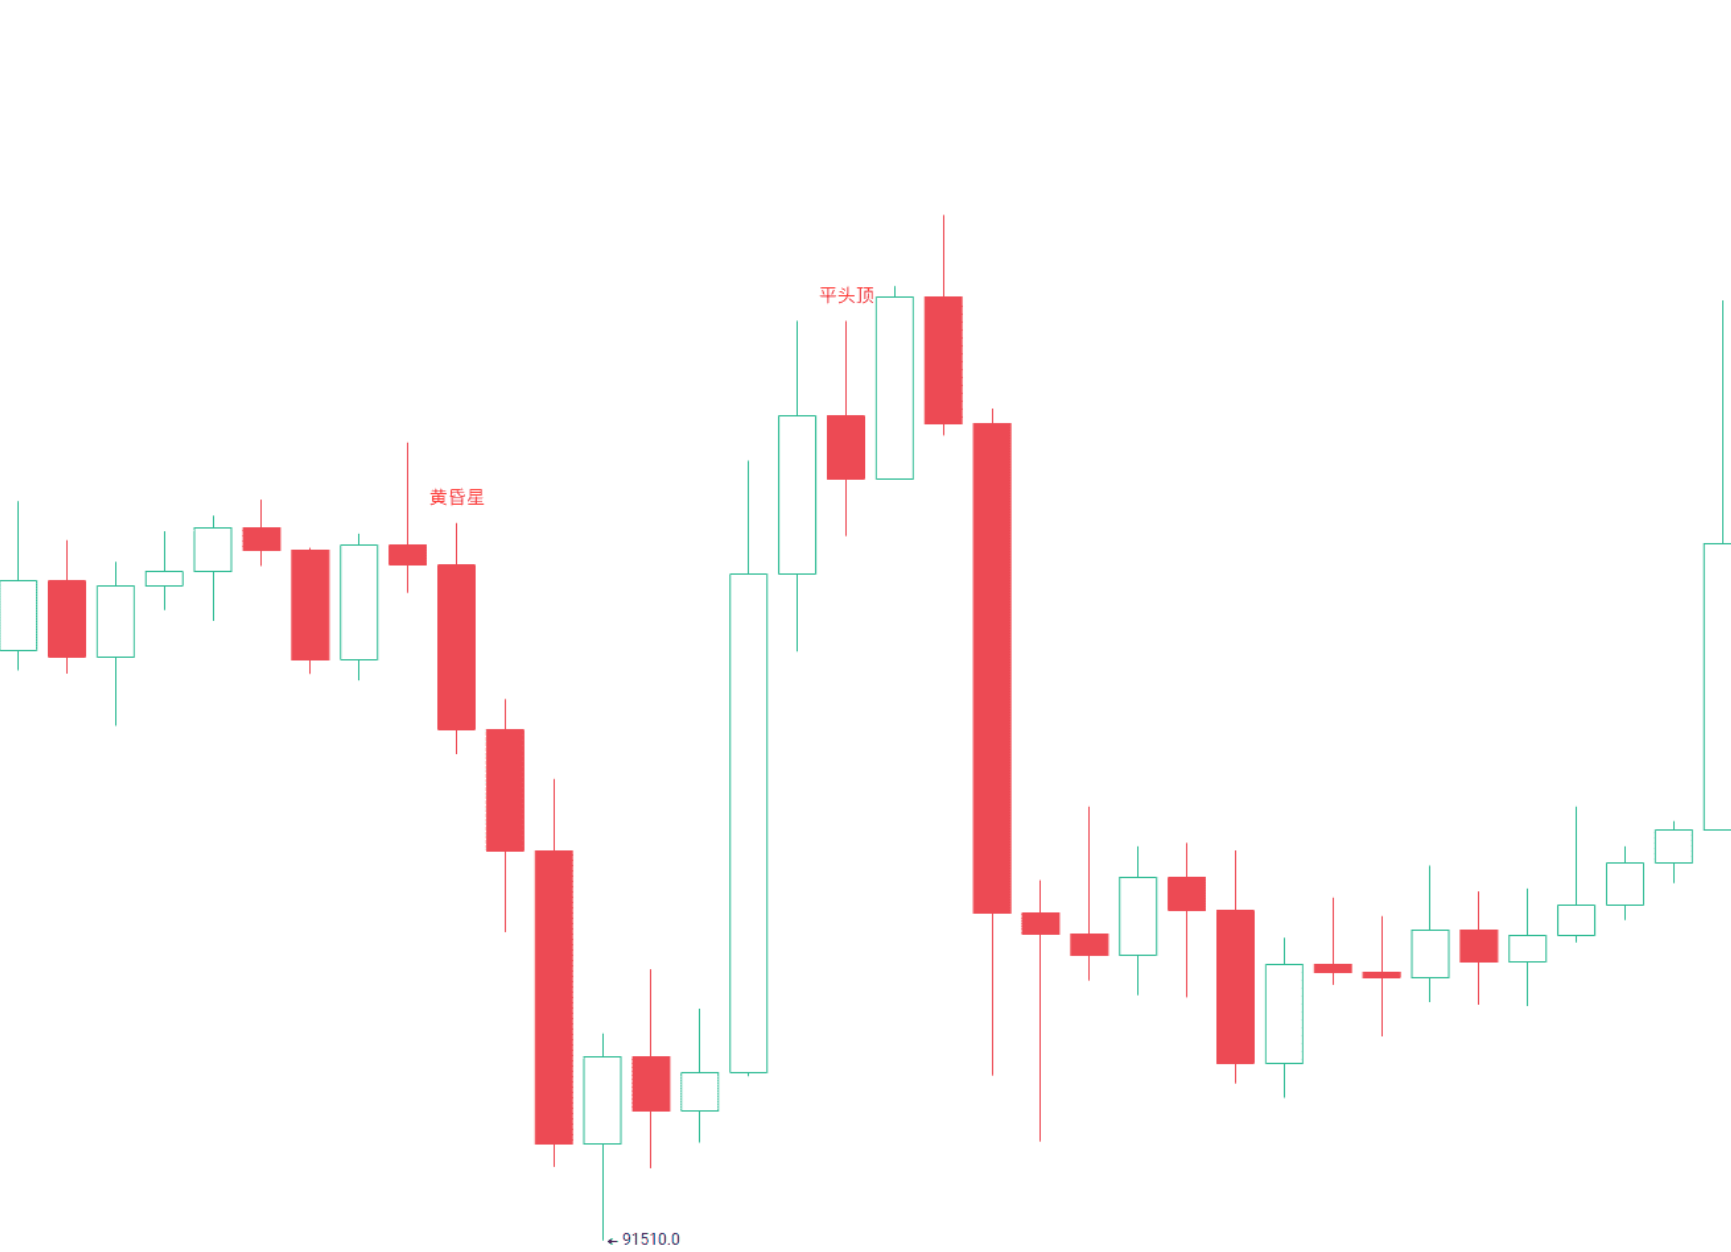
A double bottom is formed when two or more consecutive K-lines have the same or similar low points, creating a flat bottom. If it appears at the bottom of a downtrend, the effect is even better, especially if accompanied by long lower shadows.
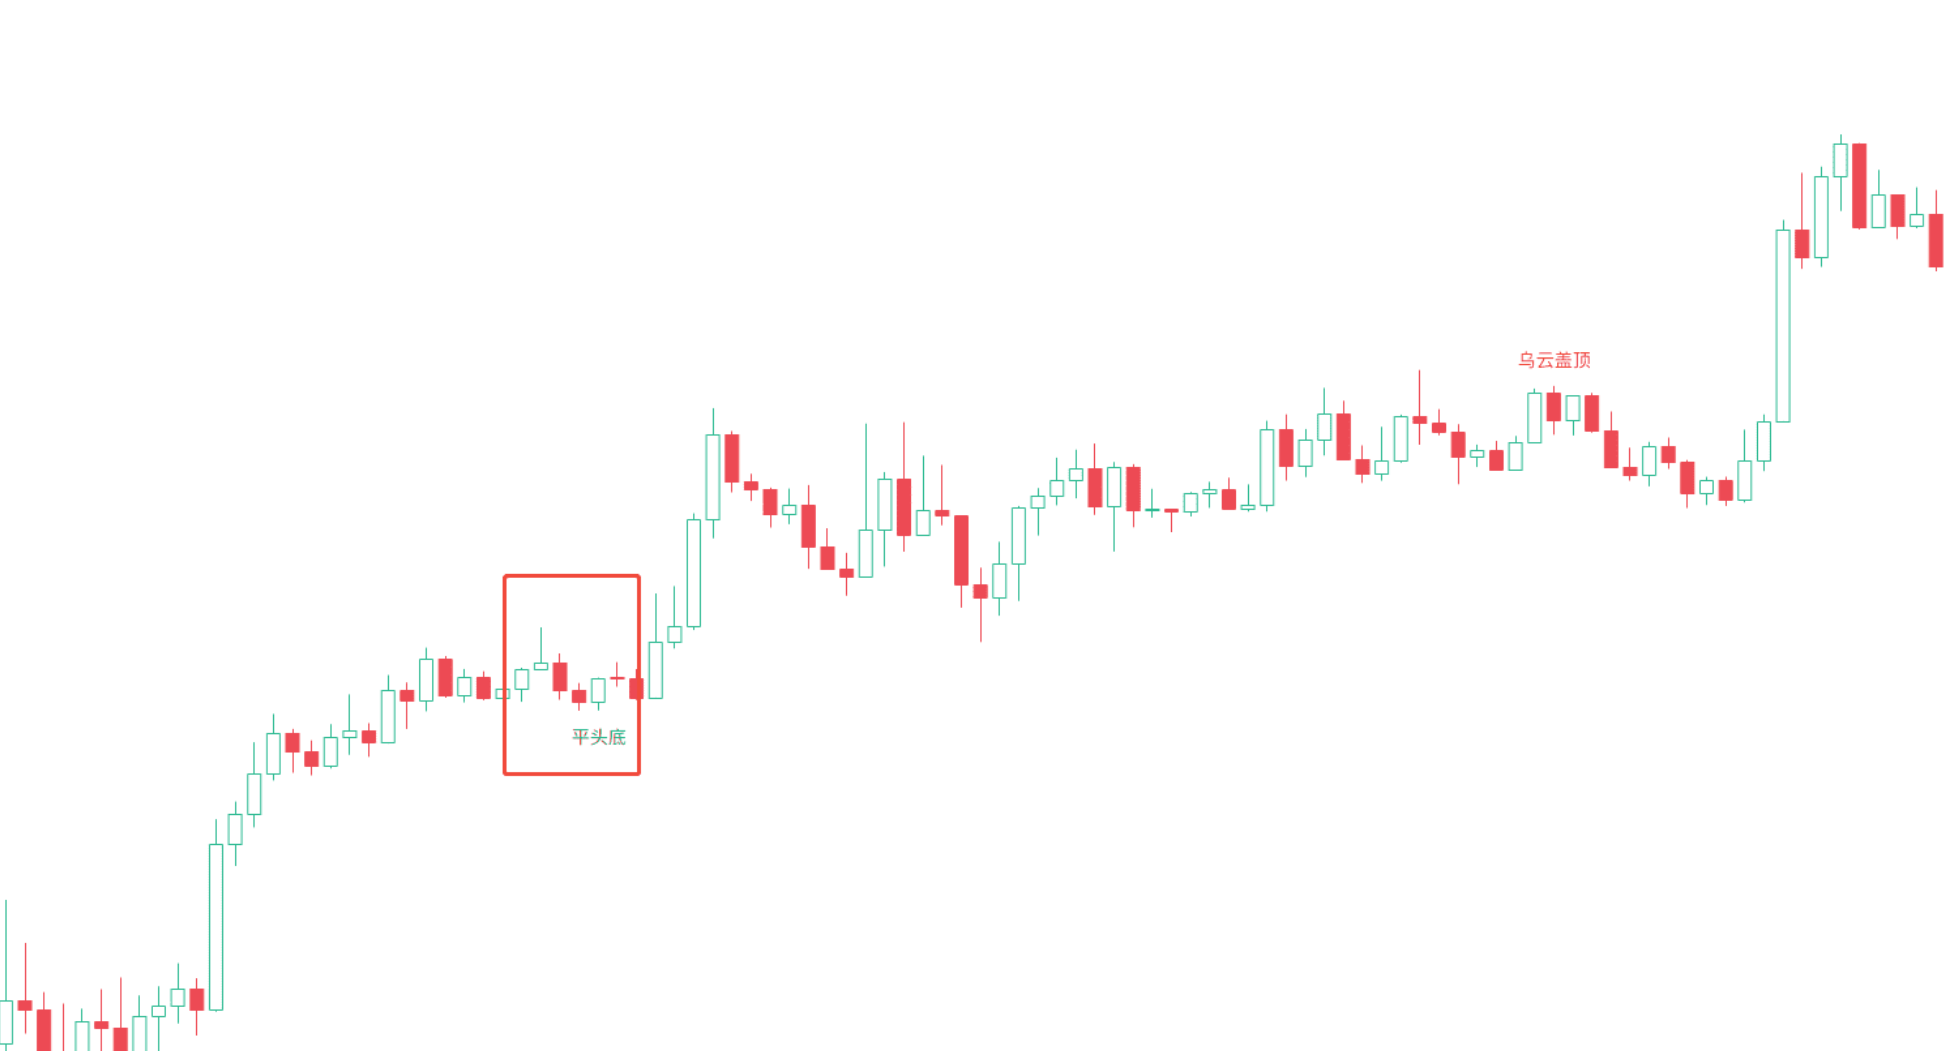
Pattern Five: Three White Soldiers and Three Black Crows
Three white soldiers consist of three consecutive bullish candles, each closing price gradually rising and close to the highest price, with the opening price close to the previous closing price, usually appearing in a downtrend. It indicates that the market may be about to reverse upwards.
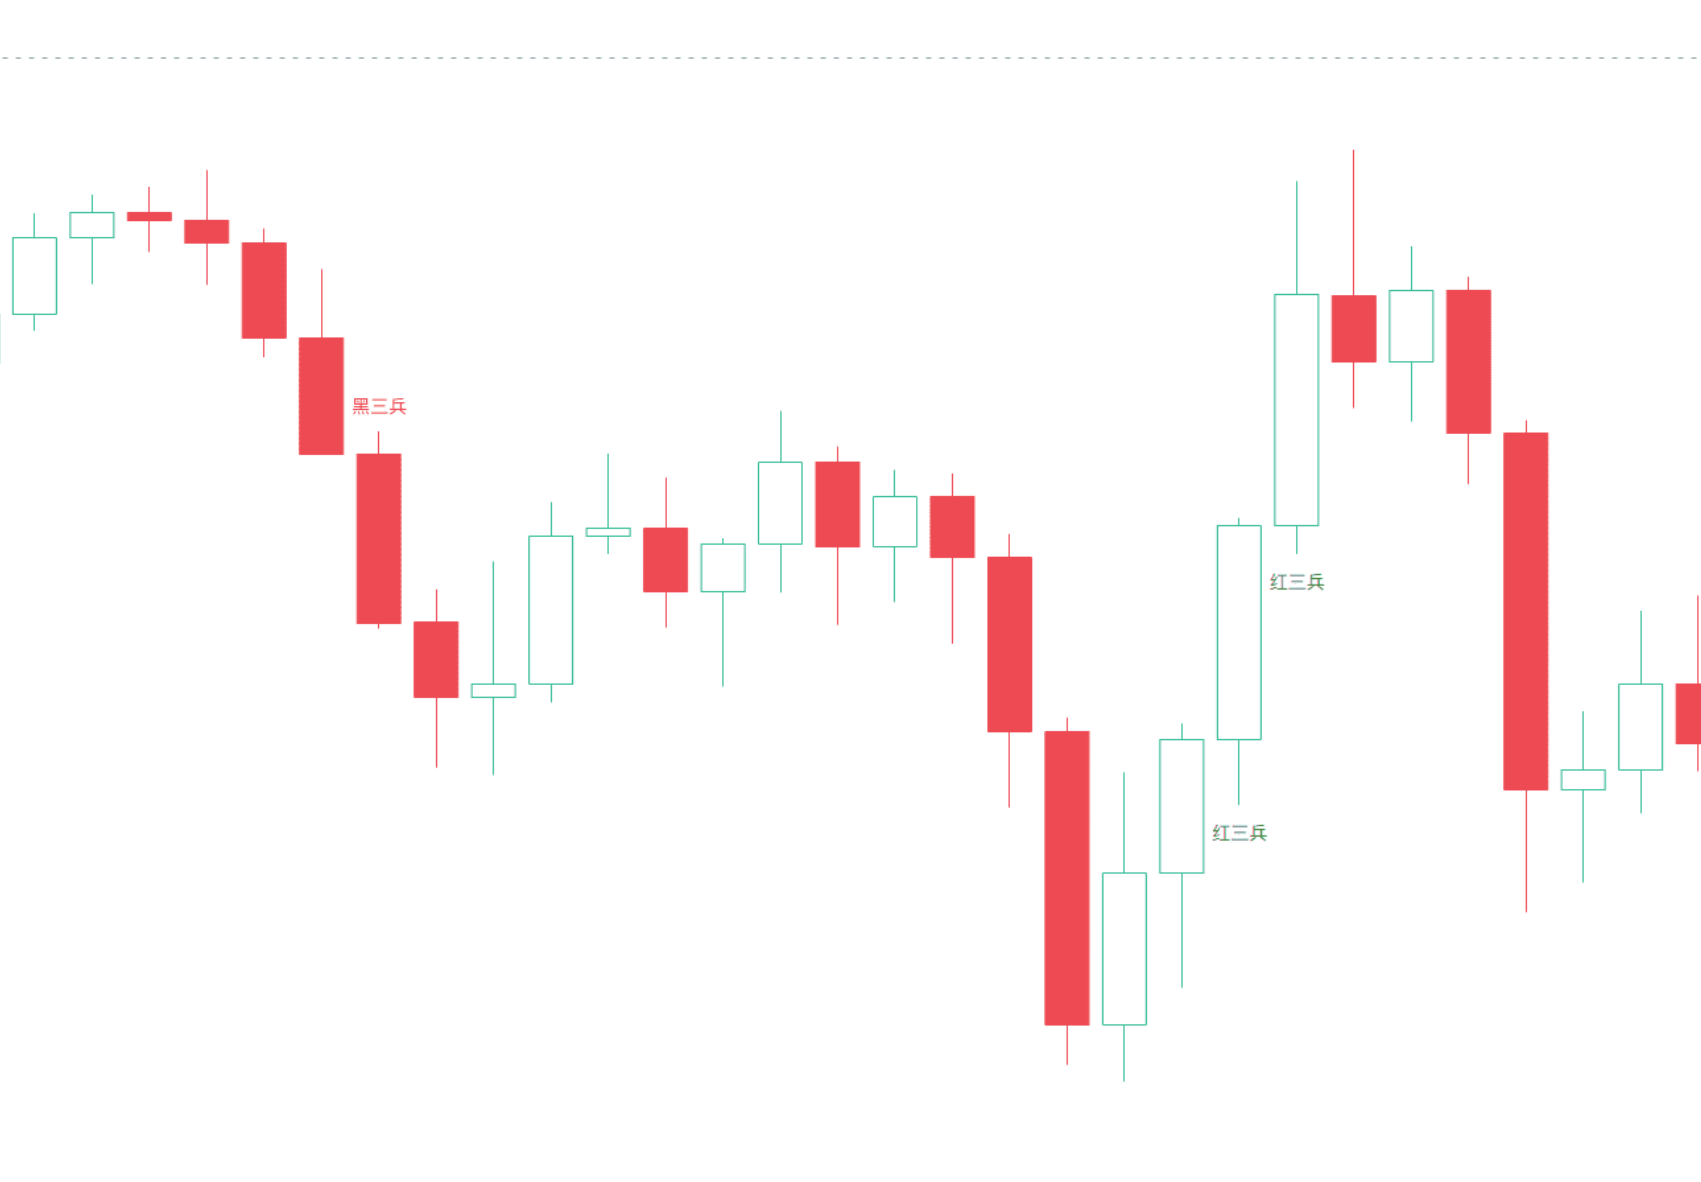
Three black crows consist of three consecutive bearish candles, each closing price gradually falling and close to the lowest price, with the opening price close to the previous closing price, usually appearing in an uptrend. It indicates that the market may be about to reverse downwards.
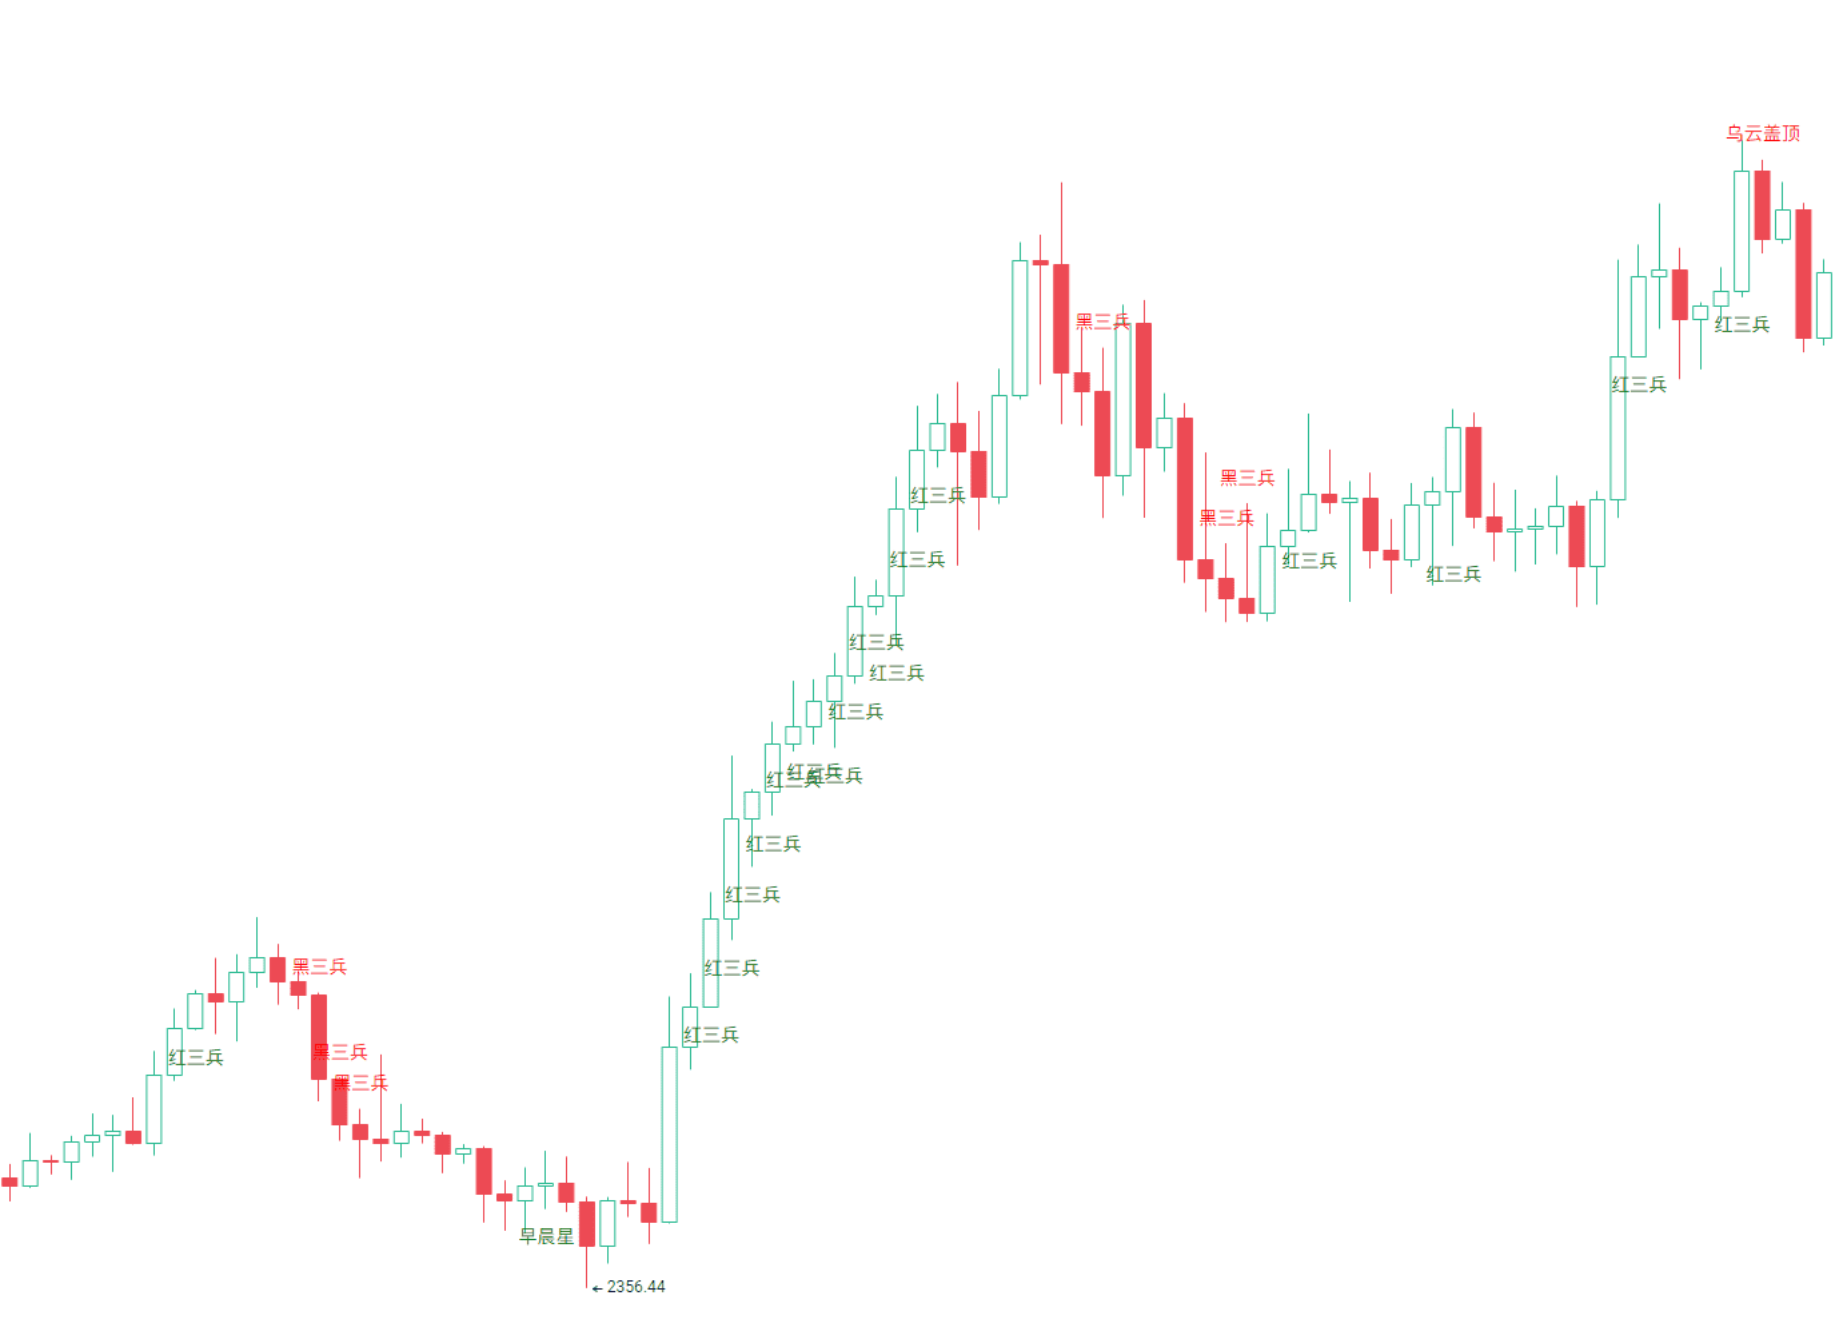
In fact, the three white soldiers and three black crows are just consecutive bullish or bearish K-lines, but the rise or fall must be significant. This pattern is suitable for judging larger trends.
Finally, I would like to summarize a small tip for everyone: short grid after a sharp rise, long grid after a sharp fall, and neutral grid during sideways movement. If you are doing contract grids, be sure to set stop-loss and take-profit levels, or use a trailing grid to prevent grid breakage.

If you can read K-line patterns, for example, if you see a dark cloud cover pattern in the morning, you won't chase the rise. These patterns are signals from the market; once you learn to recognize them, you will be better able to seize trading opportunities.
Risk Warning: The content of this article is for educational purposes only and does not constitute investment advice. Trading should be done with caution, and profits and losses are your own responsibility.
免责声明:本文章仅代表作者个人观点,不代表本平台的立场和观点。本文章仅供信息分享,不构成对任何人的任何投资建议。用户与作者之间的任何争议,与本平台无关。如网页中刊载的文章或图片涉及侵权,请提供相关的权利证明和身份证明发送邮件到support@aicoin.com,本平台相关工作人员将会进行核查。


