Key Points
– The market cycle of Bitcoin reflects growth trends: Despite significant market volatility, Bitcoin's price movements are primarily influenced by institutional capital inflows, macroeconomic factors, and regulatory policies. For example, the market surge on December 4, 2024, highlighted Bitcoin's market resilience.
– Spot Bitcoin ETFs drive institutional adoption: The approval of spot Bitcoin ETFs has unleashed a substantial amount of new capital, reshaping market liquidity and price trends while further enhancing Bitcoin's legitimacy in the eyes of traditional investors.
– Market liquidity and trading dynamics depend on stablecoins and exchange fund flows: USDT plays a crucial role in the Bitcoin trading ecosystem, while the flow of funds between exchanges reflects immediate trader sentiment and market positioning.
– On-chain data and macro factors influence Bitcoin's future: Indicators such as the Bitcoin Network Activity Index (BNI), scaling solutions, regulatory policies, and the global economic environment will continue to impact Bitcoin's long-term adoption and price trends.

Over the past decade, Bitcoin has evolved from a niche digital experiment into a mainstream financial asset. This rise has been driven primarily by a surge in investor demand, rapid technological advancements, and a need for alternatives to traditional monetary systems. However, Bitcoin's growth has been accompanied by dramatic price increases and deep corrections, including market turbulence in early 2025. To understand these fluctuations, it is essential to analyze several key factors, such as:
– Unprecedented demand surge (e.g., the market explosion on December 4, 2024)
– How spot Bitcoin ETFs are changing the institutional investment landscape
– Patterns of fund flows between exchanges, providing insights into trader behavior
– Stablecoins (especially Tether's USDT) as pillars of market liquidity
– On-chain indicators, such as the Bitcoin Network Activity Index (BNI)
This article connects these factors to present a comprehensive perspective, analyzing Bitcoin's price trends, liquidity changes, and market adoption rates, explaining why they fluctuate so dramatically.
Table of Contents
Bitcoin's Market Volatility in 2025: Corrections After a Strong Start
December 4, 2024: A Historic Surge in Demand
– Unprecedented trading volume
– Key drivers of the demand surge
– The impact of this event on Bitcoin's liquidity and market maturity
Spot Bitcoin ETFs: Unlocking a Flood of Institutional Capital
– Differences between spot ETFs and futures ETFs
– Institutional capital inflows and market impact
– Psychological and structural changes in Bitcoin adoption
Fund Flows Between Exchanges: Interpreting Trader Movements
– How traders transfer Bitcoin between platforms
– Fund flows in spot exchanges vs. derivatives exchanges
– Case study: Market reactions to ETF approvals
Stablecoins as Market Pillars: The Rise of USDT
– The role of USDT in liquidity and trading
– Market impact and the growing adoption rate
– Controversies and regulatory scrutiny
Bitcoin Network Activity Index (BNI): An Overview of On-Chain Health
– Key indicators: Active addresses, transaction volume, and fees
– How BNI reflects market sentiment
– Limitations of BNI and auxiliary data indicators
How Internal and External Factors Affect Bitcoin's Development
– Protocol upgrades and scaling solutions
– Miner behavior and its impact on the market
– Macroeconomic trends: Monetary policy, regulation, and global stability
Outlook and Potential Catalysts
Bitcoin's Market Volatility in Early 2025: Corrections After a Strong Start
In early 2025, Bitcoin's price movements reflected the influence of institutional capital flows, macroeconomic trends, and regulatory policies, experiencing a significant correction after reaching new highs.
Bitcoin Price Movements (January to March 2025)
– January 2025: Opening price $93,576, reaching an all-time high of $109,500 on January 20, and closing at $102,260 (+9.3%).
– February 2025: Price dropped by 17.6%, marking the largest monthly decline since June 2022, closing at $78,310, primarily due to a slowdown in institutional capital inflows.
– March 2025 (as of March 6): Rebounded to $94,000, driven by optimistic market expectations regarding regulatory policies.
Spot Bitcoin: BTC/USDT Spot
Key Drivers of Bitcoin's Price Changes in Early 2025
Institutional Profit-Taking and ETF Impact
– The January increase was primarily driven by inflows into spot Bitcoin ETFs.
– The February decline reflected institutional profit-taking, leading to a drop in Bitcoin's price.
Macroeconomic and Regulatory Uncertainty
– Speculation surrounding U.S. monetary policy and crypto regulation made market sentiment cautious.
– Inflation concerns suppressed the performance of risk assets, including Bitcoin.
Retail Market Response and Recovery
– After the price drop in February, retail investors re-entered the market, driving a rebound in March.
– The recovery trend indicates that the market remains confident in Bitcoin's long-term potential.
Why Is This Important?
The market volatility of Bitcoin in early 2025 continued the trend from late 2024, particularly the demand surge on December 4, 2024. Institutional investment, macroeconomic pressures, and regulatory policy uncertainties remain core factors influencing the market.
December 4, 2024: A Historic Surge in Demand
In Bitcoin's recent history, December 4, 2024, marked an unprecedented surge in trading demand. On that day, Bitcoin's trading volume reached 279,000 BTC, far exceeding trading peaks during previous bull markets. This event underscored Bitcoin's appeal to both retail and institutional investors while demonstrating its market influence capable of attracting global attention.
Image Credit: CryptoQuant
Key Drivers of the Demand Surge
Optimistic Expectations for Regulatory Policies
The results of the U.S. presidential election indicated that the new government might adopt a more favorable stance toward cryptocurrencies. The market widely anticipated that the new administration would promote more lenient crypto policies, attracting hedge funds and small to medium-sized investors to enter the market rapidly.
Macroeconomic Pressures
Ongoing inflation concerns and economic uncertainty have led many investors to view Bitcoin as a safe-haven asset, further driving its "digital gold" narrative. This has resulted in a flow of funds from traditional safe-haven assets into Bitcoin, intensifying market inflows.
Retail FOMO (Fear of Missing Out)
As Bitcoin prices soared, a significant influx of retail capital entered the market to avoid "missing the opportunity." The influence of social media and crypto KOLs further amplified market enthusiasm, ultimately leading to a near-vertical rise in price and trading volume.
Why Is This Important?
The demand peak on this day served as a crucial stress test for Bitcoin's liquidity. Exchanges had to cope with record trading volumes, indicating a marked improvement in market maturity compared to previous bull markets.
Technological upgrades (such as scaling solutions) played a key role in helping the network handle high trading volume demands.
The combination of institutional and retail enthusiasm made December 4, 2024, a pivotal moment for understanding Bitcoin's potential and volatility.
Spot Bitcoin ETFs: Unlocking a Flood of Institutional Capital
Institutional interest in Bitcoin has been growing for years, but the approval of spot Bitcoin ETFs in January 2024 marked the official beginning of a new era of substantial institutional capital inflows.
Differences Between Spot ETFs and Futures ETFs
– Spot ETFs directly hold actual Bitcoin and reflect real-time market prices. In contrast, futures ETFs track the prices of Bitcoin contracts, which may lead to "rollover costs" and price discrepancies.
– Spot ETFs lower the investment threshold, allowing large funds, pension plans, and even ordinary investors to participate without managing private keys or directly using cryptocurrency exchanges.
Record Daily Purchase Volume
– In November 2024, spot ETFs purchased a total of 18,000 BTC in a single day, marking a milestone that indicated a significant influx of new capital into the market.
– Asset management giants like BlackRock and Fidelity are actively competing for market share, continuously purchasing Bitcoin through ETFs. This further reduces the circulating supply on exchanges, driving up Bitcoin price momentum.
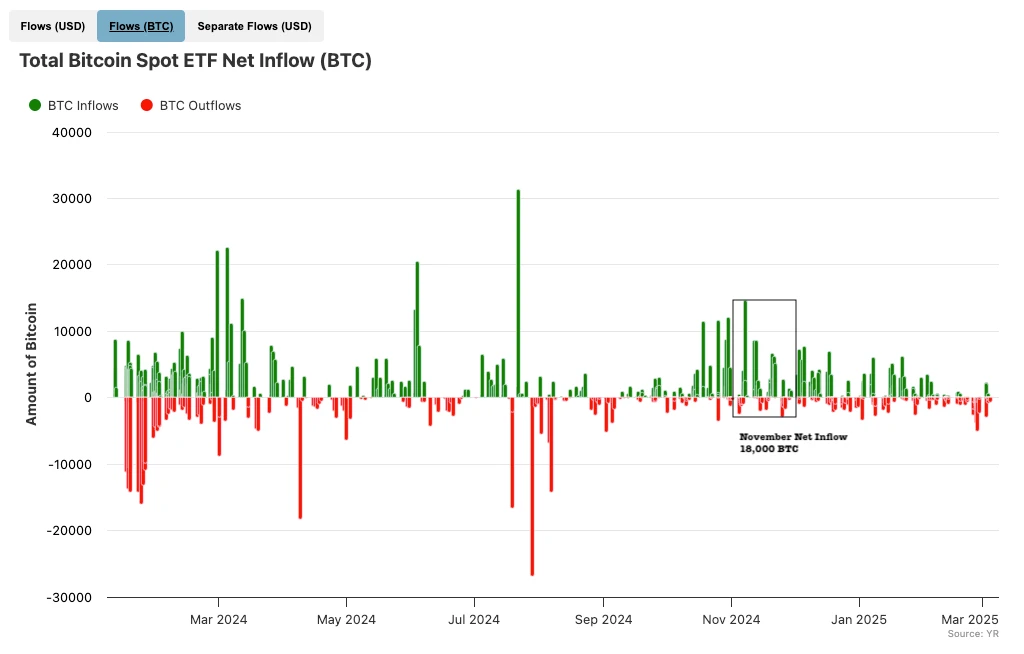
Image Credit: BitBo
Psychological and Market Impact
– The presence of well-known financial institutions holding actual Bitcoin lends greater legitimacy to BTC in the eyes of skeptics.
– ETF capital inflows are typically accompanied by a reduction in Bitcoin supply on exchanges, which may further drive up prices when demand rises.
Today, spot ETFs have become a crucial tool for the mainstreaming of Bitcoin, successfully connecting Wall Street capital with the cryptocurrency ecosystem.
Analyzing Trader Movements: Inter-Exchange Fund Flows
While the inflow of funds into spot Bitcoin ETFs can reflect long-term institutional investment interest, inter-exchange fund flows (Inter-exchange Flow Pulse, IFP) provide insights into immediate market sentiment, revealing how retail and institutional investors transfer Bitcoin between different platforms.
How IFP Works
– Spot Exchanges (Coinbase, Kraken): Provide services for buying and selling Bitcoin directly using fiat or stablecoins.
– Derivatives Exchanges (Binance Futures, Bybit, XT.COM): Offer leveraged trading, such as futures, swaps, and options trading.
When Bitcoin flows significantly from the spot market into the derivatives market (e.g., BTC/USDT contracts), it typically indicates that traders are seeking leveraged gains or hedging against market volatility. Conversely, when funds flow back from the derivatives market to spot exchanges, it usually represents profit-taking or exiting high-risk positions.
Case Study: January 2024
– After the approval of the first spot Bitcoin ETF, Bitcoin prices surged dramatically. Many traders worried about a "sell-the-news" scenario, prompting them to transfer funds from the derivatives market back to the spot market or stablecoins.
– Over-the-counter (OTC) institutions also reported a significant increase in large BTC buy and sell activities, reflecting a tendency among some institutional investors to trade through OTC markets to reduce market impact and protect transaction privacy.
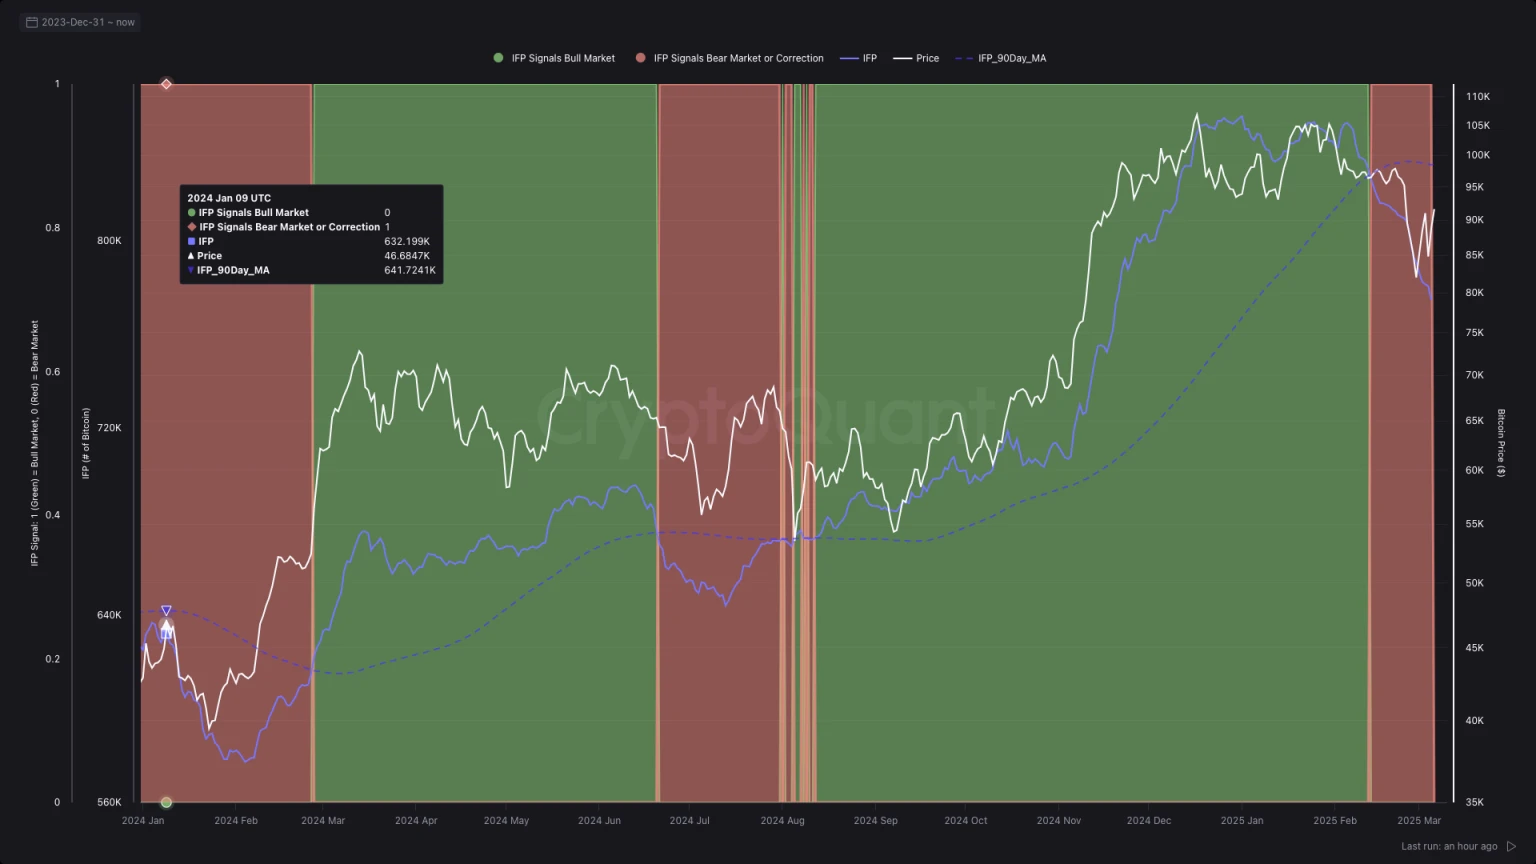
Image Credit: CryptoQuan
How IFP Helps Market Interpretation
Inter-exchange fund flows can serve as a key indicator of short-term market sentiment, while ETF capital inflows primarily reflect long-term investment trends in Bitcoin.
Stablecoins as Market Pillars: The Rise of USDT
With the surge in Bitcoin trading volume, stablecoins have become the primary medium of exchange and liquidity management tool in the market. Among them, Tether (USDT) is the most influential stablecoin, with its supply surpassing 110 billion in early 2025, solidifying its market dominance.
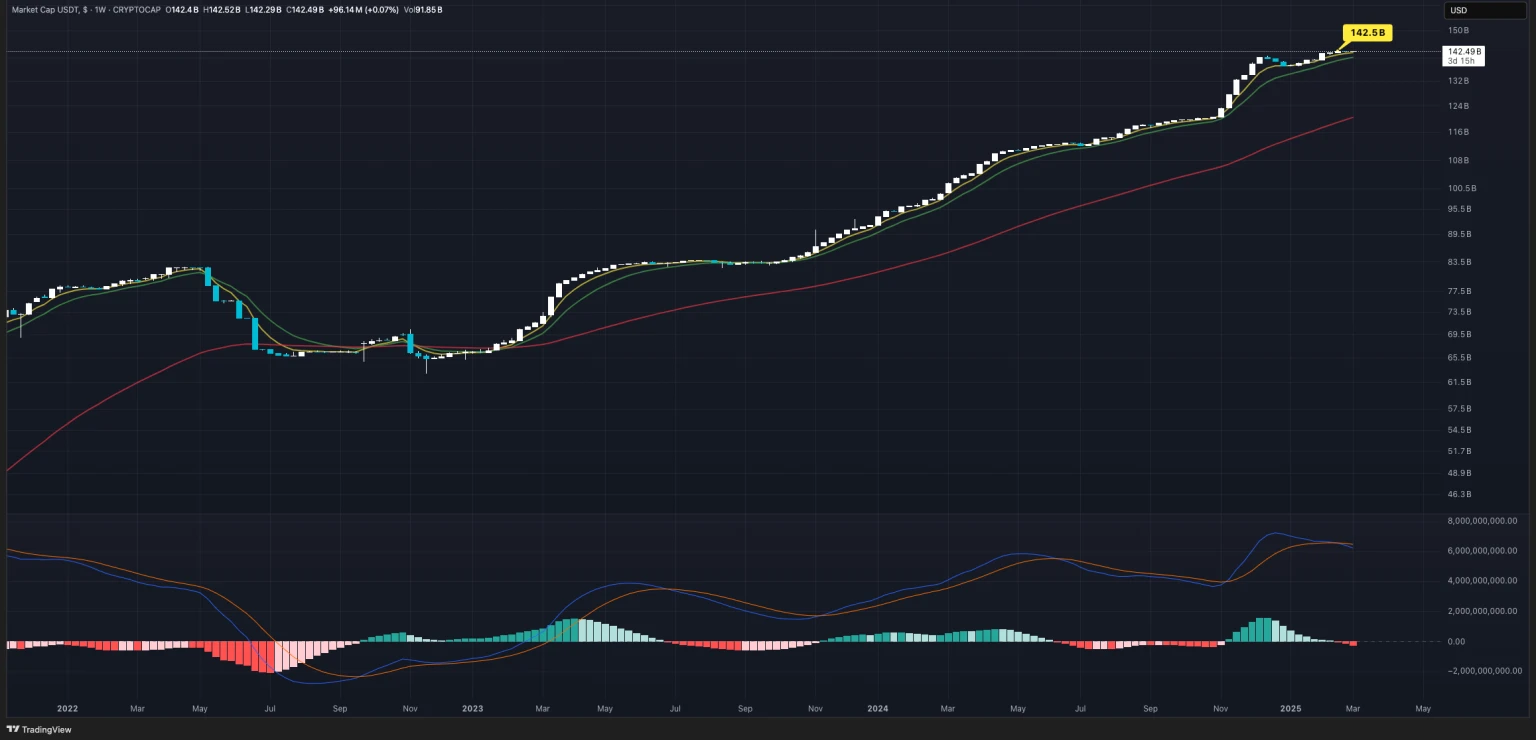
Image Credit: TradingView
Why is USDT So Dominant?
Hedging Market Volatility
Traders can quickly convert BTC (or other cryptocurrencies) into USDT during periods of significant market price fluctuations without reverting to traditional banking systems, thereby reducing trading risks.
Wide Trading Pair Support
On most centralized exchanges (CEX), USDT supports nearly all cryptocurrency trading pairs, offering low spreads and high liquidity, enhancing trading efficiency.
Global Accessibility
In markets with currency instability or strict capital controls, USDT serves as a borderless value storage tool and is even used as a convenient means of cross-border payment.
Controversies and Resilience
– Tether has long faced regulatory scrutiny over its reserve transparency issues and has even been fined for falsely claiming 1:1 asset backing.
– However, the network effects of USDT continue to expand, and its deep integration with exchanges has led to sustained growth in market applications.
How Do Stablecoins Support the Crypto Market?
Stablecoins, represented by Tether, effectively connect traditional finance with the cryptocurrency market, providing rapid capital flow and further strengthening Bitcoin's trading ecosystem.
Bitcoin Network Activity Index (BNI): An Overview of On-Chain Health
In addition to market fund flows and liquidity, on-chain data can reveal the actual usage of the Bitcoin network. The Bitcoin Network Activity Index (BNI) integrates various key data indicators, including:
– Active Addresses: The number of unique addresses sending or receiving BTC.
– Transaction Counts: Higher transaction volumes typically indicate increased market speculation or rising user interest.
– Block Size & Mempool: A larger mempool indicates transaction backlogs and network congestion; block size measures the network's processing efficiency during peak trading periods.
– Transaction Fees: Rising fees may reflect strong market demand but can also burden users who rely on low-cost transactions.
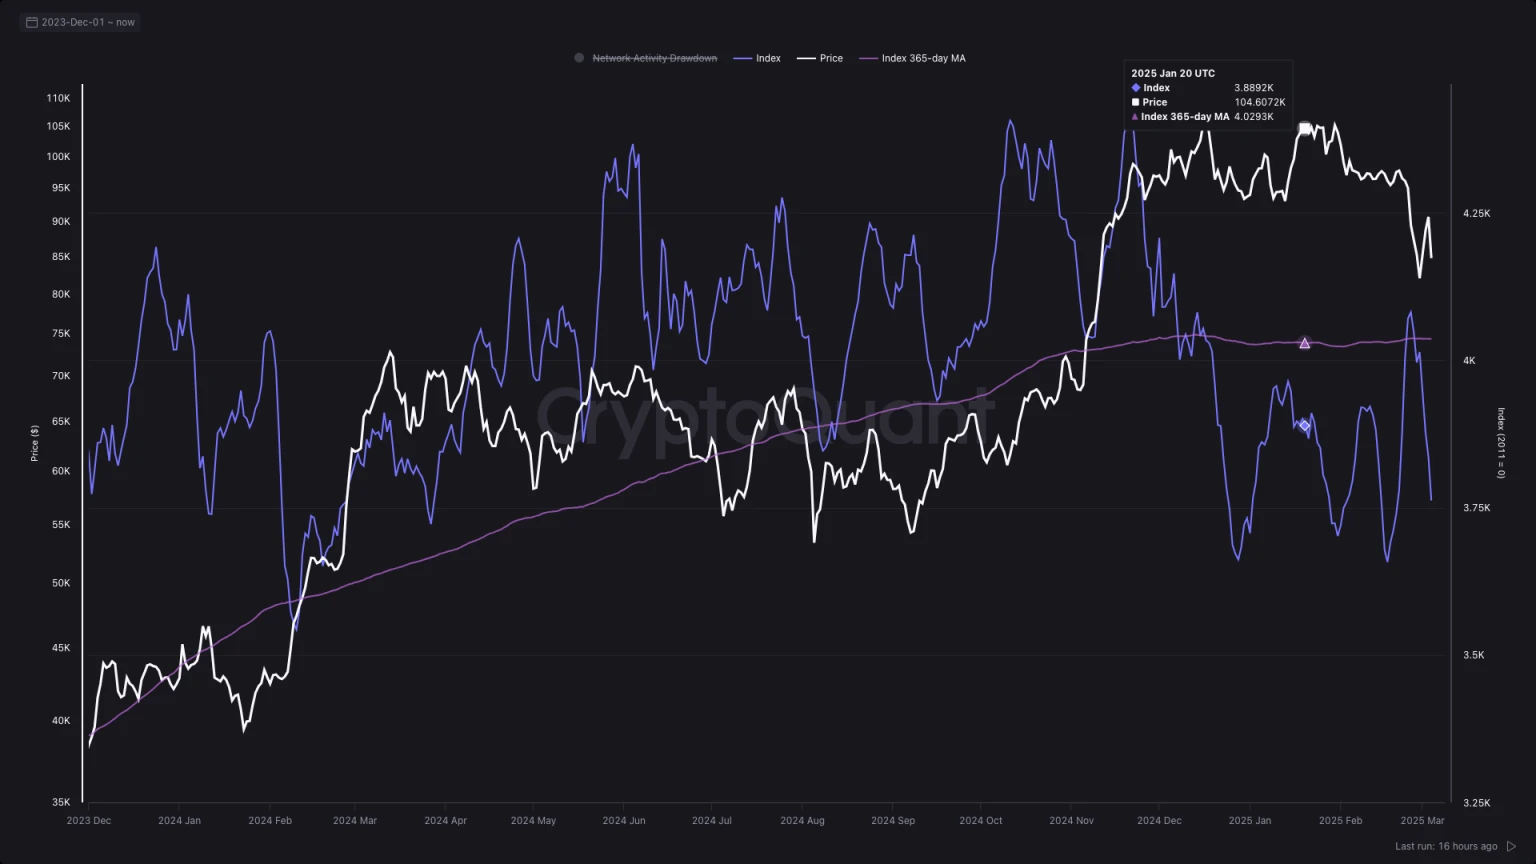
Image Credit: CryptoQuant
Why is BNI Important?
– Bull Market Indicator: Historical data shows that when the number of active addresses and daily transaction volume surge, it typically coincides with a bullish phase in the market, indicating new capital and new users entering.
– Limitations: BNI cannot fully predict price movements; external events such as regulatory crackdowns or institutional announcements may alter market trends, surpassing the influence of on-chain indicators.
How Does BNI Help Market Analysis?
BNI provides specific data on the daily usage of the network, and when combined with exchange fund inflows, stablecoin issuance, and macroeconomic data, it can construct a more comprehensive market analysis perspective.
Internal and External Factors: Shaping Bitcoin's Development Trajectory
To fully understand Bitcoin's market performance, it is essential to consider not only internal technological developments but also external macroeconomic and regulatory factors.
Internal Development Factors
Protocol Upgrades
Bitcoin is continuously evolving, with protocol upgrades like Taproot and Schnorr signatures enhancing privacy, scalability, and smart contract capabilities. Additionally, Layer-2 solutions (such as the Lightning Network) improve transaction throughput, potentially unlocking more real-world applications.
Miner Behavior
Miners directly influence block generation times, transaction fees, and overall network security. When miners migrate due to changes in electricity costs or regulations, the distribution of hash power may be affected, thereby altering transaction confirmation speeds.
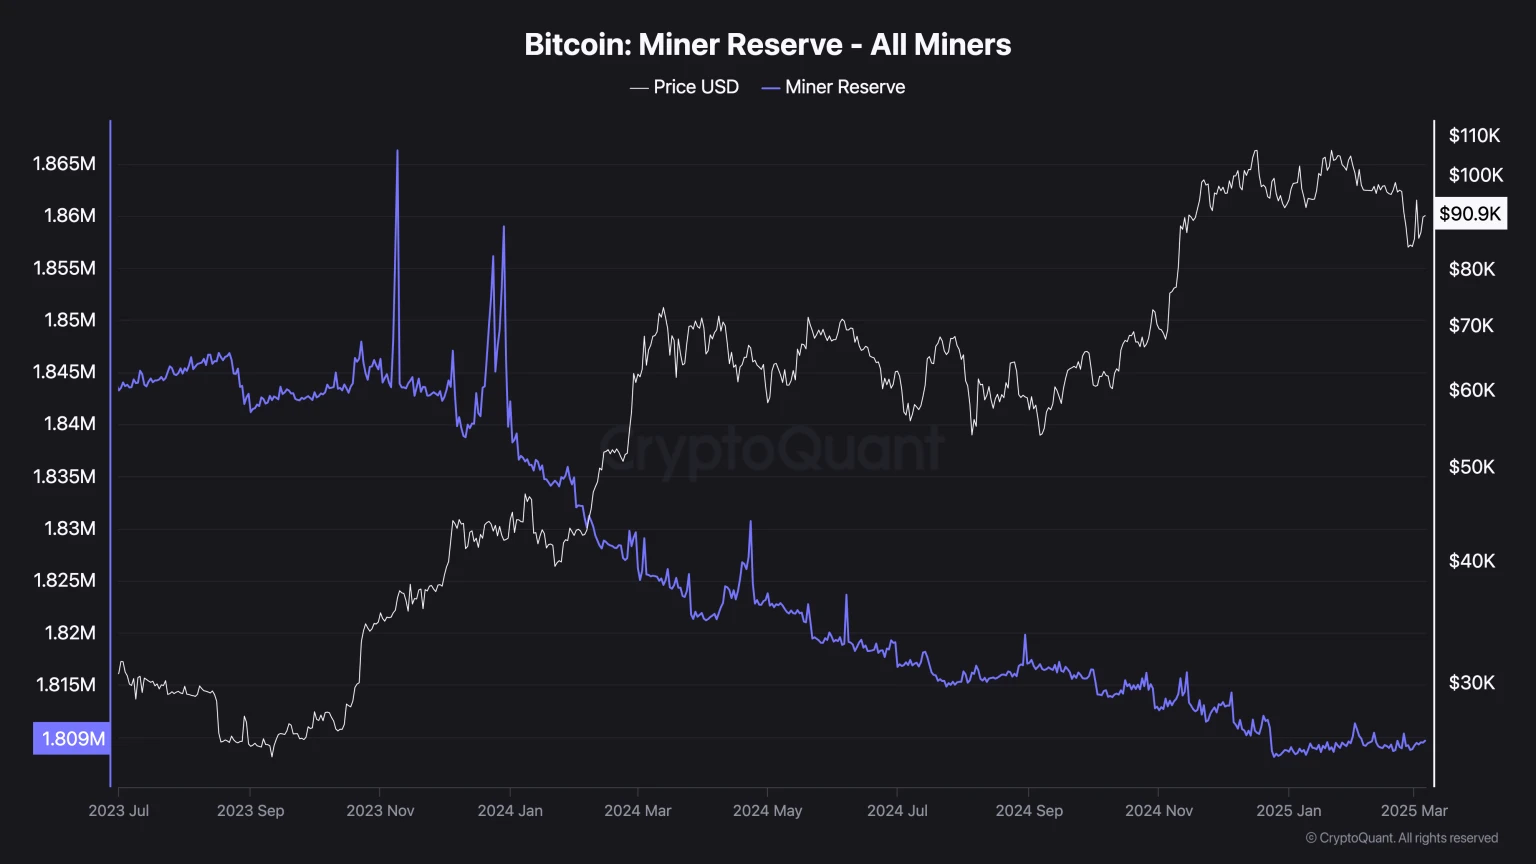
Image Credit: CryptoQuant
External Influencing Factors
Monetary Policy
– A loose monetary environment (such as low interest rates or quantitative easing) typically encourages speculative capital to flow into Bitcoin.
– Conversely, tightening policies (such as interest rate hikes or balance sheet reductions) may lead to capital withdrawal from high-risk assets, including Bitcoin.
Regulatory Climate
– Countries that support cryptocurrencies (such as the U.S. approving spot Bitcoin ETFs) usually promote institutional investment growth.
– In contrast, regulatory crackdowns or unclear regulations may lead to decreased local market demand and even force miners or exchanges to relocate.
Global Economic Stability
- – Economic recessions, geopolitical conflicts, or currency devaluations often reinforce Bitcoin's narrative as a "borderless store of value," attracting capital inflows into the Bitcoin market.
Outlook and Potential Catalysts
Looking ahead, the Bitcoin market faces various development paths shaped by technological innovations and market risks:
Broader ETF Expansion
- – Following the U.S. approval of spot Bitcoin ETFs, Europe, Asia, and Latin America may follow suit, further unlocking institutional capital and driving global market development.
Stablecoin Market Competition
- – Other stablecoins (such as USDC) or decentralized stablecoins (like DAI) may challenge Tether's (USDT) market dominance through stricter audits and regulatory compliance.
Scaling Solutions
- – The broader application of Layer-2 networks and emerging sidechain technologies may make Bitcoin transactions faster and cheaper, potentially making Bitcoin a more practical payment tool.
Regulatory Uncertainty
– Increasing regulatory scrutiny over mining carbon footprints, stablecoin reserves, and cryptocurrency exchange operations may trigger market uncertainty.
– Black swan events or macroeconomic shocks (such as global economic recessions or geopolitical risks) could still have sudden impacts on the market.
Despite these uncertainties, Bitcoin's decentralized protocol and growing global user base continue to attract capital and talent, ensuring it remains a focal point in the coming years.
Summary and Future Outlook
The complexity of the Bitcoin market becomes clearer through multi-faceted analysis:
– The trading surge on December 4, 2024, demonstrated Bitcoin's network's ability to absorb significant demand, driven by institutional capital positioning, retail FOMO sentiment, and macroeconomic factors.
– Spot Bitcoin ETFs have opened new channels for capital inflow, making it easier for pension funds and ordinary traders to invest in Bitcoin.
– Inter-exchange fund flows provide real-time market sentiment analysis, helping identify the timing of traders' transitions between leveraged speculation and secure holdings.
– Stablecoins (especially USDT) serve as liquidity pillars in the market, effectively connecting on-chain and off-chain capital flows.
– The Bitcoin Network Activity Index (BNI) and other on-chain metrics can measure the actual usage of the network and complement analyses of macroeconomic data and exchange fund flows.
Bitcoin's development continues to evolve, from protocol-level technological upgrades to changes in global monetary policy; each innovation or adjustment could impact the market landscape. However, the core value of Bitcoin lies in its adaptability, technological innovation, institutional adoption, and grassroots community support.
Whether Bitcoin reaches new highs or experiences market corrections, these market dynamics ensure it remains a central focus in the evolution of digital assets.
Quick Links
– March Global Economic Dynamics: A Must-Read for Crypto Investors
– Monad vs. Ethereum: Can This Emerging L1 Disrupt the Market?
– Hong Kong Web3 Revolution: Key Trends and Regulatory Policies Released at Consensus 2025
– Top 9 Cryptocurrency Trends for 2025: AI, DeFi, Tokenization, and More Innovations
About XT.COM
Founded in 2018, XT.COM currently has over 7.8 million registered users, with more than 1 million monthly active users and over 40 million user traffic within its ecosystem. We are a comprehensive trading platform supporting over 800 quality cryptocurrencies and more than 1,000 trading pairs. XT.COM cryptocurrency trading platform supports a rich variety of trading options, including spot trading, margin trading, and contract trading. XT.COM also features a secure and reliable NFT trading platform. We are committed to providing users with the safest, most efficient, and most professional digital asset investment services.
免责声明:本文章仅代表作者个人观点,不代表本平台的立场和观点。本文章仅供信息分享,不构成对任何人的任何投资建议。用户与作者之间的任何争议,与本平台无关。如网页中刊载的文章或图片涉及侵权,请提供相关的权利证明和身份证明发送邮件到support@aicoin.com,本平台相关工作人员将会进行核查。