
The US stock market has not yet bottomed out. I would prefer to see a circuit breaker to digest the bubble, which would be good for the global financial market and crypto. In the short term, Bitcoin is still supported by the MA200 moving average; if it does not break this support later, it can rebound directly. If it breaks, it will still support a range of 69,000 to 78,000 for a rebound. The bull market has not ended.
As for the significant changes in the East rising and the West declining pattern, the young master did not discuss factors such as political and economic issues. We are simply looking at different trading markets. First, the three major US stock indices have been falling for several weeks and have all broken key levels. The US dollar index has dropped from 110 to 104, a decline of over 5%. Correspondingly, US Treasury bonds have also recently corrected, and from a weekly perspective, after multiple peaks, there is a continuous downward trend.
On the other hand, Hong Kong and A-shares have recently performed strongly. Earlier this year, Goldman Sachs stated: "Chinese stocks have become the market with the largest nominal net buying volume this year." Major foreign investment banks on Wall Street are collectively optimistic about Chinese assets. In simple terms, other investment markets like US stocks, European stocks, Japanese stocks, and Indian stocks have risen too high and carry greater risks, while Chinese stocks have been falling for many years, presenting relatively lower risks. Capital is bloodthirsty, greedy, and timid, simply seeking profit and avoiding harm.
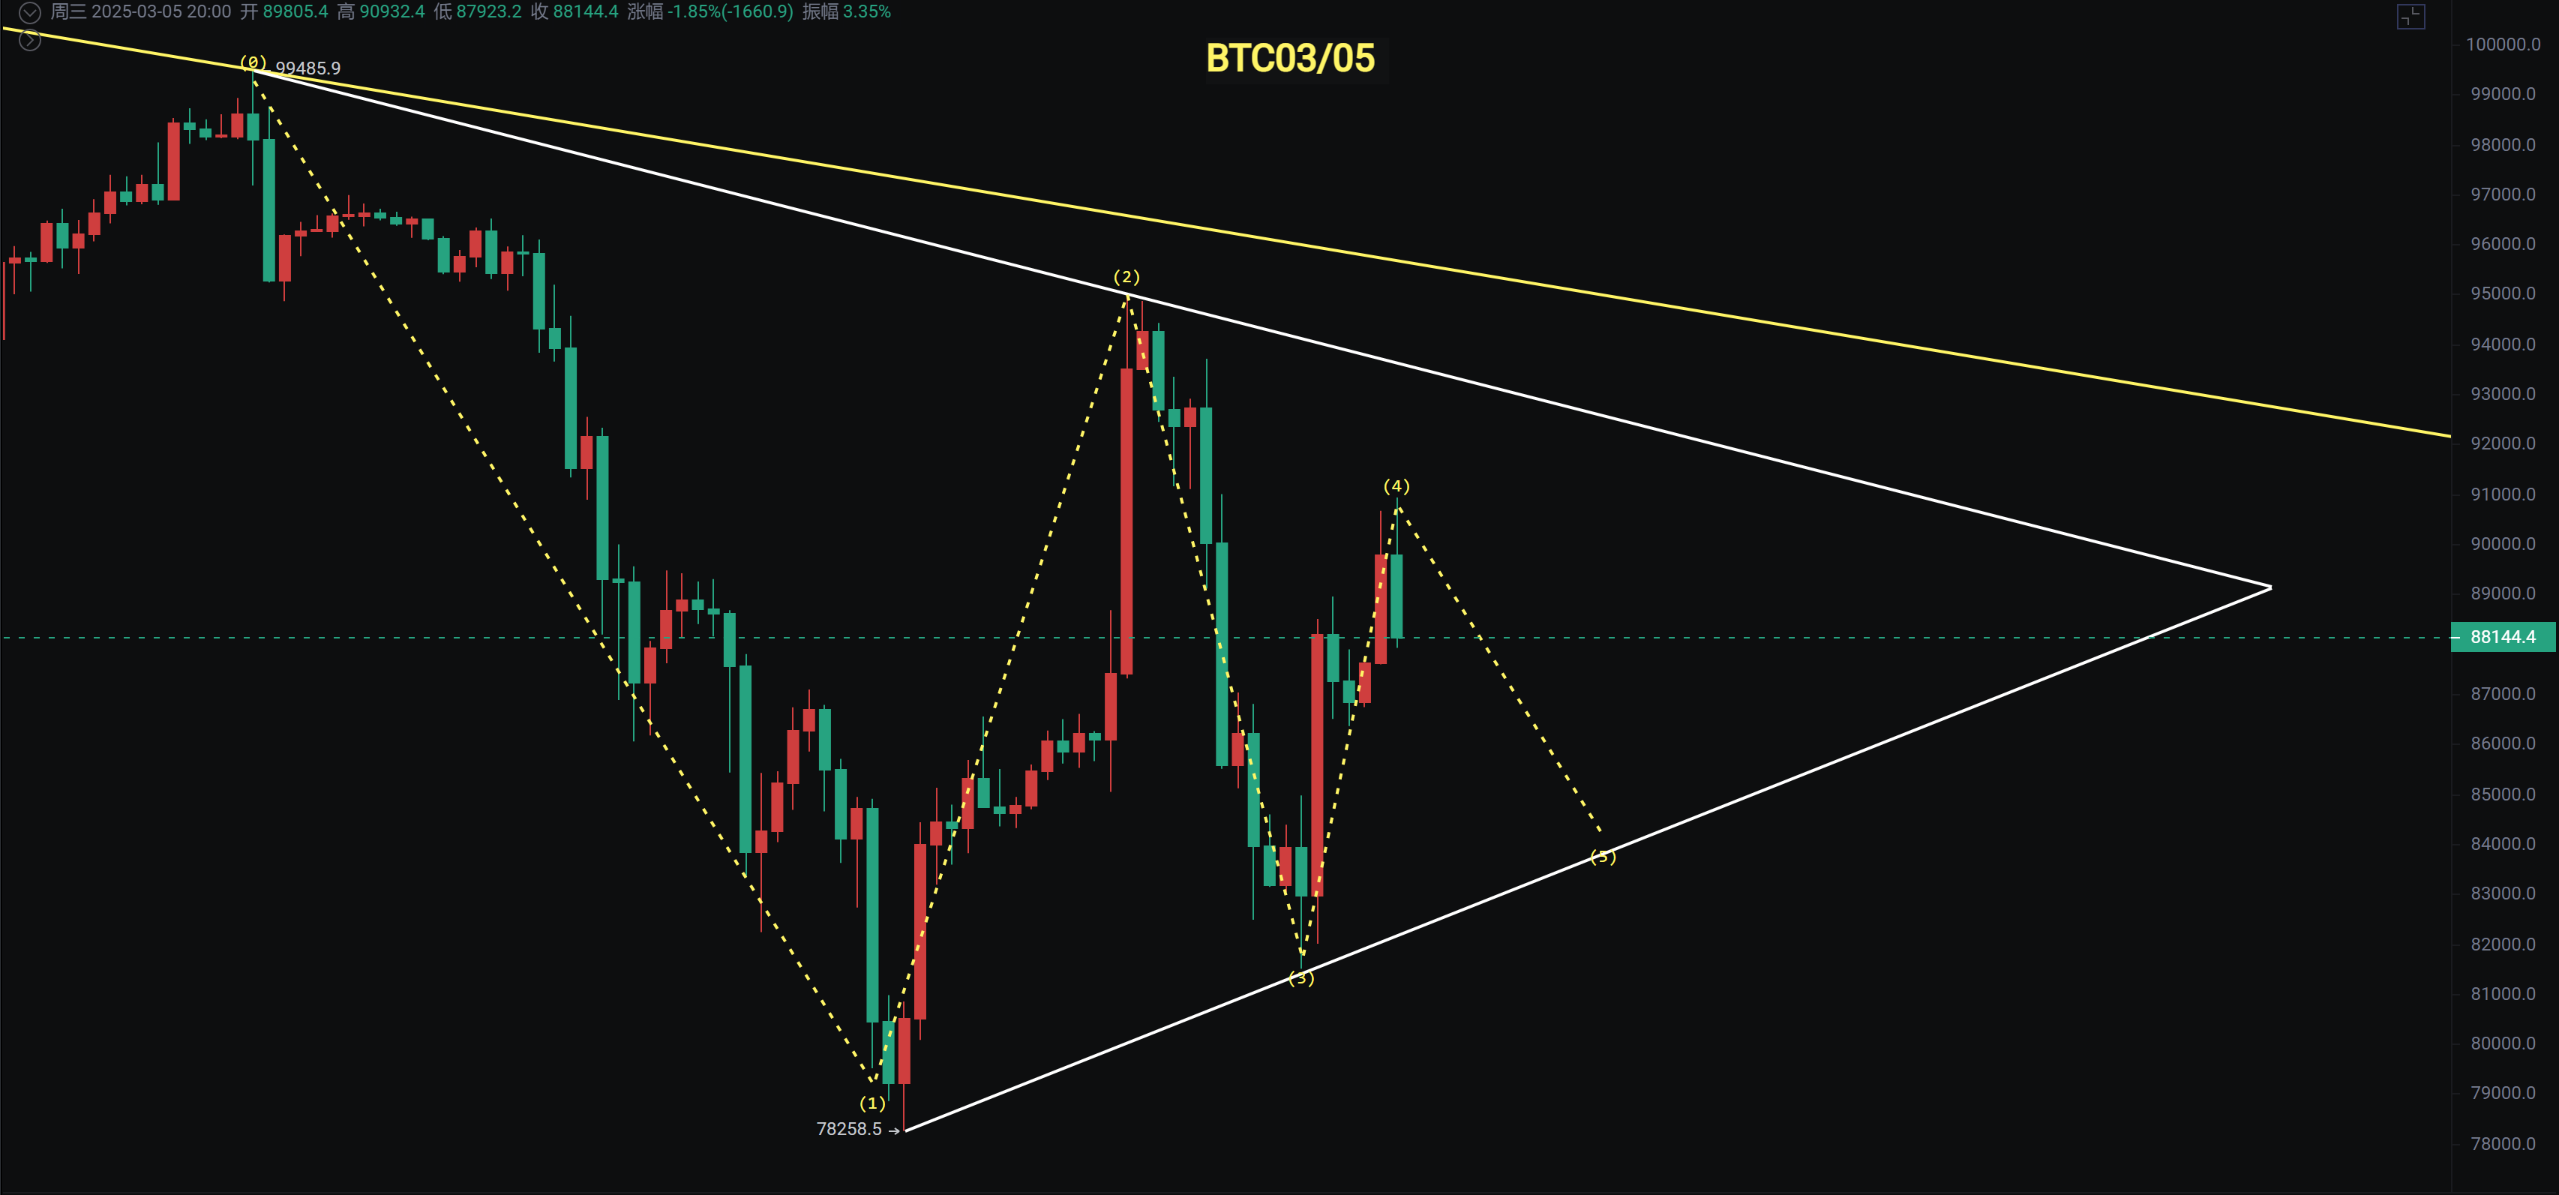
Bitcoin
On the daily chart, it tested the MA200 support for the fourth time yesterday. In the short term, there is still support. Later, we will focus on whether it can rebound directly if it does not break this level. If it breaks, it will still support a range of 69,000 to 78,000 for a rebound, which means a downward C wave.
The 4-hour chart has formed a converging triangle. Currently, it has rebounded to 90,932. Watch for support in the range of 81,500 to 84,000 before continuing to rebound. Before the 8th, there will also be speculation about the White House's first crypto summit.
Support: Pressure:
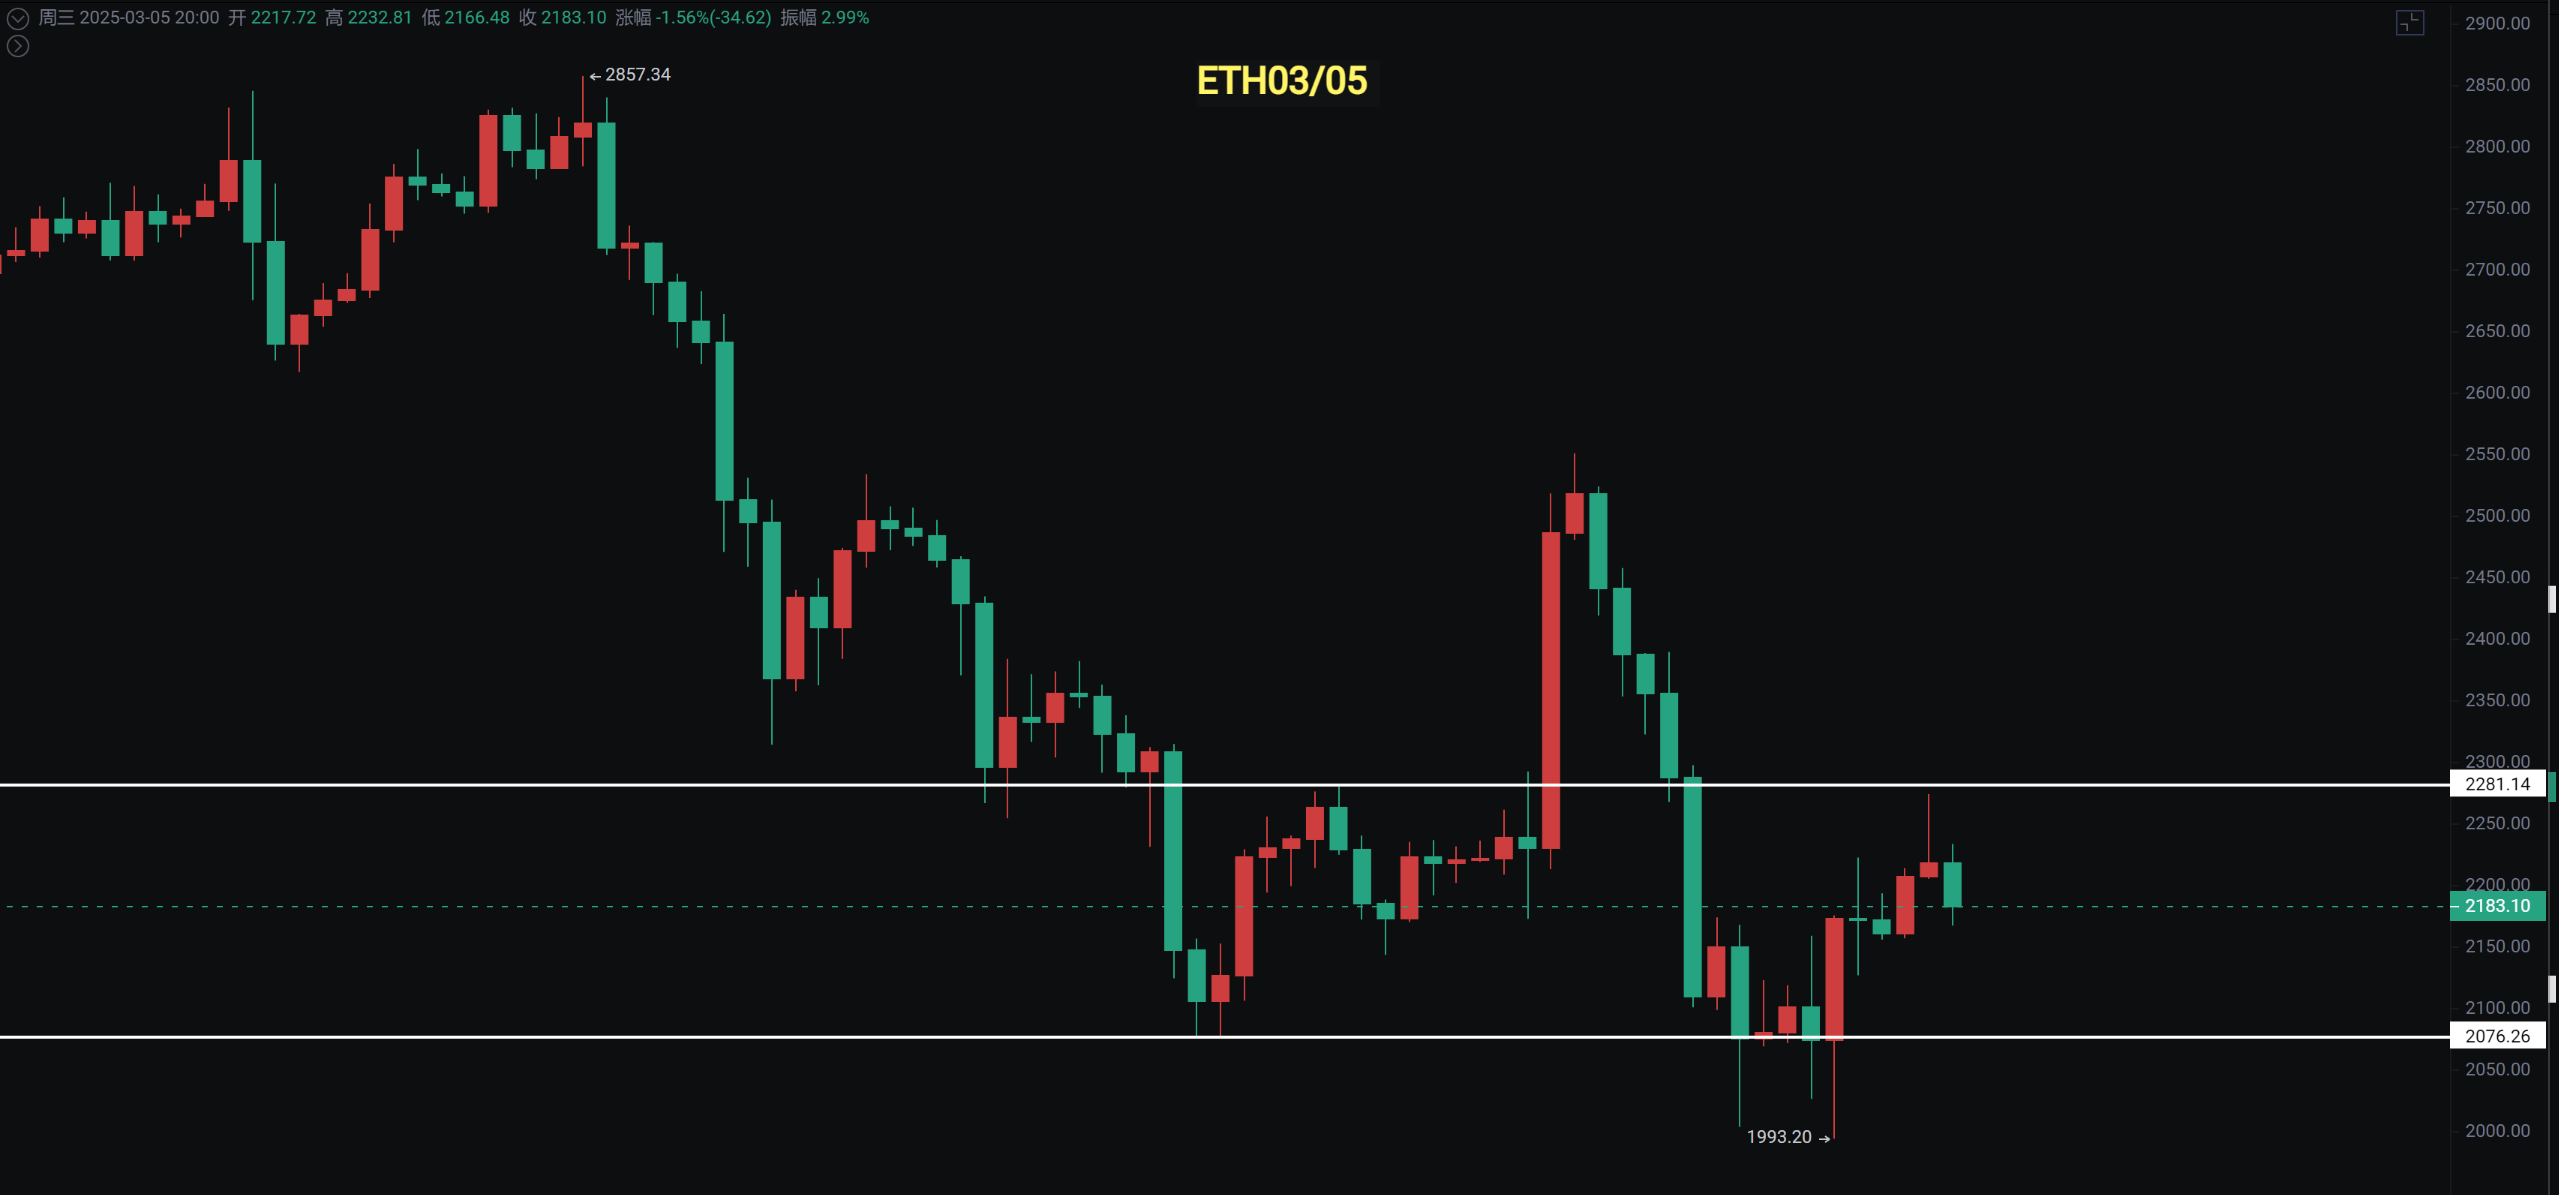
Ethereum
Last night, it dipped to a low of 1,993 and rebounded. From the naked candlestick chart, the price has not returned above 2,550, and for a short time, I do not think the market has stopped falling. From the current rebound strength, it looks very weak, with continuously lower lows and lower highs. I would prefer to see a lower low for a better and safer rebound.
In contrast, many altcoins have a better short-term cost-performance ratio than Ethereum, but similarly, they will only be short-term. It's good to make some profit without focusing on the overall pattern. The risks in the US stock market and Ethereum are not too safe.
Support: Pressure:
If you like my views, please like, comment, and share. Let's navigate through the bull and bear markets together!!!
The article is time-sensitive and for reference only, updated in real-time.
Focusing on K-line technical research, sharing global investment opportunities. Public account: Trading Young Master Fusu

免责声明:本文章仅代表作者个人观点,不代表本平台的立场和观点。本文章仅供信息分享,不构成对任何人的任何投资建议。用户与作者之间的任何争议,与本平台无关。如网页中刊载的文章或图片涉及侵权,请提供相关的权利证明和身份证明发送邮件到support@aicoin.com,本平台相关工作人员将会进行核查。


