When danger far exceeds hope, the reason in our hearts reminds us that patiently waiting is wiser than rashly moving forward. Just like the starry night sky, we do not need to rush to grasp every star; patiently waiting for the light to arrive allows us to see even more beautiful sights.
Hello everyone, I am trader Gege. Continuing from the last article, let's first review the strategy for the Bitcoin long position at 81500. The market just hit the order, and a big bullish candle in the early morning shot up to around 88000. The Asian and European sessions continued with a small wave of movement, then adjusted again near 91000. Yesterday, Auntie's thinking was over 90% correct; the point after breaking 2000 was slightly off. In actual operation, one could wait for a pullback above 2000 after the false break to follow up. I won't elaborate on this here, as it may seem like hindsight. Sometimes, the thought process and strategy are important, but flexible operation during trading is also crucial.
During the day, I was on a business trip, so I didn't keep a close eye on the market. Today's article will be a simple discussion. This week's news is quite concentrated, and it has a bit of a "fire and chaos" feel, making it hard to distinguish between true and false. Be cautious with the "Chuan-style" trading signals, or you might find yourself lost in the short-term changes. I won't discuss the long-term cycles and trends of Bitcoin today, as I've covered this extensively in recent articles. Friends who want to reference this can review the recent articles; I won't repeat it here. The thought process remains unchanged and will not change in the short term unless it breaks the bull-bear boundary I mentioned.

Looking at the daily candlestick pattern, it still looks good. It can be seen as having completed two bottom tests, and the market is above EMA200 and MA7. If it can maintain the current pattern and complete the closing, then we can continue to go long on the pullbacks, repeating the same directional action, focusing on the breakout situation near the middle track above. The 4H candlestick level shows that this rise is slightly healthier than the last one, with some pullback, but the pullback strength is not large. The KDJ indicator has a need for correction. As long as it does not break below the 83800-84800 range, the candlestick pattern looks good for a fluctuating upward channel, with short-term entry near the support of MA6 and MA7.
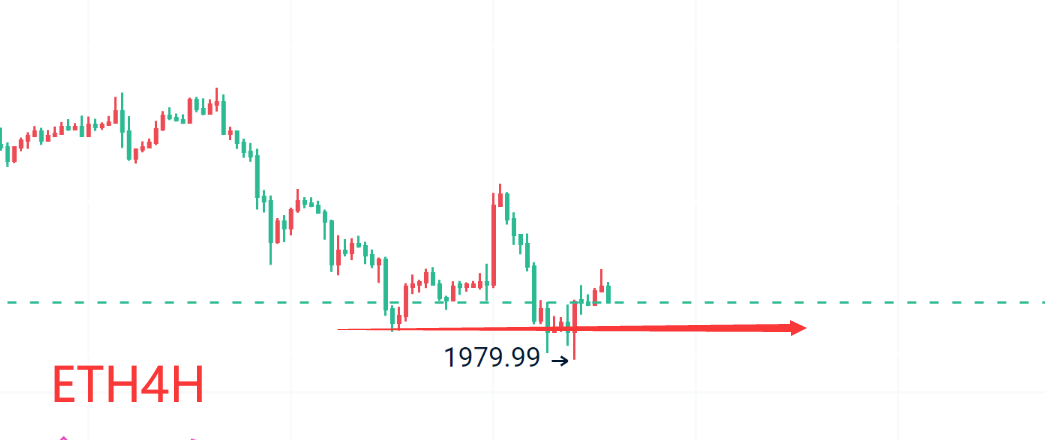
Auntie's trend is slightly weaker than Bitcoin. The daily level has not broken above MA7, and the 4H level is blocked at the middle track and MA30. We need to pay attention to the breakout situation at this line. If it can break and stabilize, we might see Auntie above 2500 again this week. For Bitcoin, the short-term suggestion is to go long at the 87500-86500 range, and for Auntie, the short-term suggestion is to go long at the 2100-2050 range.
The suggestions are for reference only. Please manage your risk when entering the market, and grasp the profit and stop-loss space yourself. Specific strategies should be consulted during trading.
Alright, friends, we will say goodbye until next time. I wish everyone success in their trading and smooth sailing in the crypto world! More real-time suggestions will be sent internally. Today's brief update ends here. For more real-time suggestions on Bitcoin and Auntie, find Gege.
Written by/ I am trader Gege, a friend willing to accompany you in your resurgence.

免责声明:本文章仅代表作者个人观点,不代表本平台的立场和观点。本文章仅供信息分享,不构成对任何人的任何投资建议。用户与作者之间的任何争议,与本平台无关。如网页中刊载的文章或图片涉及侵权,请提供相关的权利证明和身份证明发送邮件到support@aicoin.com,本平台相关工作人员将会进行核查。


