Introduction: The Altcoin Bear Market, Fundamental Investment Remains Effective
There is no doubt that this round of bull market cycle has been the worst for altcoins.
Unlike previous bull markets where various altcoin prices surged after the onset, leading to a rapid decline in BTC's market share, this bull market has seen BTC's market share rise steadily from around 38% since the market bottomed in November 2022, currently standing firmly above 61%. This is notable even amidst the rapid expansion of the number of altcoins in this cycle, highlighting the weakness of altcoin prices.
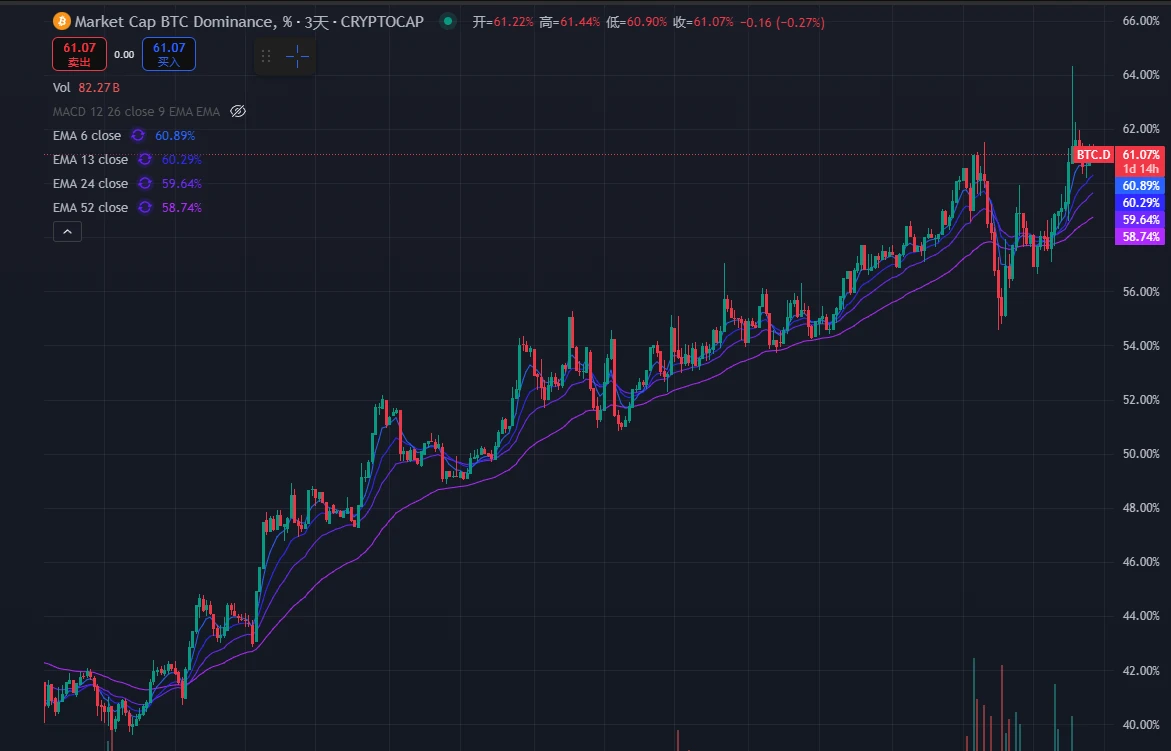
BTC Market Share Trend, Source: Tradingview
As the market has progressed to this point, it largely confirms the analysis by Mint Ventures in their March 2024 article “Preparing for the Primary Wave of the Bull Market: My Periodic Thoughts on This Market Cycle”, where the author believes:
Among the four major driving factors of this bull market, three are present and one is missing:
BTC's halving (supply-demand adjustment expectations), √
Easing or expected easing of monetary policy, √
Easing of regulatory policies, √
Innovation in new asset models and business models, ×
Therefore, expectations for the prices of the previous cycle's altcoins—including smart contract platforms (L1\L2), gaming, Depin, NFTs, and DeFi—should be lowered. The recommended strategy for this bull market was:
To allocate a higher ratio to BTC and ETH (with a more favorable outlook on BTC, primarily long-term BTC)
To control the allocation ratio in altcoins such as DeFi, Gamefi, Depin, and NFTs
To choose new tracks and projects to seek Alpha, including: Meme, AI, and the BTC ecosystem
As of the publication of this article, the correctness of the above strategies has been largely validated (except for the performance of the BTC ecosystem, which has been less than satisfactory).
However, it is worth noting that despite the poor price performance of most altcoin projects in this cycle, a few altcoin projects have significantly outperformed BTC and ETH over the past year. The most typical examples are Aave and Raydium, mentioned in a research report published by Mint Ventures in early July 2024, during the lowest point of the altcoin market, titled “Altcoins Keep Falling: Time to Refocus on DeFi”.
Since early July last year, Aave has seen a maximum increase of over 215% relative to BTC and a maximum increase of 354% relative to ETH. Even after a significant price drop, Aave's increase relative to BTC is still 77%, and 251% relative to ETH.
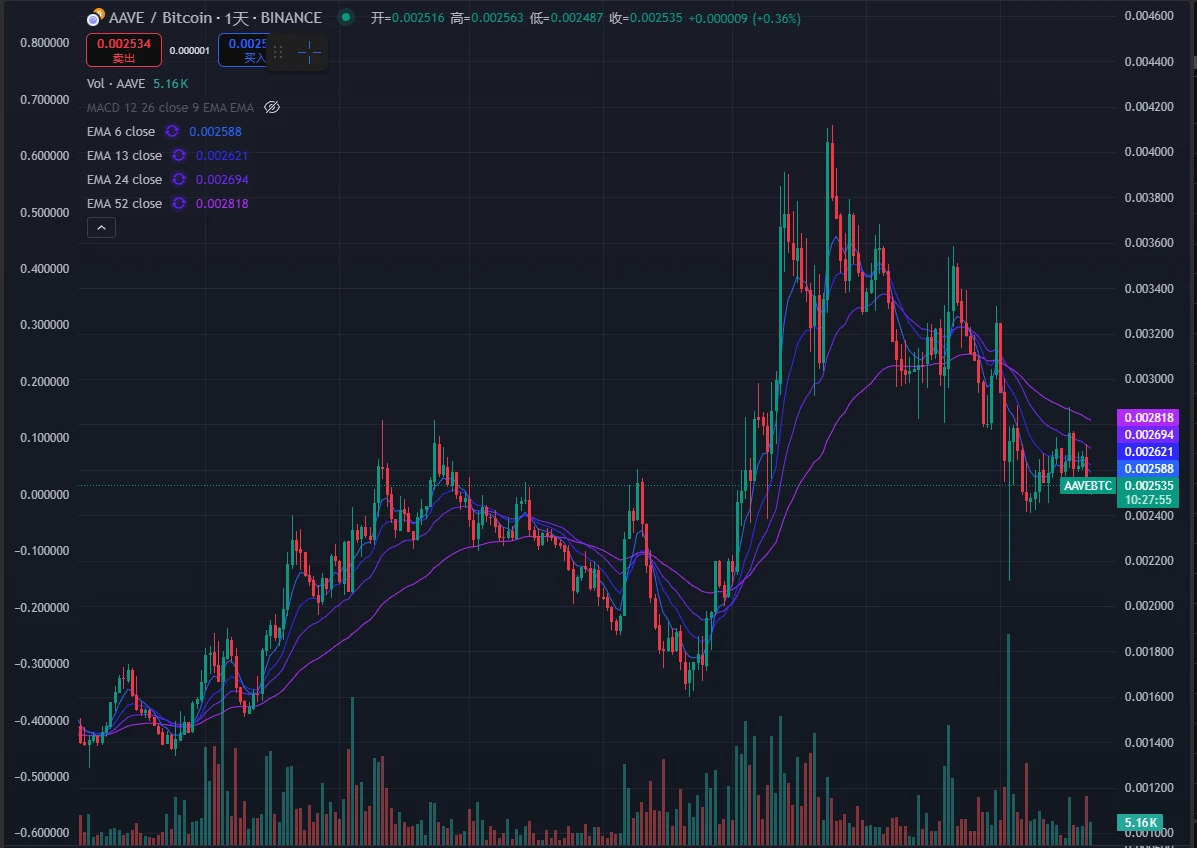
Aave/BTC Exchange Rate Trend, Source: Tradingview
Since early July last year, Ray has seen a maximum increase of over 200% relative to BTC and a maximum increase of 324% relative to ETH. Despite the overall decline of the Solana ecosystem and the significant negative impact from the self-developed Dex by Pump.fun, Ray's increase relative to BTC remains positive and has significantly outperformed ETH.
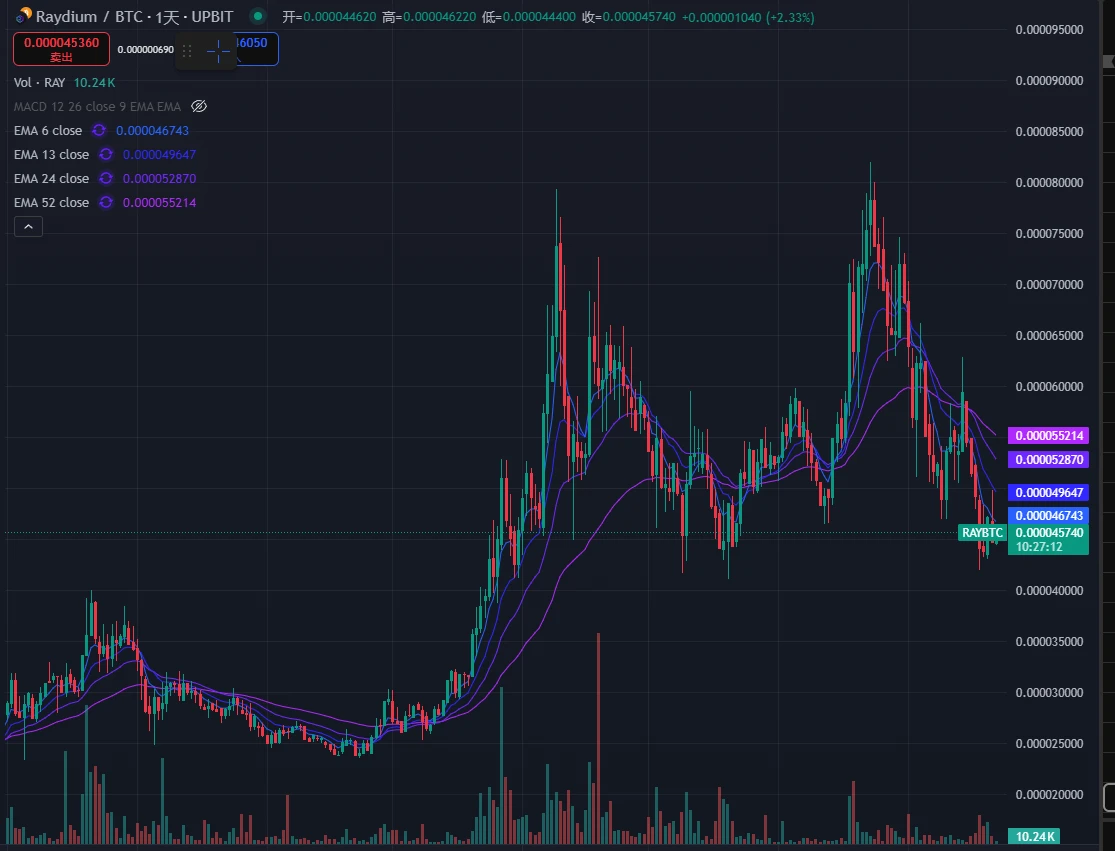
Ray/BTC Exchange Rate Trend, Source: Tradingview
Considering that BTC and ETH (especially BTC) have significantly outperformed most altcoin projects in this cycle, Aave and Ray's price performance stands out among the altcoins.
The reason for this is that compared to most altcoin projects, Aave and Raydium possess superior fundamentals, reflected in their core business data reaching historical highs in this cycle, and they have unique competitive advantages with stable or rapidly expanding market shares.
Even in a "bear market" for altcoins, betting on projects with outstanding fundamentals can yield Alpha returns that surpass BTC and ETH, which is also the main purpose of our investment research work.
In this research report, Mint Ventures will identify high-quality projects with solid fundamentals from thousands of listed and circulating crypto projects, track their recent business performance and market share, analyze their competitive advantages, assess their challenges and potential risks, and provide some reference for their valuation.
It is important to emphasize:
The projects mentioned in this article have advantages and attractions in certain aspects, but they also face various problems and challenges. Different readers may have completely different judgments about the same project after reading this article.
Similarly, the projects not discussed in this article do not imply that they have "poor fundamentals," nor does it mean "we do not have a favorable outlook." We welcome recommendations for projects you believe in and the reasons behind them.
This article reflects the periodic thoughts of the two authors as of the publication date, which may change in the future, and the views expressed are highly subjective. There may also be errors in facts, data, or logical reasoning. All opinions in this article are not investment advice, and we welcome criticism and further discussion from peers and readers.
We will analyze the projects from several dimensions, including business status, competitive situation, main challenges and risks, and valuation status. The following is the main text.
I. Lending Sector: Aave, Morpho, Kamino, MakerDao
DeFi remains the best-performing major sector for achieving Product-Market Fit (PMF) in the crypto business world, and lending is one of the most important sub-sectors within it. User demand is mature, and business revenue is stable. This sector gathers many high-quality new and old projects, each with its own strengths and weaknesses.
For lending projects, the most critical indicators are loan volume (Active loans) and protocol revenue (Revenue). Additionally, the protocol's expenditure indicators—token incentives (Token Incentives)—must also be evaluated.
1.1 Aave: The King of Lending
Aave is one of the few projects that has successfully navigated through three crypto cycles, with stable business development to date. It completed its financing through an ICO in 2017 (when the project was still called Lend, operating on a peer-to-peer lending model) and surpassed the then-leading lending platform Compound in the last cycle, maintaining its position as the top lending platform. Aave currently provides services on most mainstream EVM L1 and L2 networks.
- Business Status
Aave's main business model is operating a lending platform based on a pool model, earning interest income from loans and liquidation penalties from collateral. Additionally, Aave's stablecoin business, GHO, has entered its second year, which will generate direct interest income for Aave.
- Loan Volume (Active loans)
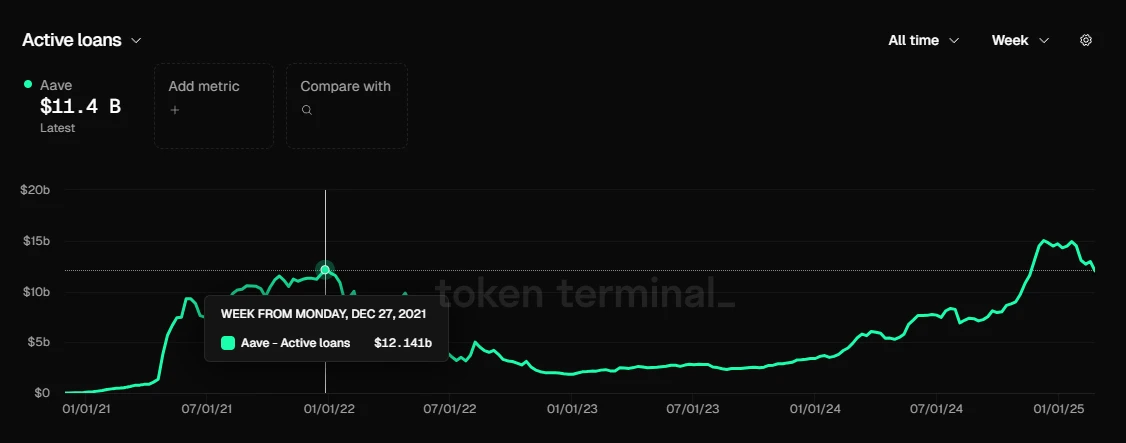
Aave's loan volume, Data Source: Tokenterminal
Since November last year, Aave's loan volume has exceeded the previous cycle's peak of $12.14 billion (November 2021). The current peak was at the end of January 2025, with a loan volume of $15.02 billion. Recently, as market trading enthusiasm has cooled, the loan volume has also declined, currently around $11.4 billion.
- Protocol Revenue (Revenue)
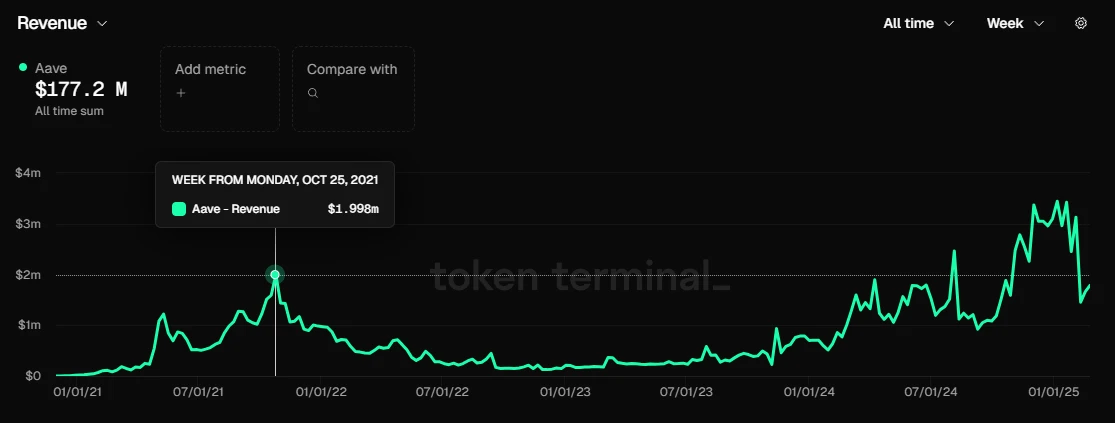
Aave's protocol revenue, Data Source: Tokenterminal
Similar to loan volume, Aave's protocol revenue has steadily exceeded the previous peak in October 2021 since November last year. For most of the past three months, Aave's weekly protocol revenue has been above $3 million (excluding GHO's interest income). However, in the past two weeks, as market enthusiasm has declined and market interest rates have decreased, weekly protocol revenue has fallen to just over $2 million.
- Token Incentives (Token Incentives)
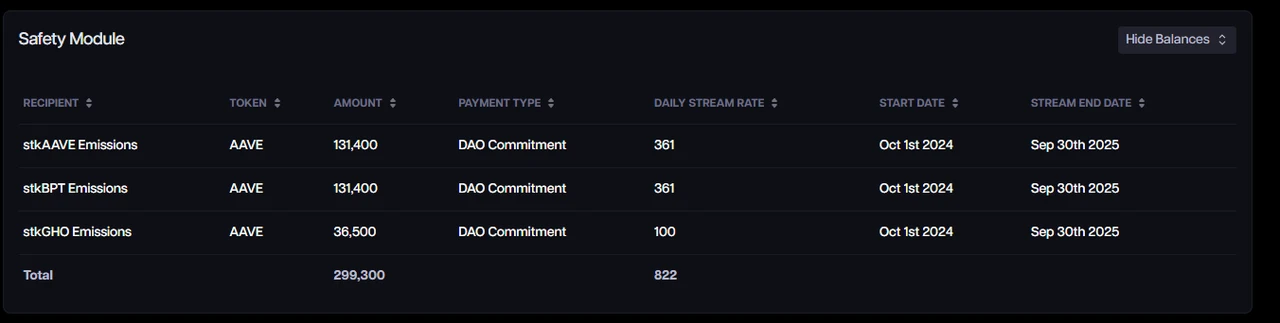
Aave token incentive expenditure, Data Source: Aave Analytics
Aave currently has a large scale of token incentives, with daily token incentive expenditure of 822 Aave tokens. Based on the current market price of $245 for Aave, this corresponds to a value of about $200,000. This high incentive value is due to the significant increase in Aave tokens over the past six months.
However, it is important to note that unlike most projects that directly stimulate business indicators through token incentives, Aave's token incentives do not directly target the core behaviors of users borrowing and lending but instead incentivize the deposit protection fund. Therefore, Aave's lending and borrowing business data is still based on organic demand.
In the author's view, the incentive scale for Aave's protection fund is still too high, and the current incentive scale could be reduced by at least more than half. However, with the series of functions of Aave's new economic model, especially after the launch of the new insurance module Umbrella, Aave will no longer use its tokens for incentives.
For information on Aave's new economic model, you can read Mint Ventures' article published last year titled “Initiating Buybacks and Dividends, Upgrading Safety Modules: An In-depth Analysis of Aave's New Economic Model”.
- Competitive Situation
In terms of loan volume (EVM chains), Aave's market share has remained relatively stable, consistently holding the top position since June 2021. In the second half of 2023, its market share briefly fell below 50%, but it has regained momentum since 2024 and is currently stable at around 65%.
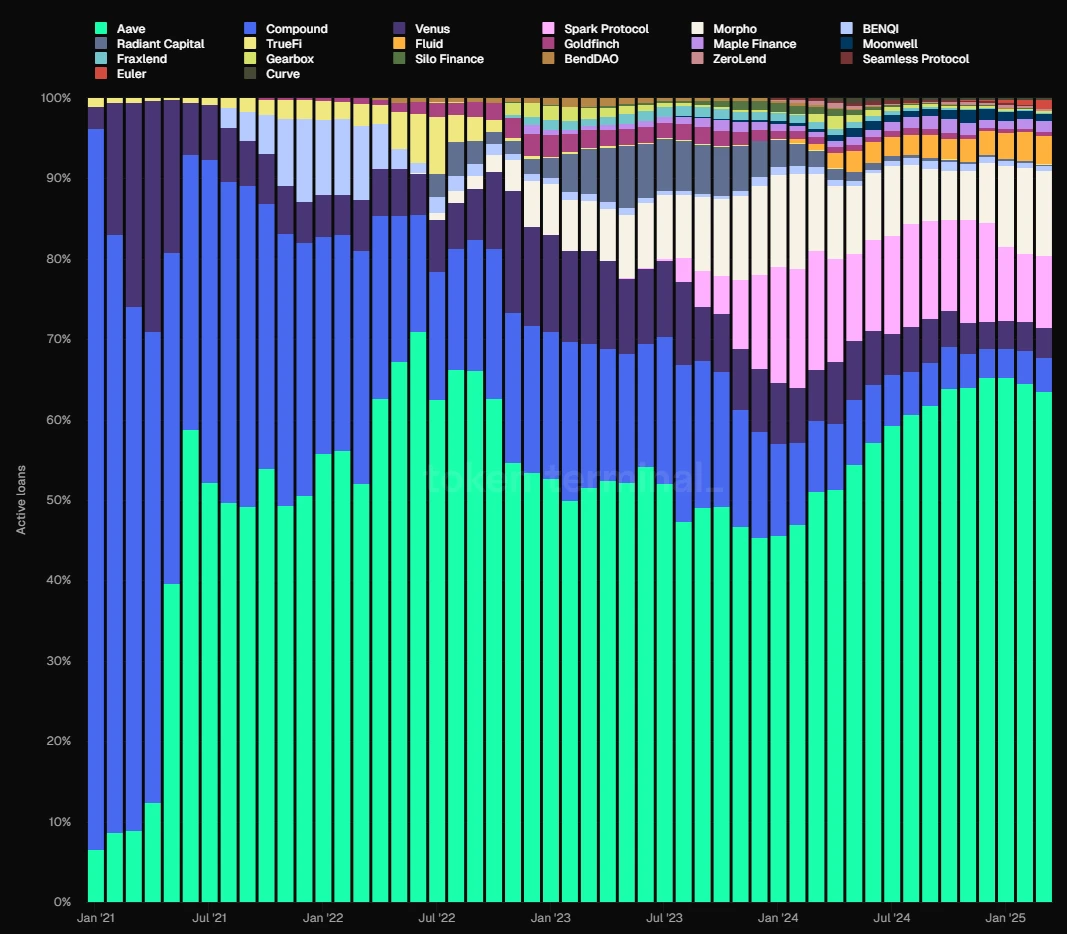
Data Source: Tokenterminal
- Aave's Competitive Advantages
As of my analysis of Aave in July last year, Aave's core competitive advantages have not changed significantly and mainly come from four aspects:
Continuous accumulation of security credit: Most new lending protocols experience security incidents within the first year of launch. Aave has operated without any smart contract-level security incidents to date. The risk-free and stable operation of a platform accumulates security credit, which is often the top consideration for DeFi users when choosing a lending platform, especially for large whale users with significant capital, such as Sun Yuchen, who is a long-term user of Aave.
Bilateral network effects: Like many internet platforms, DeFi lending is a typical two-sided market where depositors and borrowers are on opposite ends of supply and demand. Growth in one side of the lending market stimulates business volume on the other side, making it harder for later competitors to catch up. Additionally, the more abundant the platform's overall liquidity, the smoother the liquidity flow for both depositors and borrowers, making it more attractive to large capital users, who in turn stimulate the platform's business growth.
Excellent DAO management level: The Aave protocol has fully implemented DAO-based governance. Compared to a centralized management model, DAO-based governance offers more comprehensive information disclosure and more thorough community discussions on important decisions. Furthermore, the Aave DAO community includes a number of highly skilled governance institutions, including leading VCs, university blockchain clubs, market makers, risk management service providers, third-party development teams, and financial consulting teams, providing a rich and diverse source of governance participation. From the project's operational results, Aave, as a latecomer in the peer-to-pool lending service, has balanced growth and security well in product development and asset expansion, surpassing the older brother Compound, with DAO governance playing a key role in this process.
Multi-chain ecosystem positioning: Aave is deployed on almost all EVM L1 and L2 networks, with TVL generally ranking at the top across chains. In the upcoming V4 version currently under development, Aave will achieve inter-chain liquidity integration, making the advantages of cross-chain liquidity even more apparent. Aave will also expand to Aptos (the first non-EVM chain), Linea, and return to Sonic (formerly Fantom).
- Main Challenges and Risks
Although Aave's market share has steadily increased over the past year, the rapid development of new competitor Morpho cannot be underestimated.
In contrast to Aave's collateral asset categories, various risk parameters, and oracles being centrally managed by Aave DAO, Morpho has adopted a more open model: providing an open lending base protocol that allows for the permissionless construction of independent lending markets, with the freedom to choose collateral assets, risk parameters, and oracles. Additionally, it has introduced vaults built by professional third-party institutions like Gaunlet, where users can directly deposit funds into the vaults, and the managing institutions assess risks before deciding which lending markets to lend funds to for returns.
This open combination approach is more conducive to Morpho's ecosystem quickly entering newer or niche lending markets. For example, new stablecoin projects like Usual and Resolv have built lending markets on Morpho, allowing users to obtain project returns or points through circular loans.
I will analyze more about Morpho in detail later.
In addition to competition from the Ethereum ecosystem, Aave's development is also influenced by competition between the Ethereum ecosystem and other high-performance L1s. If ecosystems represented by Solana continue to encroach on Ethereum's territory, Aave's business ceiling, which is heavily reliant on the Ethereum ecosystem, will undoubtedly be limited.
Moreover, the highly cyclical nature of the crypto market will directly affect Aave's user demand. When the market enters a bear cycle, speculative and arbitrage opportunities quickly shrink, leading to a significant decline in Aave's loan volume and protocol revenue, which is a commonality among various lending protocols and will not be elaborated on further.
- Valuation Reference
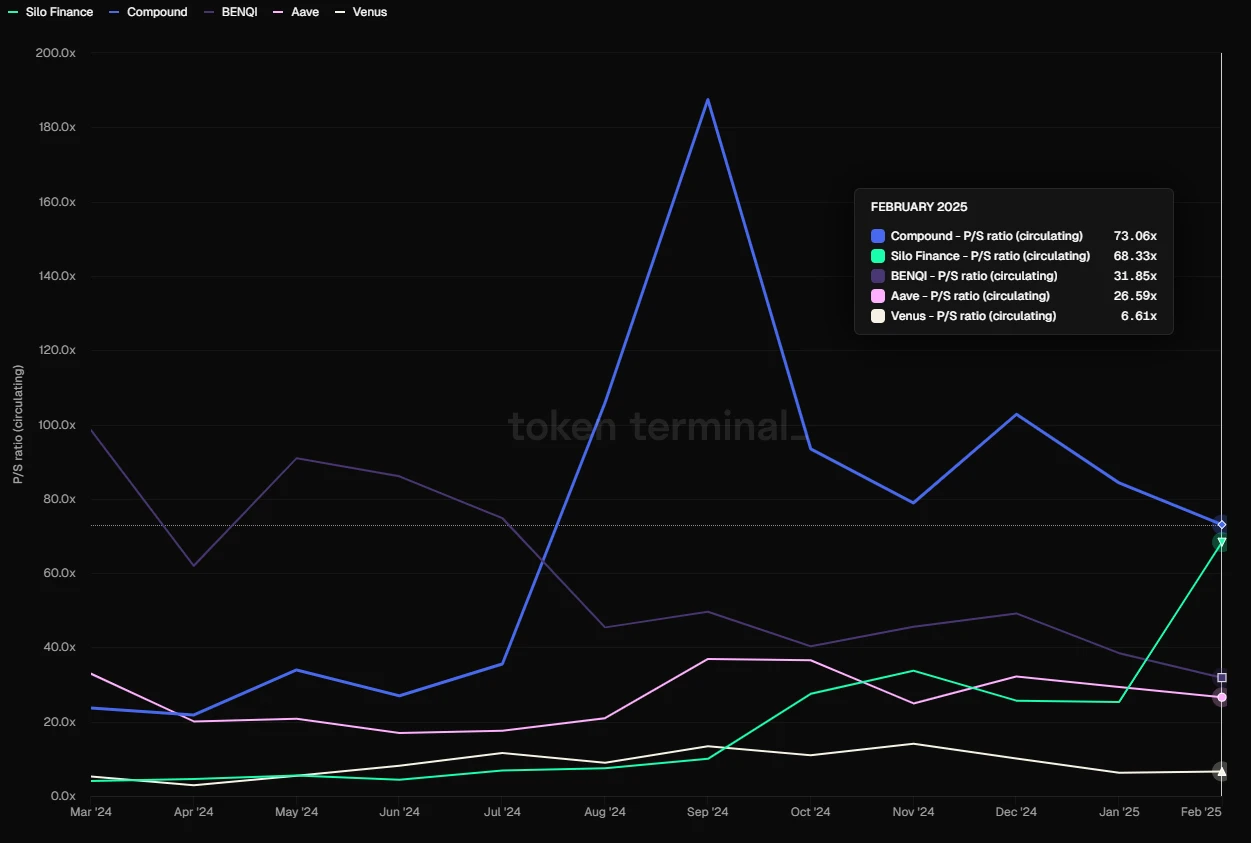
From a vertical valuation perspective, Aave currently has a PS (price-to-sales ratio, the ratio of fully diluted market cap to protocol revenue) of 28.23, which is in the median range over the past year, still far from the PS values of over 100 during the peak periods of 2021-2023.
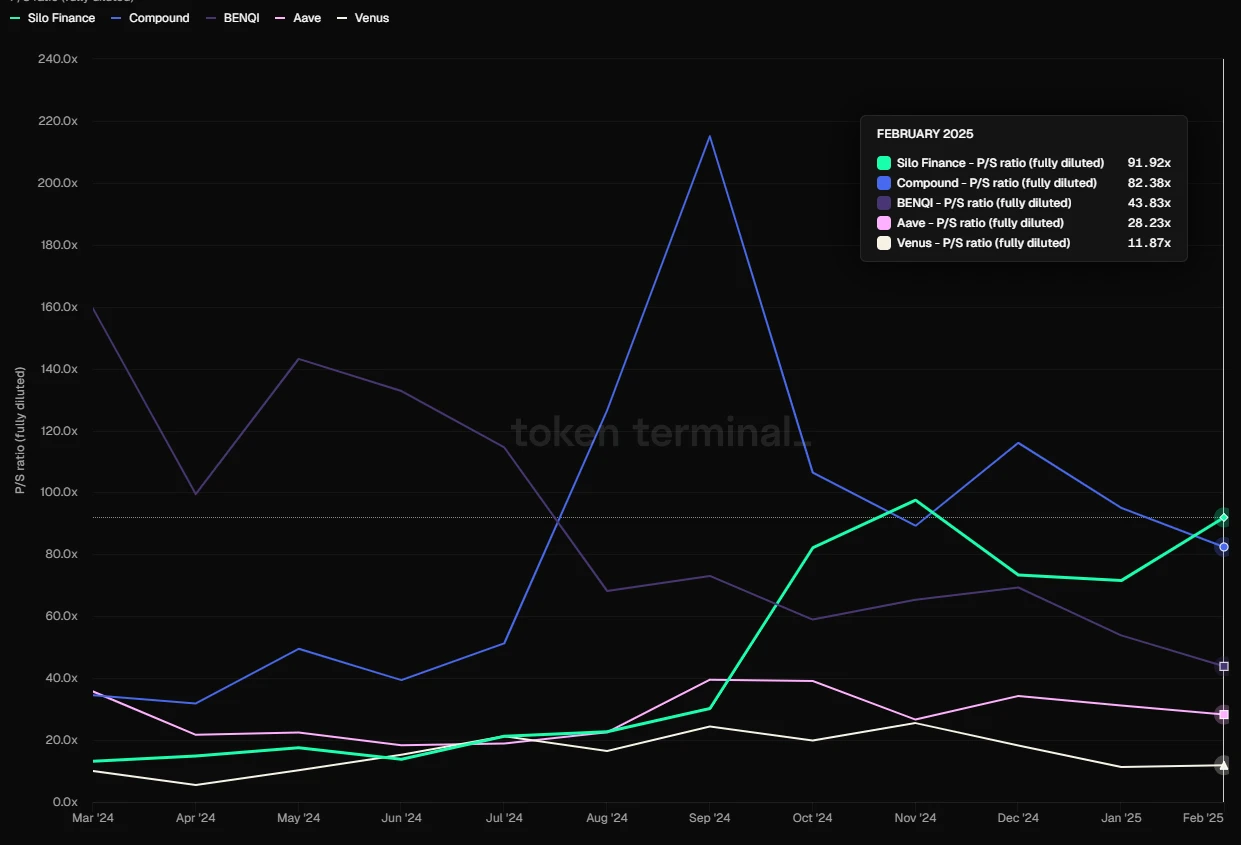
PS of mainstream lending protocols (based on FDV), Data Source: Tokenterminal
In horizontal comparison, Aave's PS metric is significantly lower than that of Compound, Silo, and Benqi, but higher than Venus.
However, it is important to consider that DeFi, similar to traditional financial enterprises, has highly cyclical earnings multiples, often showing a rapid decline in PS during bull markets and remaining high during bear markets.
1.2 Morpho: The Rising Star
Morpho started as a yield optimization protocol based on Compound and Aave, originally a project that relied on the two. However, in 2024, it officially launched the permissionless lending base protocol Morpho Blue, becoming a direct competitor to leading lending projects like Aave. After the launch of Morpho Blue, its business grew rapidly, gaining favor from new projects and assets. Morpho currently provides services on Ethereum and Base.
- Business Status
Morpho has several products, specifically including:
- Morpho Optimizers
Morpho's initial product aimed to enhance the capital efficiency of existing DeFi lending protocols (such as Aave and Compound). By depositing user funds on these platforms to earn base returns while matching funds peer-to-peer based on lending demand, it optimizes the use of funds.
As Morpho's first-generation product, Morpho Optimizers accumulated a large number of users and funds, allowing it to avoid a cold start after launching Morpho Blue. However, despite still having considerable funds, the interest rate optimization brought by its matching function has dropped to a negligible level, and this product is no longer a focus for Morpho's development, having prohibited further deposits and borrowing since December last year.
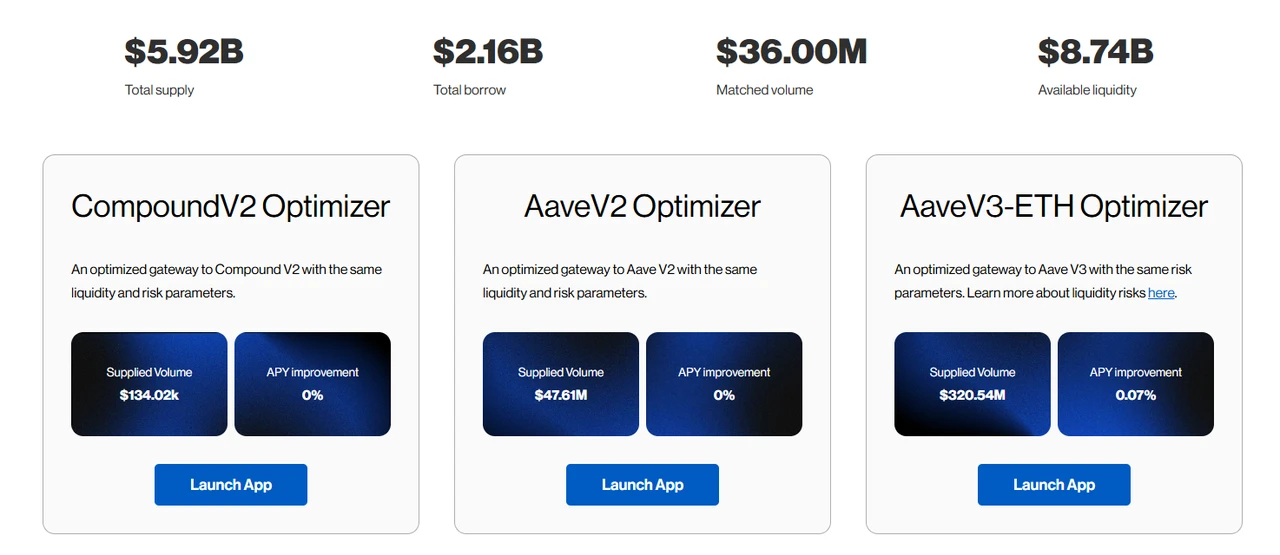
Due to the extremely low matching rate, the current optimization of interest rates by Optimizers is only 0.07%, Source: https://optimizers.morpho.org/
- Morpho Blue (or simply Morpho)
Morpho Blue is a permissionless lending base layer that allows users to create custom lending markets. Users can freely choose collateral assets, loan assets, liquidation ratios (LLTV), oracles, and interest rate models, creating independent markets. The design of the protocol ensures that external governance intervention is unnecessary, allowing market creators to manage risks and returns based on their assessments, thus meeting different market demands.
After its launch, Morpho Blue's rapid business growth quickly put pressure on lending leader Aave, which subsequently introduced a Merit incentive program for users. In addition to rewards for users who utilize Aave according to the incentive rules, addresses using Morpho will face incentive reductions.
Before the launch of Morpho Blue, most projects focusing on niche and new asset isolated lending markets were not very successful, such as Euler and Silo, with most funds still occurring in centralized lending platforms like Aave, Compound, and Spark that use mainstream blue-chip assets as collateral.
However, Morpho Blue has now essentially paved the way for this, and its success comes from several aspects:
A long-standing, good security record. Before the launch of Morpho Blue, Morpho Optimizers had also long managed a large amount of funds without any issues, which has built a good brand trust among DeFi users for Morpho.
Focusing solely on the underlying protocol for lending markets, it has opened up the design of supported assets, asset parameters, oracle selection, and management authority of financial funds, which brings several benefits:
It further opens up the market freedom for lending, allowing for quicker responses to frontline lending market demands. New protocol asset issuers actively come to Morpho to build markets, providing leverage services around their assets, while professional risk service institutions like Gaunlet can launch their own managed financial vaults, directly profiting from the performance fees of the vaults, breaking away from the previous single model of charging for services provided to large lending protocols (Aave, Compound, Venus).
It enables further specialization in lending services, allowing participants in each link to perform their respective roles, fully competing in the free market based on Morpho Blue, enriching the range of product options. More importantly, through the "free outsourcing" of each link, it eliminates the costs associated with self-operating related businesses, such as frequent protocol upgrades and code audits, and specialized risk service provider fees.
- MetaMorpho Vaults
MetaMorpho Vaults are asset management tools designed to simplify the lending process, providing liquidity and yield opportunities. Users can earn returns by depositing assets into vaults managed by professional teams, which are optimized based on unique risk configurations and strategies. Currently, the main destination for the funds absorbed by various Vaults is the lending markets built on Morpho Blue.
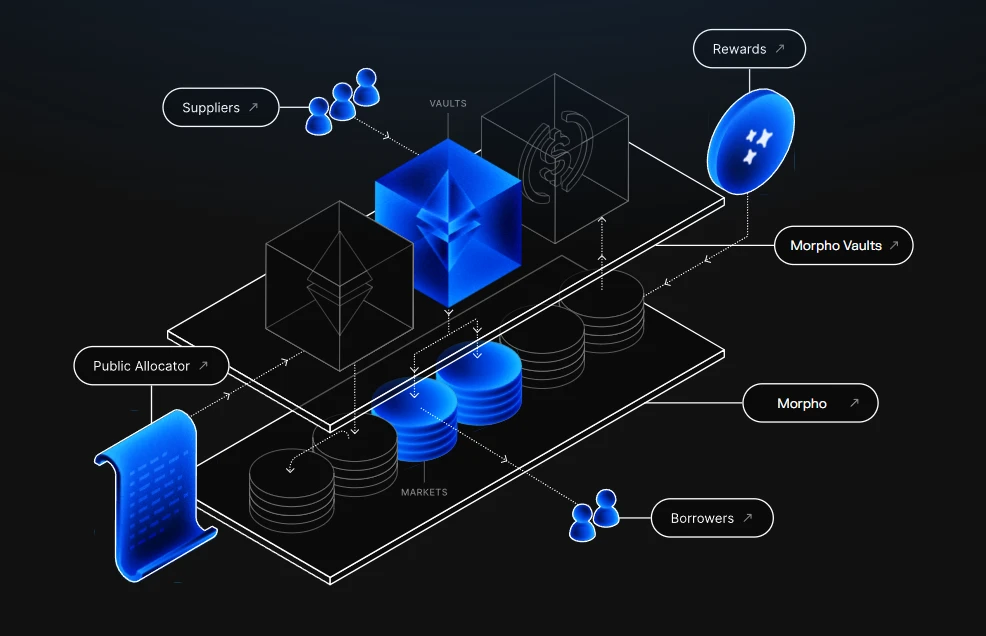
Morpho's Product Structure Diagram
After understanding Morpho's product situation, let's take a look at Morpho's main business data.
- Loan Volume (Active loans)
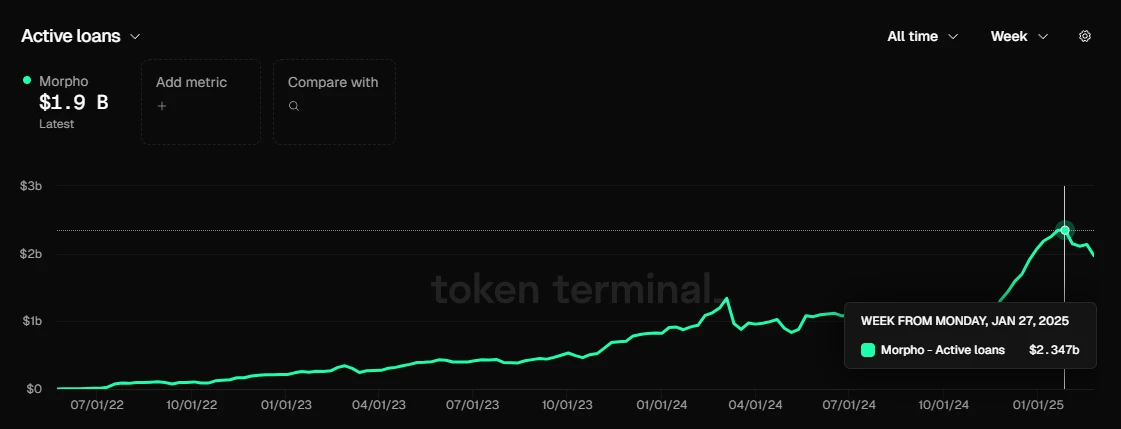
Morpho's loan volume, Data Source: Tokenterminal
Morpho's peak total loan volume, similar to Aave, occurred at the end of January, reaching $2.35 billion, and is currently at $1.9 billion.
Morpho has not yet officially launched protocol fees, so it has not generated protocol revenue. However, we can observe the amount of its Fee (the total income earned by depositors from the protocol) and estimate the potential protocol revenue Morpho could generate if it activates protocol fees in the future.
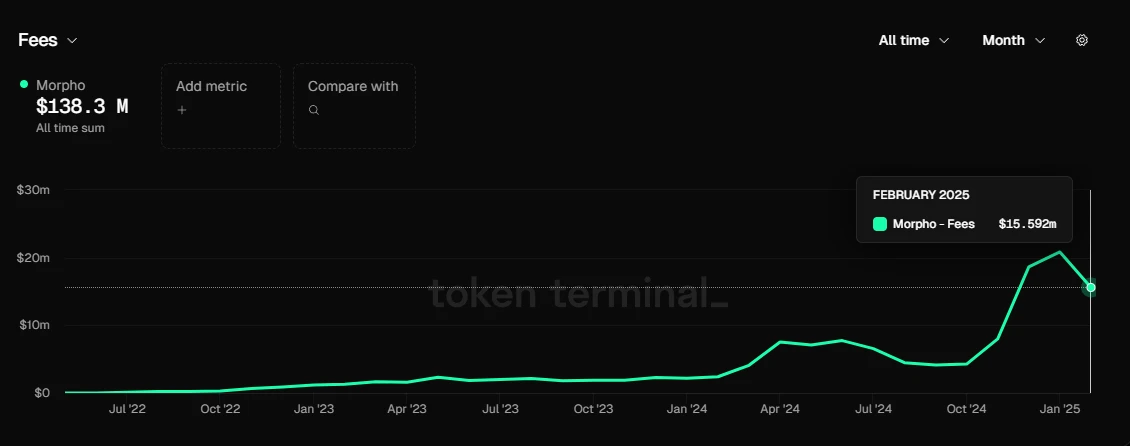
Comparison of Fees between Morpho and Aave, Data Source: Tokenterminal
In February 2025, Aave generated a total Fee of $67.12 million, while Morpho generated $15.59 million.
In the same period in February 2025, Aave created $8.57 million in protocol revenue from the generated $67.12 million Fee, indicating an approximate fee retention rate of $8.57/$67.12 = 12.8% (this is a rough calculation).
Considering that Aave is a lending protocol operated by Aave DAO, it can retain all income from its lending market while bearing all operational expenses of the protocol.
In contrast, Morpho is a foundational protocol serving the lending market, with many third-party participants active on this basis, such as market creators and vault operators. Therefore, even if Morpho activates protocol fees in the future, the ratio of protocol revenue it can extract from the generated Fees will certainly be significantly lower than Aave (due to the need to share with other service providers). I estimate that Morpho's actual fee retention rate should be about 30-50% of Aave's, which means 12.8 * 0.3% * (30%-50%) = 3.84%~6.4%.
Calculating (3.84%~6.4%) * $15.59 million, we can estimate that if Morpho activates protocol fees, it could generate approximately $598,700 to $997,800 in protocol revenue from the total fees of $15.59 million created in February, which is about 7% to 11.6% of Aave's protocol revenue.
- Token Incentives
Morpho is currently using its own token, Morpho, for incentives. However, unlike Aave, Morpho directly incentivizes users' borrowing and lending behaviors, while Aave incentivizes deposit insurance. Therefore, the organic nature of Morpho's core business data is not as strong as Aave's.
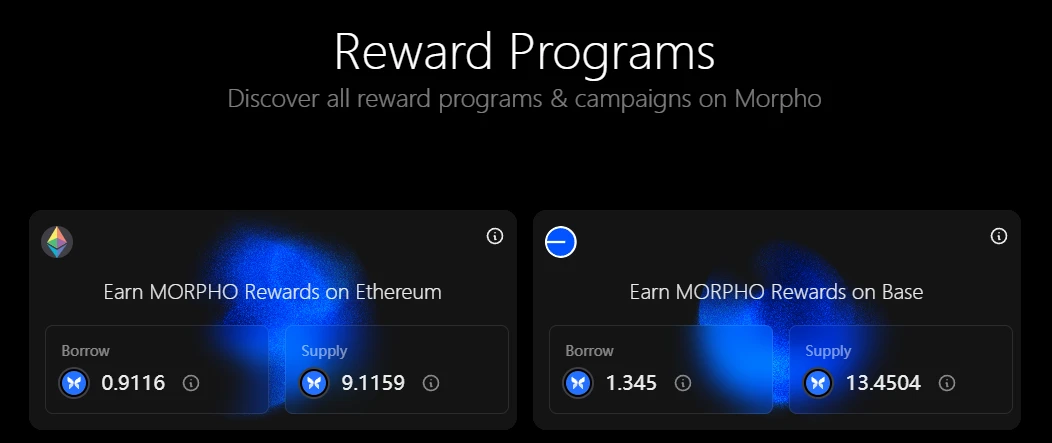
Morpho's Token Incentive Dashboard, Source: https://rewards.morpho.org/
According to Morpho's token incentive dashboard, in the Ethereum market, Morpho currently offers a comprehensive subsidy rate of about 0.2% for borrowing behavior and about 2% for deposit behavior; in the Base market, Morpho currently offers a comprehensive subsidy rate of about 0.29% for borrowing behavior and about 3% for deposit behavior.
However, Morpho has been making frequent adjustments to its token incentives. Since December of last year, the Morpho community has initiated three proposals to continuously reduce the subsidies for user borrowing and lending behaviors.
The most recent adjustment to Morpho's incentives occurred on February 21, reducing the number of reward tokens on ETH and BASE by 25%. After the adjustment, Morpho's annual incentive expenditure will be:
Ethereum: 11,730,934.98 MORPHO/year
Base: 3,185,016.06 MORPHO/year
Total: 14,915,951.04 MORPHO/year
Based on today's (March 3, 2024) Morpho market price, the corresponding annual incentive budget is $31.92 million. Given Morpho's current protocol scale and generated fees, this incentive amount seems quite substantial.
However, it is expected that Morpho will continue to lower its incentive expenditures and ultimately stop subsidies.
- Competitive Situation
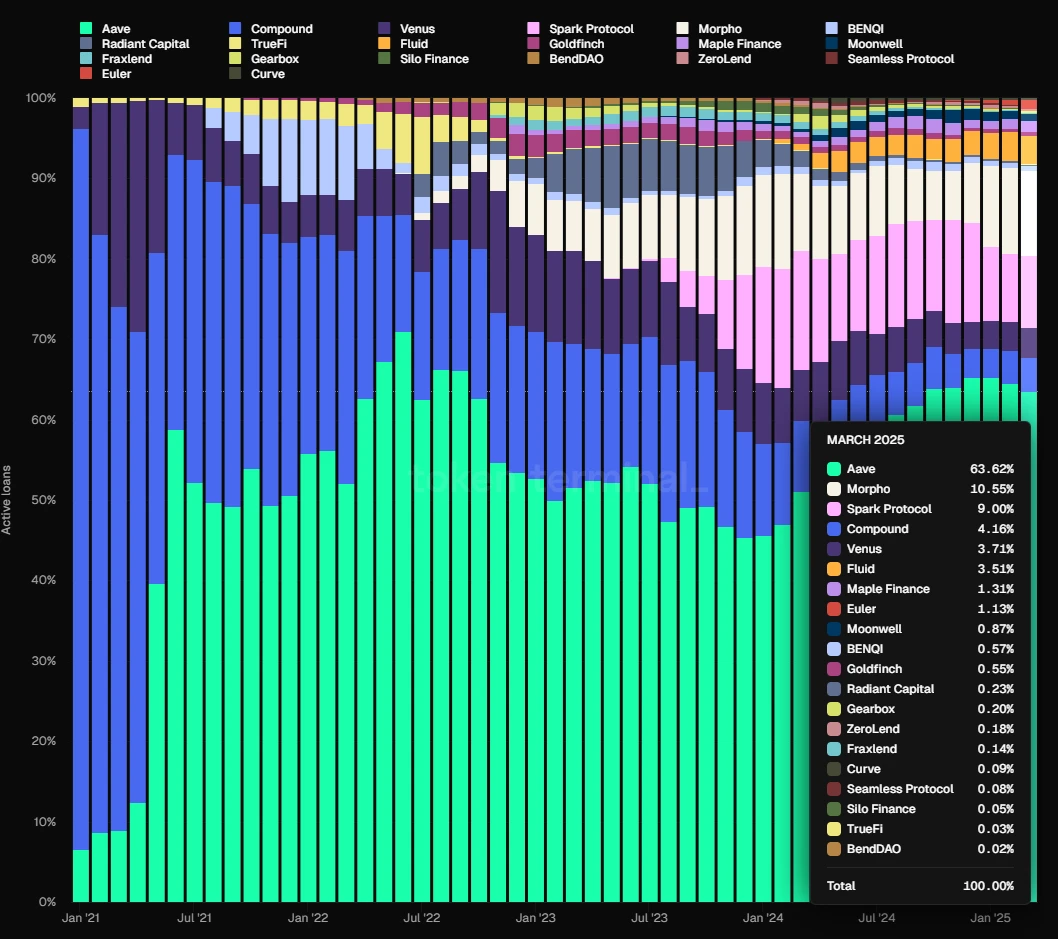
Data Source: Tokenterminal
In terms of market share of total loan amounts, Morpho accounts for 10.55%, slightly higher than Spark, but still significantly lower than Aave, placing it in the second tier of the lending market.
- Morpho's Competitive Advantages
Morpho's competitive moat mainly comes from the following two aspects:
A solid security history. The Morpho protocol was not launched late; since the introduction of its yield optimization product, it has nearly three years of operational history without any major security incidents, accumulating a good reputation for security. The increasingly large amount of funds it attracts also indirectly confirms user trust in it.
Focus on the lending base protocol. The benefits of this approach have been analyzed above, facilitating the entry of more participants into the ecosystem to provide richer and faster lending market options, enhancing specialization in the division of labor, and reducing operational costs of the protocol.
- Main Challenges and Risks
Morpho's main challenges include competition from other lending protocols, the ecological impact of competition between Ethereum and L1s like Solana, and significant unlocking pressure on its tokens in the coming year.
According to tokenomist data, the amount of new tokens to be unlocked for Morpho in the next year is equivalent to 98.43% of the currently circulating total token supply, meaning the token inflation rate in the coming year is close to 100%. Most of these tokens belong to early strategic investors, early contributors, and Morpho DAO. This large amount of token liquidation may exert significant pressure on the token price.
- Valuation Reference
Although Morpho has not activated protocol fees, we have already estimated its potential revenue based on the protocol fees it could generate. Based on its February protocol Fee, the estimated protocol revenue could be between $598,700 and $997,800.
Based on its current (March 3) FDV of $2,138,047,873 (Coingecko data) combined with the above revenue data, its PS is: 178~297, which is significantly higher compared to other mainstream lending protocols.
PS of mainstream lending protocols (based on FDV), Data Source: Tokenterminal
However, if calculated based on circulating market capitalization, Morpho's current (March 3) circulating market cap is $481,361,461 (Coingecko data), giving it a PS of: 40.2~67, which is not too expensive compared to other lending protocols.
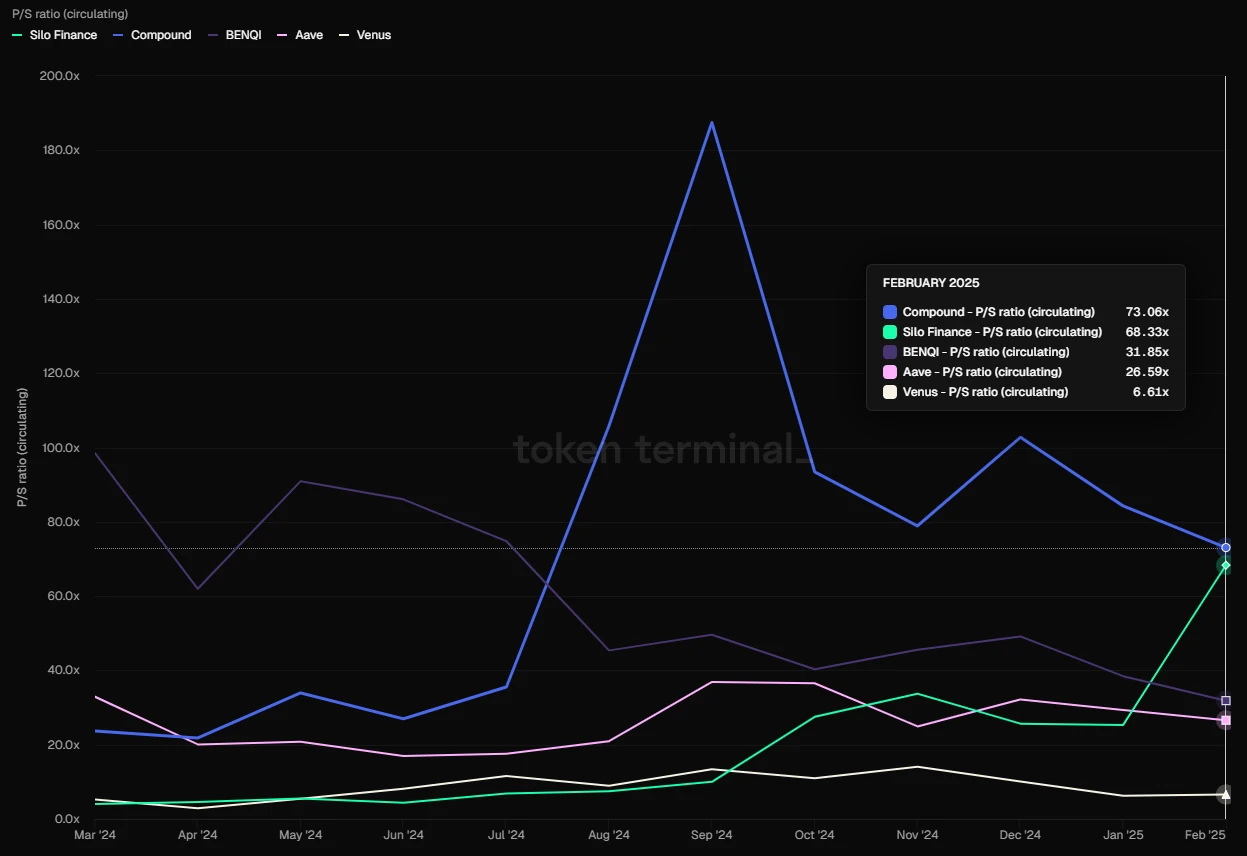
PS of mainstream lending protocols (based on MC), Data Source: Tokenterminal
Of course, using FDV as a market cap reference is a more conservative valuation comparison method.
1.3 Kamino: The Top Player in Solana
Kamino Finance is a comprehensive DeFi protocol based on Solana, established in 2022. Its initially launched product was an automated management tool for concentrated liquidity, and it currently integrates lending, liquidity, leverage, and trading functions. However, lending is its core business, and most of the protocol's revenue is contributed by lending activities. Kamino has various fees, including a share of interest income, a one-time initial fee charged at the time of borrowing, liquidation fees, and fees for liquidity management, which include deposit fees, withdrawal fees, and performance fees.
- Business Status
Loan Volume (Active loans)
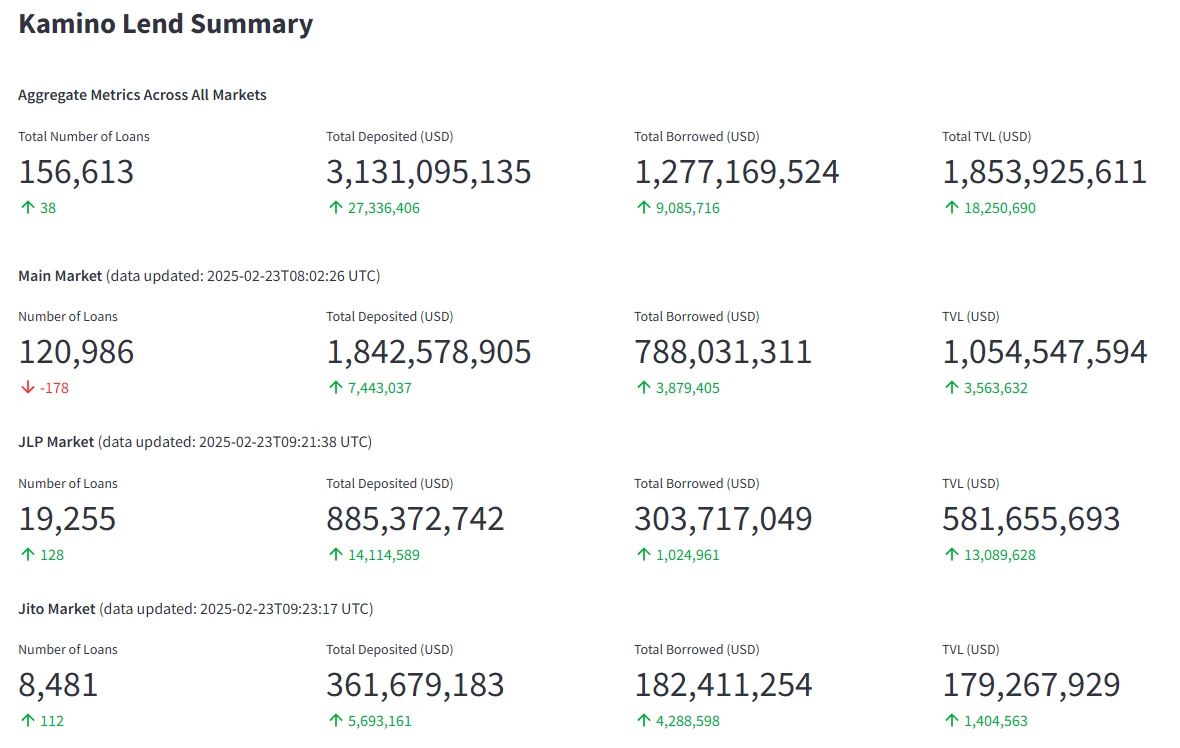
Kamino's main data indicators, Data Source: https://risk.kamino.finance/
Kamino currently has a loan volume of $1.27 billion, with a peak loan amount of $1.538 billion, also occurring in late January of this year.
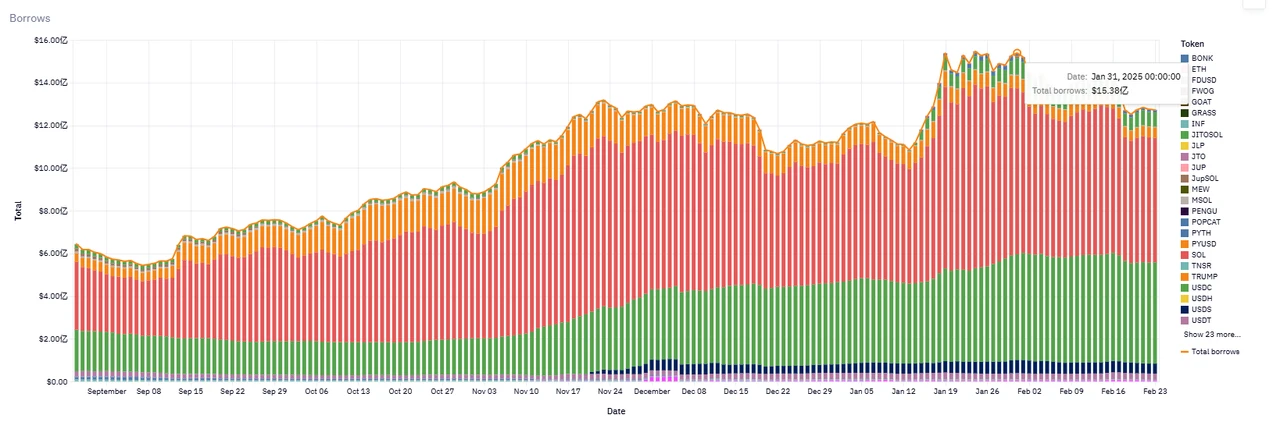
Kamino's loan scale trend, Data Source: https://allez.xyz/kamino
Protocol Revenue
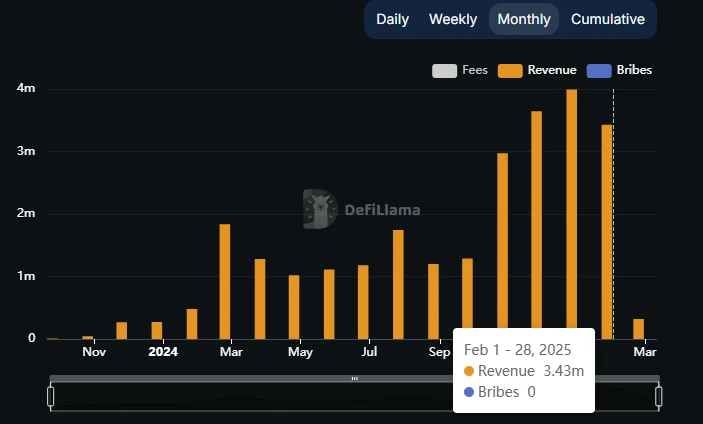
Total revenue of the Kamino protocol, Source: DefiLlama
January was the month with the highest revenue for the Kamino protocol, reaching $3.99 million. However, February's revenue was also good, at $3.43 million.
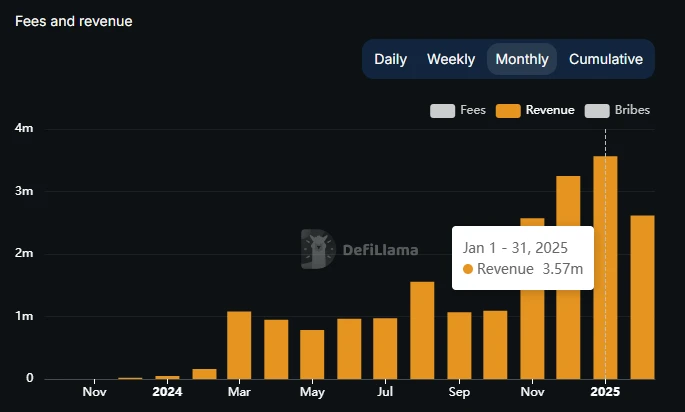
Revenue from lending in the Kamino protocol, Source: DefiLlama
The lending portion accounts for the majority of Kamino's protocol revenue; for example, in January, the revenue from lending accounted for 89.5% of the total protocol revenue.
- Token Incentives
Unlike other lending protocols that directly incentivize users with tokens, Kamino adopts a new incentive model that emerged in this cycle, namely the "seasonal points system." Users earn project points by completing officially designated incentive actions, and at the end of the season, the total amount of tokens awarded for each season is distributed based on individual point proportions.
The first season of Kamino's points system lasted three months, distributing 7.5% of the total token supply as a genesis airdrop. The second season's points activity also lasted three months, distributing 3.5% of the total token supply.
Based on the current token price, the total amount of 11% KMNO tokens distributed in these two seasons is valued at $105 million, and the high token rewards have been a major driving force behind Kamino's rapid growth in business data over the past year.
Currently, Kamino's third points season is still ongoing. Unlike the previous two seasons, the third season started on August 1 of last year and has already lasted over six months without ending. However, this has not slowed down Kamino's protocol growth. If the third season's airdrop maintains a scale similar to the second season, the value of the airdrop incentive is expected to be between $30 million and $40 million.
It is worth noting that one of the main functions of Kamino's KMNO token is to accelerate users' point acquisition in the season through staking, which enhances user engagement with the product and token holdings.
- Competitive Situation
On the Solana chain, the main lending protocols include Kamino, Solend, and MarginFi.
Kamino: Currently holds a market share of 70% to 75% (based on loan scale), and its market share in Solana is even stronger than Aave's position in Ethereum.
Solend: Led the market from 2022 to 2023, but growth slowed in 2024, with market share dropping to less than 20%.
MarginFi: After a management crisis in April 2024, a large amount of user assets were withdrawn, and the project's share fell to single digits.
Kamino's total locked value (TVL) has firmly remained in the top two on Solana, second only to Jito, which focuses on staking. Its lending TVL has also significantly surpassed former competitors like Solend and MarginFi.
- Kamino's Competitive Advantages
Rapid product iteration and good delivery capability: Kamino was founded in 2022 by members of the Hubble team, initially positioned as the first concentrated liquidity market-making optimizer on the Solana chain. This first-mover product allowed Kamino to meet user needs in concentrated liquidity market-making, providing automated and optimized yield liquidity vault solutions. Based on this, Kamino further expanded into lending, leverage, trading, and other product modules, forming a full-stack DeFi product matrix. Such an integrated DeFi project spanning multiple scenarios is rare, and the Kamino team continues to explore new business opportunities.
Active ecosystem integration capability: Kamino has been actively building a cooperative network both within and outside the Solana ecosystem. A notable example is the integration with PayPal's stablecoin—Kamino is the first Solana protocol to launch and support PYUSD lending, occupying a major position in the expansion of this asset. Additionally, it has partnered with the Solana staking project Jito to launch leverage products related to JitoSOL, attracting a large number of SOL staking users into the Kamino ecosystem. When Kamino Lend announced its upcoming V2 upgrade in 2024, it also planned to introduce new features such as order book lending and support for real-world assets (RWA), as well as open modular interfaces for other protocols to connect. These initiatives will further embed Kamino into the underlying financial infrastructure of the Solana ecosystem, making it harder for competitors to shake its position as more projects build on Kamino.
Scale effects and network effects: There is a clear "the strong get stronger" effect in the DeFi lending field, and Kamino's rapid expansion in 2024 reflects this network effect. Higher TVL and liquidity mean that borrowing and lending on the platform is safer and has lower slippage, which also boosts the confidence of large capital inflows. A larger capital scale itself serves as a competitive barrier: funds tend to flow to the most liquid platforms, further enhancing that platform's scale. Kamino benefits from the positive feedback brought by this network effect through the liquidity and users accumulated from its first-mover advantage.
Good record in risk management: To date, Kamino has not experienced any major security incidents or large-scale liquidation of bad debts, in contrast to competitors like MarginFi, which have faced turmoil that pushed ecosystem users toward Kamino.
- Main Challenges and Risks
In addition to common risks faced by newer lending protocols, such as contract security and asset parameter design, potential issues for Kamino include:
- Token Economics, Inflation Pressure, and Profit Distribution
The points season model adopted by Kamino has a slight Ponzi-like nature, similar to Ethena. If the value of the airdropped tokens does not meet expectations, it may lead to some user attrition (though the project's goals have already been achieved at its current scale). Additionally, according to tokenomist data, the amount of KMNO to be unlocked in the next year is also quite large, with an inflation rate as high as 170% based on the current circulating tokens. Finally, it seems that all of Kamino's protocol revenue currently goes into the team's pockets, with no distribution to token holders and not even entering the treasury. There are no signs of decentralized governance being initiated in the short term; while this is normal in the early stages of a project, if protocol revenue is not incorporated into a treasury controlled by the project's DAO for a long time, and there is no transparent governance and financial planning, with everything monopolized by the core team, the expected value of the protocol token may further decline.
- Development of the Solana Ecosystem
Although the Solana ecosystem has developed significantly better than Ethereum in this cycle, there has not yet been a clear product-market fit (PMF) track type in Solana beyond memes. DeFi remains a stronghold of the Ethereum series. Whether Solana can continue to broaden asset categories and capacity and attract more funds is crucial for Kamino's ceiling.
- Valuation Reference
Kamino's 30-day protocol revenue, Data Source: https://allez.xyz/kamino/revenue
Using Kamino's protocol revenue over the past 30 days and its FDV as a benchmark, we calculate its FDV and MC market cap (based on Coingecko market cap data) to obtain:
FDV PS = 34, MC PS = 4.7, which is not high compared to other mainstream lending protocols.
1.4. MakerDAO: Old Tree, New Flowers?
MakerDAO is one of the earliest DeFi protocols on the Ethereum chain, established in 2015, making it ten years old. With its first-mover advantage, its stablecoin DAI (including the upgraded USDS) has long been the largest decentralized stablecoin in the market.
In terms of business model, MakerDAO's main revenue comes from the stability fees paid for generating DAI and the spread of DAI, which is very similar to the interest spread of lending protocols: borrowing DAI from the protocol requires payment of a fee; providing excess liquidity (sUSDS & sDAI) to the protocol can earn interest.
Moreover, from a business process perspective, the process of depositing ETH to obtain DAI, which is a type of CDP (Collateralized Debt Position) stablecoin, is not much different from depositing ETH into AAVE to borrow USDC. Therefore, in early DeFi analyses, many people also viewed MakerDAO's CDP protocols as a type of lending protocol. After rebranding to Sky, MakerDAO also launched a separate lending protocol called Spark, which is why we also consider MakerDAO as a lending protocol for analysis in this section.
- Business Status
Loan Volume (Active loans)
For stablecoin protocols, the most important metric is the scale of their stablecoins, which corresponds to the loan scale of lending protocols.
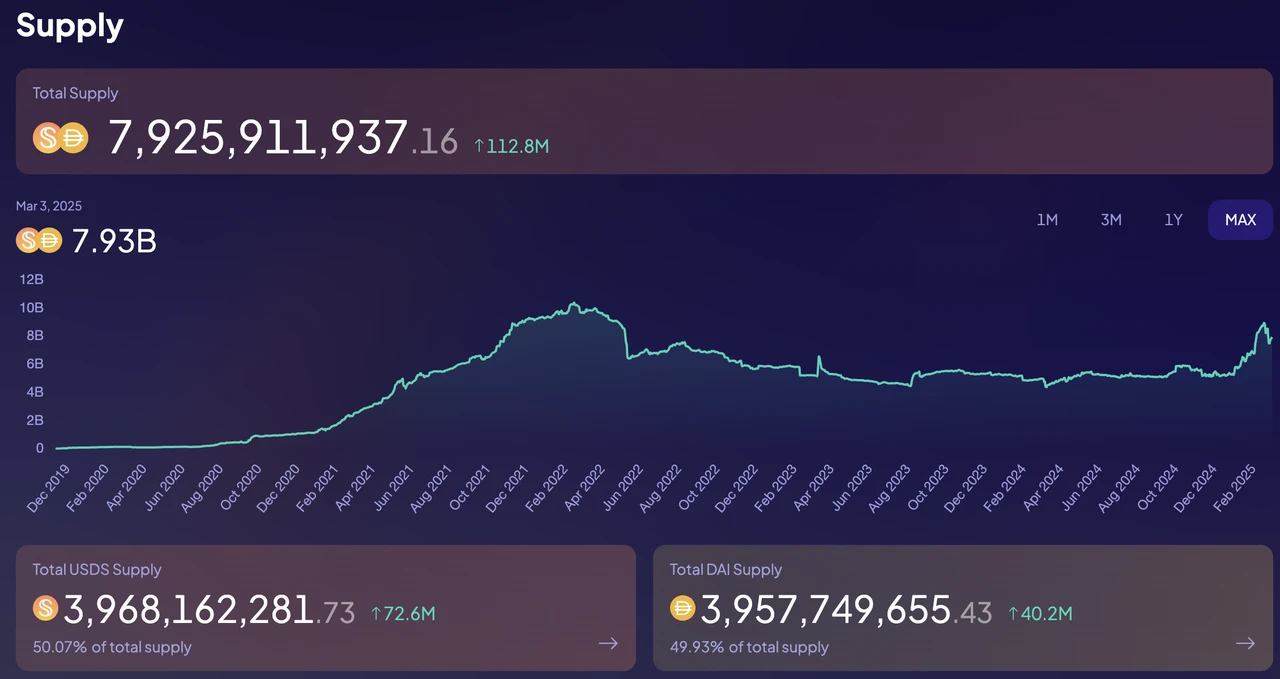
Source: Sky Official Website
MakerDAO's loan scale is currently close to $8 billion, still short of the previous cycle's peak of $10.3 billion.
The loan scale of Spark is around $1.6 billion, which is higher than the older lending protocol Compound and slightly lower than the previously mentioned Morpho.
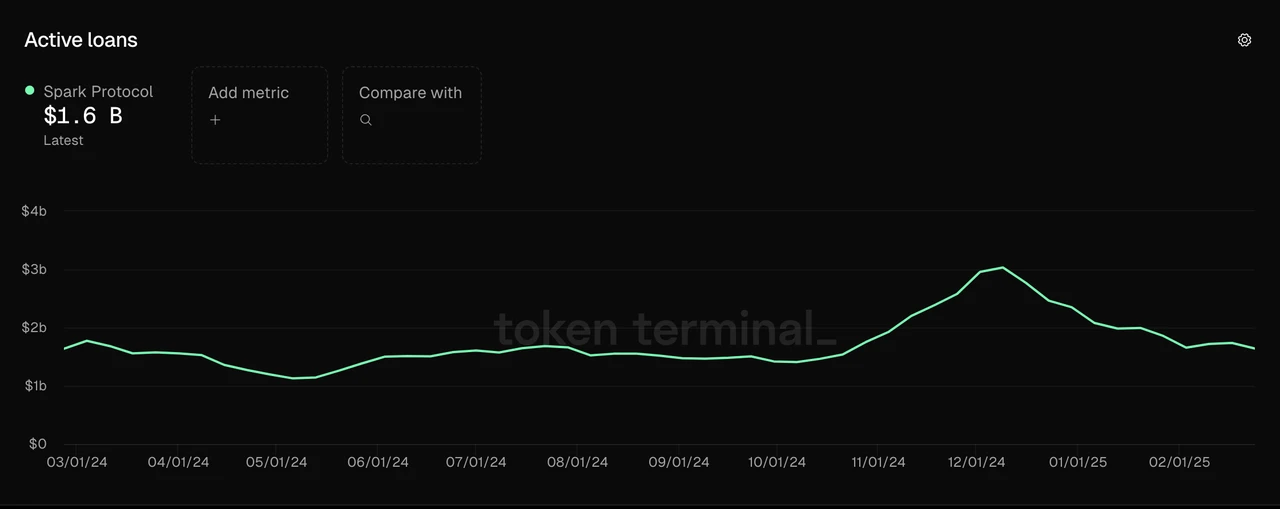
Data Source: Tokenterminal
Protocol Revenue
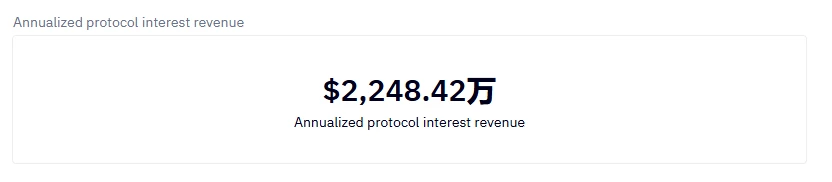
The concept corresponding to MakerDAO's protocol revenue, similar to that of lending protocols, should be the sum of various revenues of the protocol, minus the interest costs paid to sDAI and sUSDS. From the chart below, we can see that currently, MakerDAO's protocol revenue includes $421 million from stability fees, which accounts for the vast majority of its revenue, while other contributions such as liquidation fees and price stability module charges are minimal.
Historical revenue situation of MakerDAO, Source: Sky Official Website
Within the stability fees, the DAI issued through Spark is expected to generate an annual stability fee of $140 million, while DAI generated directly from USDC can also earn $125 million in stability fees. These two parts account for two-thirds of the stability fees, with the remaining stability fees coming from DAI generated from RWA ($71.83 million) and DAI generated from crypto asset collateral ($78.61 million).
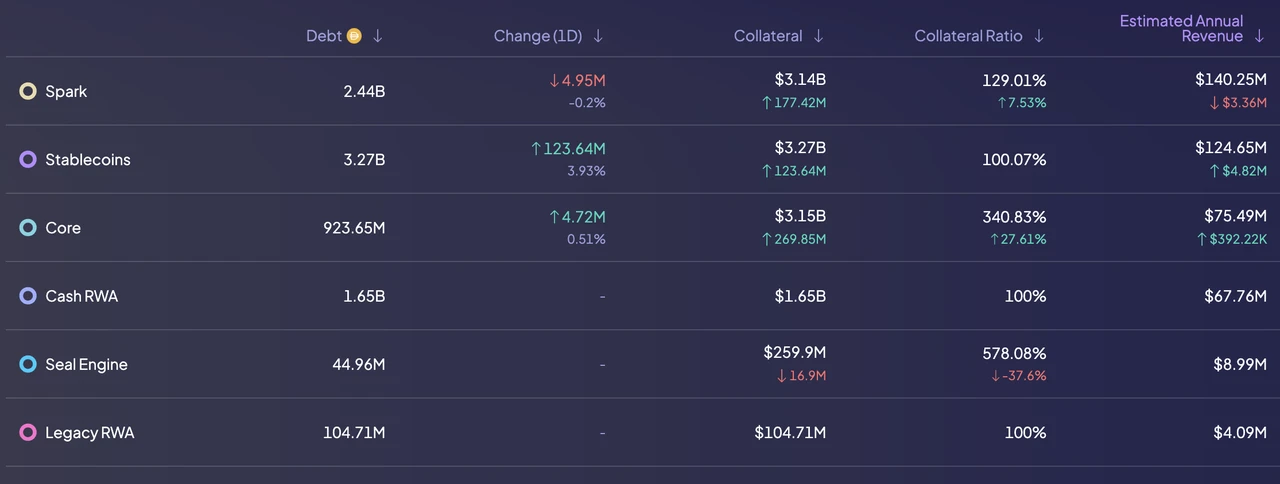
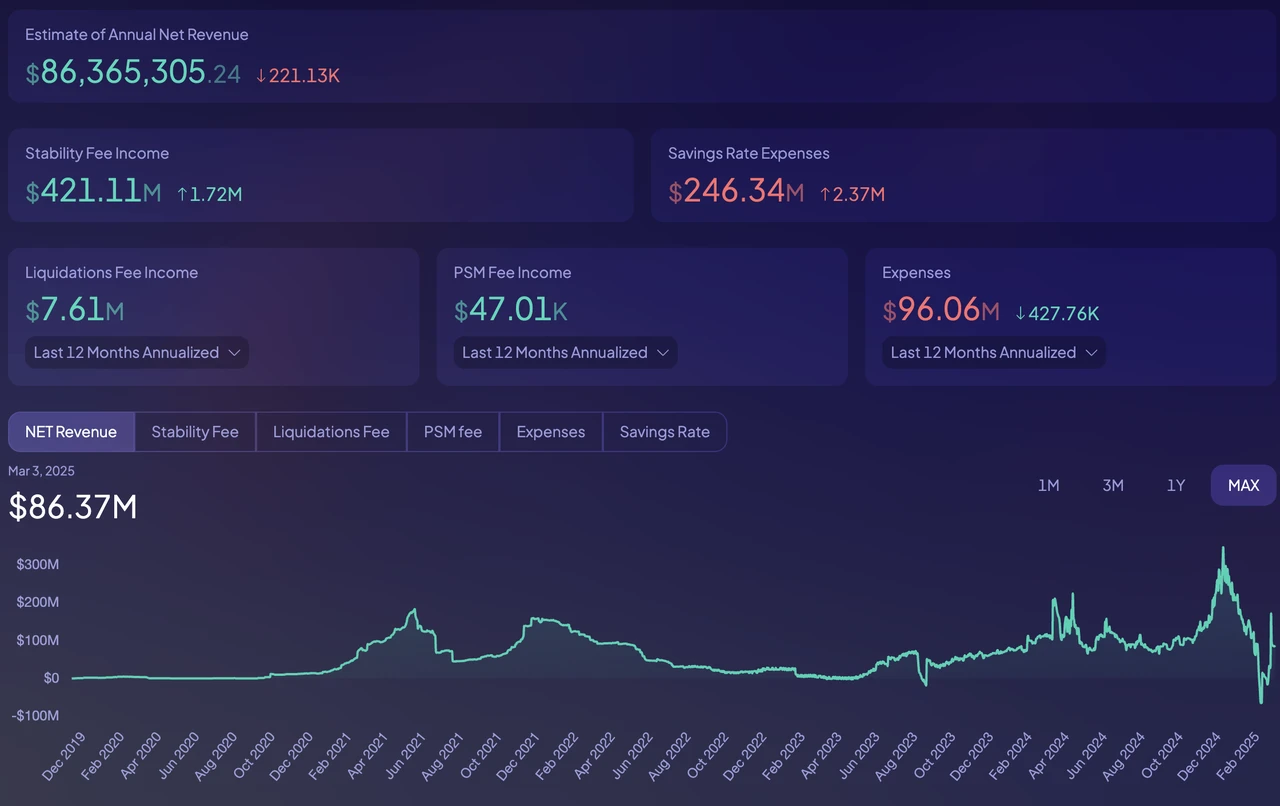
MakerDAO's liability composition and annual revenue, Source: Sky Official Website
To incentivize the generation of these stability fees, MakerDAO expects to pay $246 million in deposit costs (Saving Expense) annually. Subtracting the two, MakerDAO's annual protocol revenue is approximately $175 million, averaging $3.36 million in protocol revenue per week.
Of course, MakerDAO has also disclosed its operational expenses, which amount to $96.6 million annually. After deducting operational expenses from protocol revenue, we arrive at a "net profit" of approximately $78.4 million, which is also the main source of funds for MKR and SKY buybacks.
- Token Incentives
One of the reasons for MakerDAO's brand upgrade was that it no longer had excess MKR reserves to incentivize new business. Currently, MakerDAO's token incentives are primarily used to encourage USDS deposits. Since the incentive program launched at the end of September 2024, a total of 274 million SKY tokens have been released as incentives over the past five months, equivalent to about $17.4 million, with an annualized incentive amount of around $42 million.
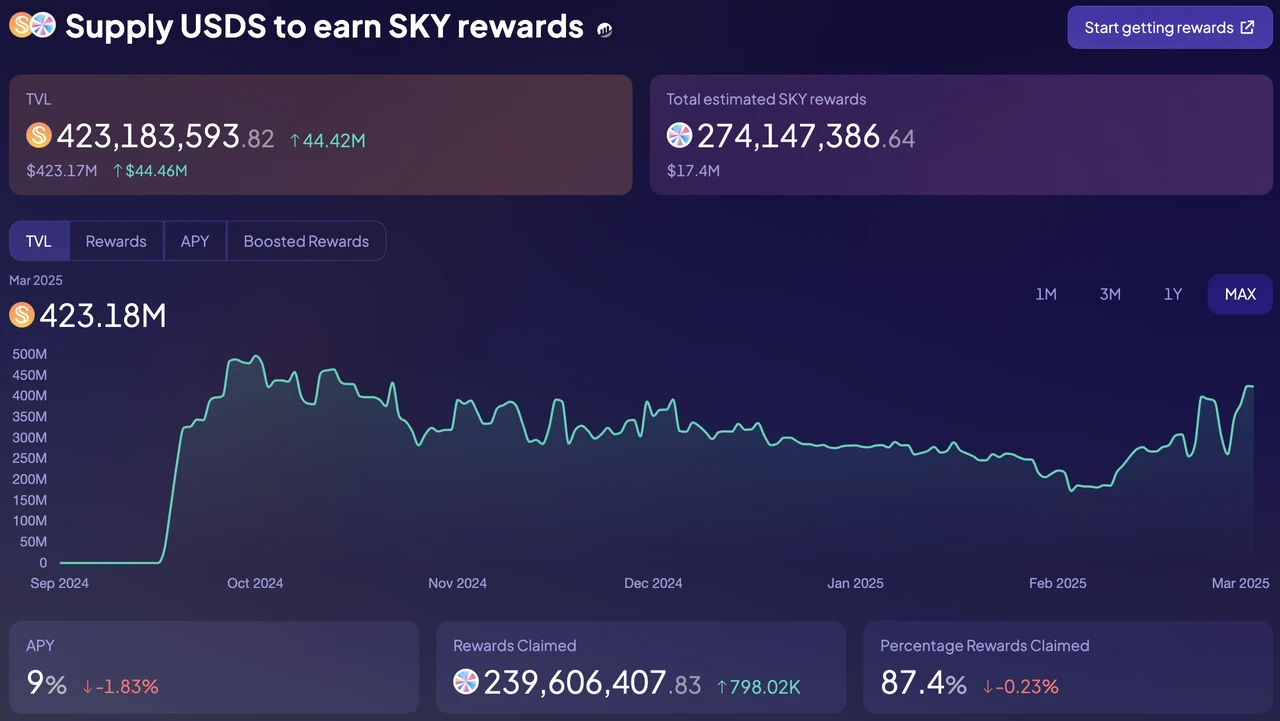
Source: Sky Official Website
- Competitive Situation
Currently, MakerDAO's stablecoin market share is 4.57%. Stablecoins are one of the clearest tracks for cryptocurrency demand, and as an established stablecoin, MakerDAO has formed a certain moat, including brand effect and first-mover advantage. This was particularly evident in the last cycle's liquidity competition, where DAI, as one of the 3CRV tokens, could obtain a large amount of incentives released by other stablecoin projects to establish liquidity without any operation.
However, the competitive situation for MakerDAO in the stablecoin space is not optimistic. From the market share chart below, we can see that MakerDAO's market share (the pink block) has decreased during this cycle.
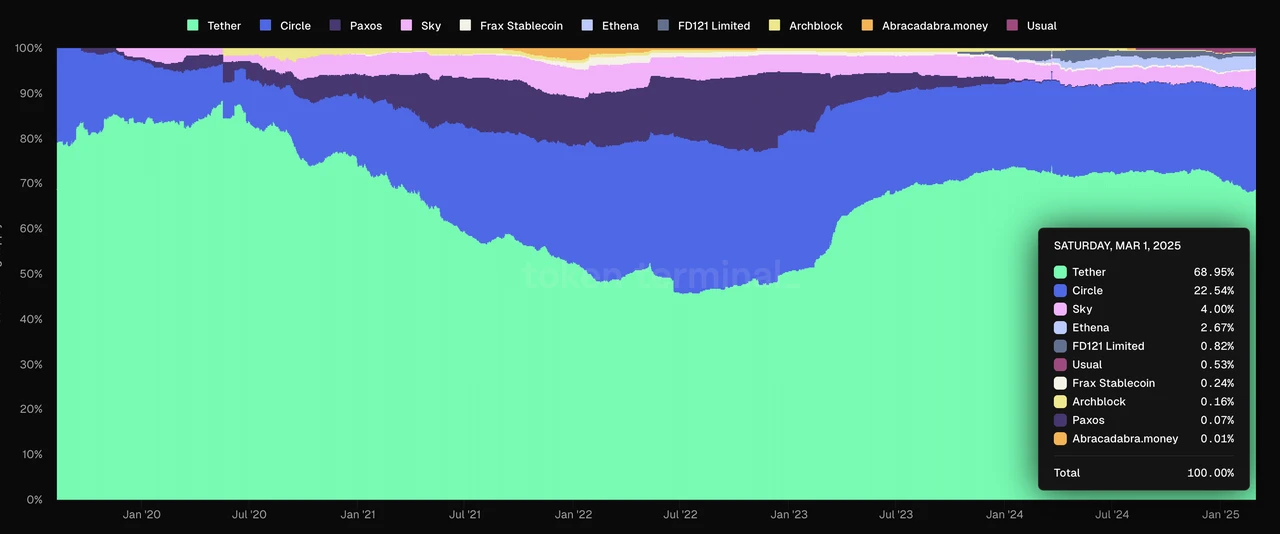
Market share of the top ten stablecoins, Source: Tokenterminal
The core factor causing this phenomenon, in my opinion, is that DAI, as the third-largest stablecoin, has lost (or never truly possessed) the function of a settlement tool. Currently, users hold USDT and DAI for completely different purposes: USDT is primarily used as a settlement tool, while DAI is held for leverage and yield generation. From this perspective, aside from both being pegged to the dollar, their commonalities seem limited.
Stablecoins with settlement functionality have strong network effects, but unfortunately, DAI has essentially lost its role as a settlement tool, making it difficult to form network effects.
This is reflected in the issuance scale, as DAI's market share gradually declines. DAI has not yet returned to its peak issuance scale in 2021, while USDT's issuance scale continues to rise, having doubled compared to the end of 2021.
A stablecoin that merely serves as a yield tool has limited growth potential; its scale growth relies on sustained yield stimulation and depends on many external conditions (such as relatively high U.S. Treasury bond interest rates). How to achieve long-term organic growth is key to whether MakerDAO can bloom anew in the stablecoin market.
- Main Challenges and Risks
In addition to the challenges we analyzed above, MakerDAO also faces competition from newcomers.
The new player in the stablecoin space, Ethena, has developed rapidly, reaching a market scale that is 60% of MakerDAO's within less than a year of its launch. Ethena, which also focuses on yield-generating stablecoins, has a significant advantage over MakerDAO in terms of its yield basis—"cryptocurrency perpetual contract arbitrage yield" is much higher than MakerDAO's "Treasury RWA yield." In the medium to long term, if Treasury bond interest rates continue to decline, USDE will demonstrate a greater competitive advantage over DAI.
Additionally, MakerDAO's governance capabilities are concerning. The MakerDAO team spends $97 million annually, yet the governance results are highly inefficient and opaque. A typical example is the discussion of reverting the MakerDAO brand back to Maker after upgrading to SKY, which seems trivial.
- Valuation Reference
Based on the protocol revenue of $175 million, MKR's current PS is approximately 7.54, which still appears relatively cheap compared to its main competitor Ethena (22). Historically, MKR's PS has also been low.
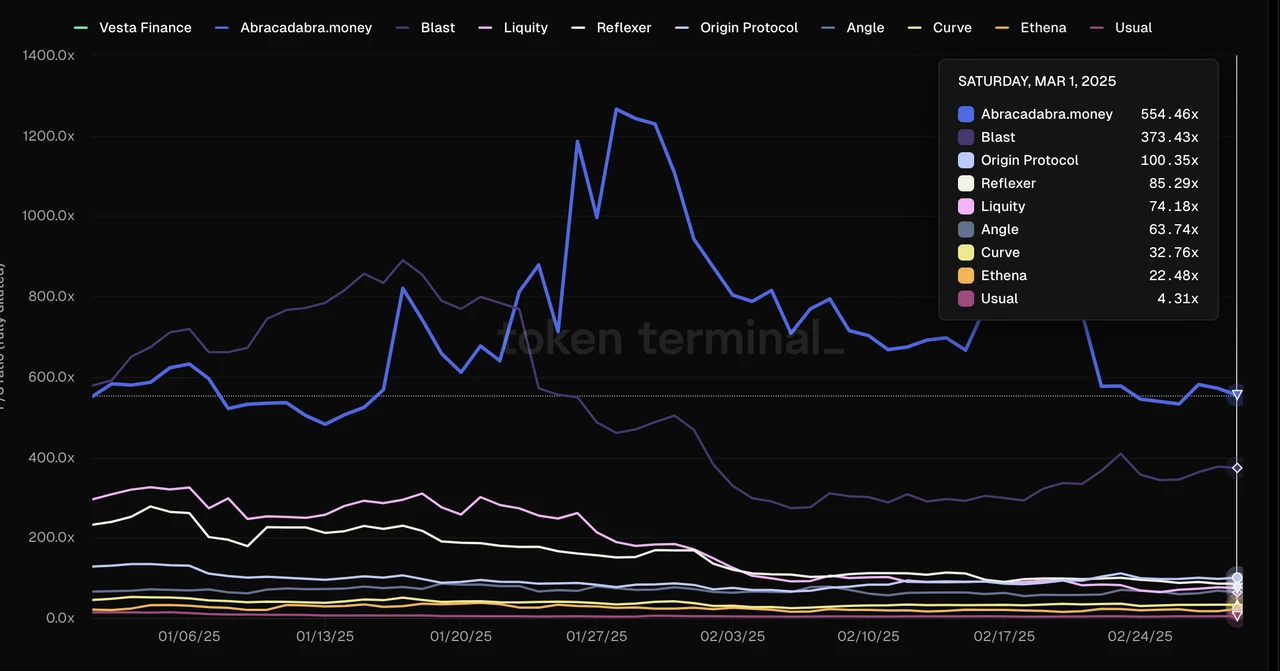
PS of stablecoin projects other than MakerDAO, Source: Tokenterminal
2. Liquid Staking Track: Lido, Jito
Liquid staking is one of the native tracks of cryptocurrency. Compared to native staking, liquid staking offers better liquidity and composability, thus having solid demand and playing a crucial role in the PoS chain ecosystem. Currently, the largest protocols by TVL on the two most important PoS chains, Ethereum and Solana, are liquid staking protocols, which are Lido and Jito that we will introduce next.
For liquid staking projects, the most critical metric to evaluate is the scale of staked assets (Assets staked, which is equivalent to TVL for liquid staking projects). Since there is a third party—node operators—involved in their operating model, the protocol revenue must be shared with node operators, so gross profit may be more suitable for evaluating liquid staking protocols compared to protocol revenue. Additionally, it is also necessary to assess the expenditure metrics of the protocol—token incentives.
2.1 Lido: Treading Carefully on Ethereum
- Business Status
Lido's business launched at the end of 2020 with the opening of ETH staking, and Lido took six months to secure a leading position in Ethereum's liquid staking. Lido was previously the largest liquid staking service provider on the Luna network and the second largest on the Solana network, expanding its business to almost all mainstream PoS networks. However, starting in 2023, Lido began to strategically retract, and currently, ETH liquid staking is Lido's only business. Its business model is relatively simple: Lido stakes users' ETH through different node operators into Ethereum's staking, charging 10% of the staking yield as protocol revenue.
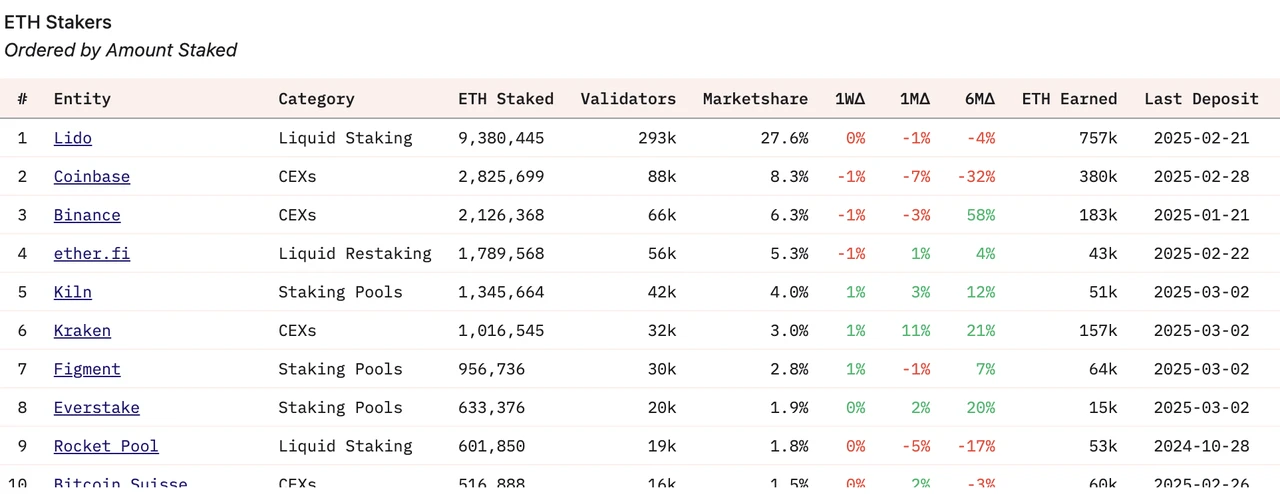
- Assets Staked
Currently, over 9.4 million ETH have been deposited into Lido, accounting for about 8% of circulating ETH, which gives Lido a staked asset scale (TVL) of over $20 billion, making it the protocol with the largest TVL among all protocols. At its peak, Lido's TVL approached $40 billion.
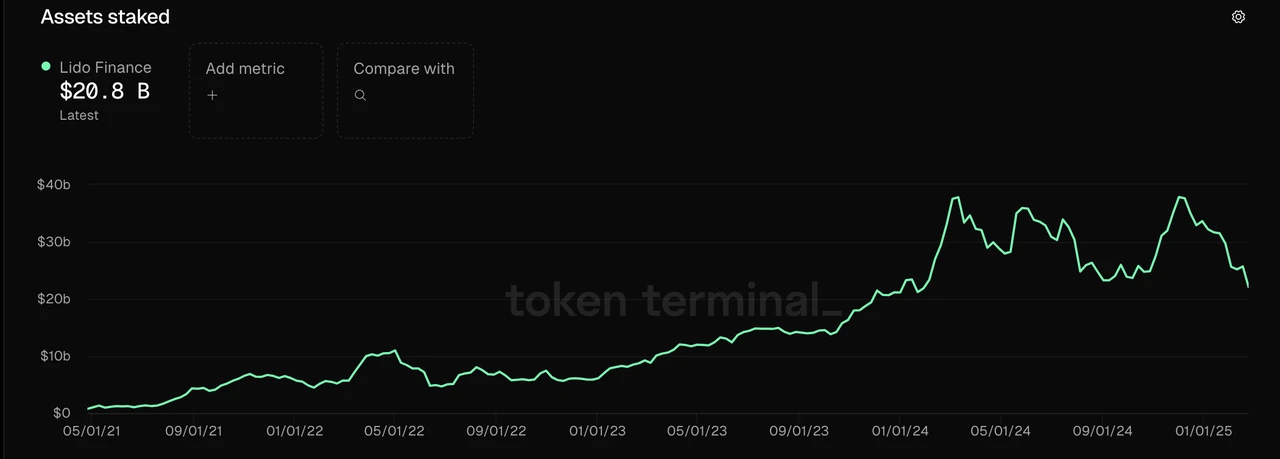
Data Source: Tokenterminal
The fluctuations in the scale of staked assets calculated in ETH are much smaller. Since the beginning of 2024, the scale of ETH staked by Lido has not changed significantly, and the fluctuations in Lido's staked asset scale are more influenced by ETH price fluctuations.
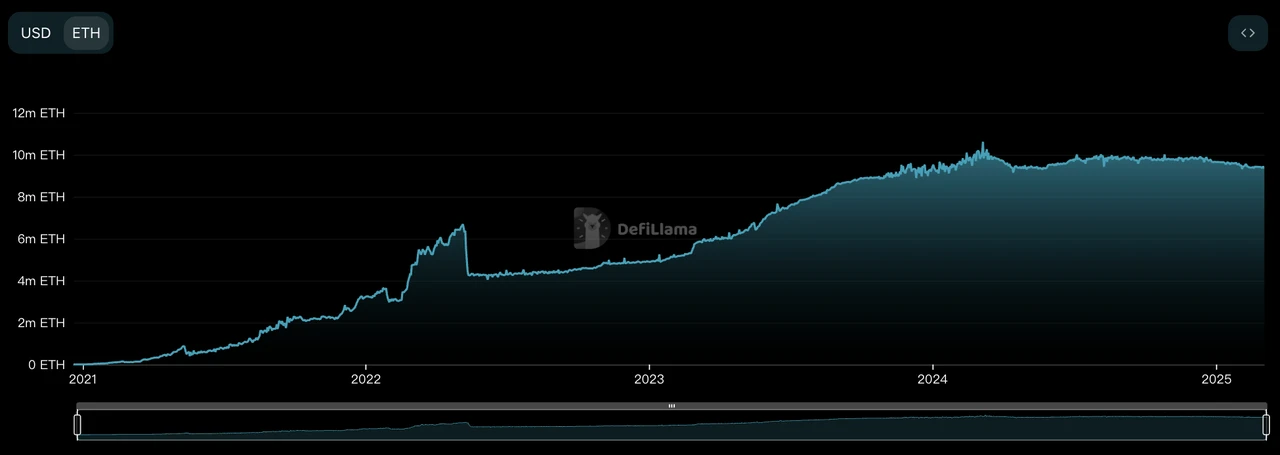
Lido's staked asset scale calculated in ETH, Source: DeFillama
Lido's staked asset scale continues to grow, primarily benefiting from the gradual increase in the Ethereum network's staking rate (from 0% to 27%). As a leading liquid staking service provider, Lido has enjoyed the dividends of the overall market scale growth.
- Gross Profit
Lido extracts 10% of the staking yield as protocol revenue, with the current distribution of protocol revenue being 50% allocated to node operators and 50% to the DAO, resulting in a 5% gross profit. From the chart below, we can see that Lido's protocol gross profit has steadily increased, with weekly gross profit fluctuating between $750,000 and $1.5 million over the past year.
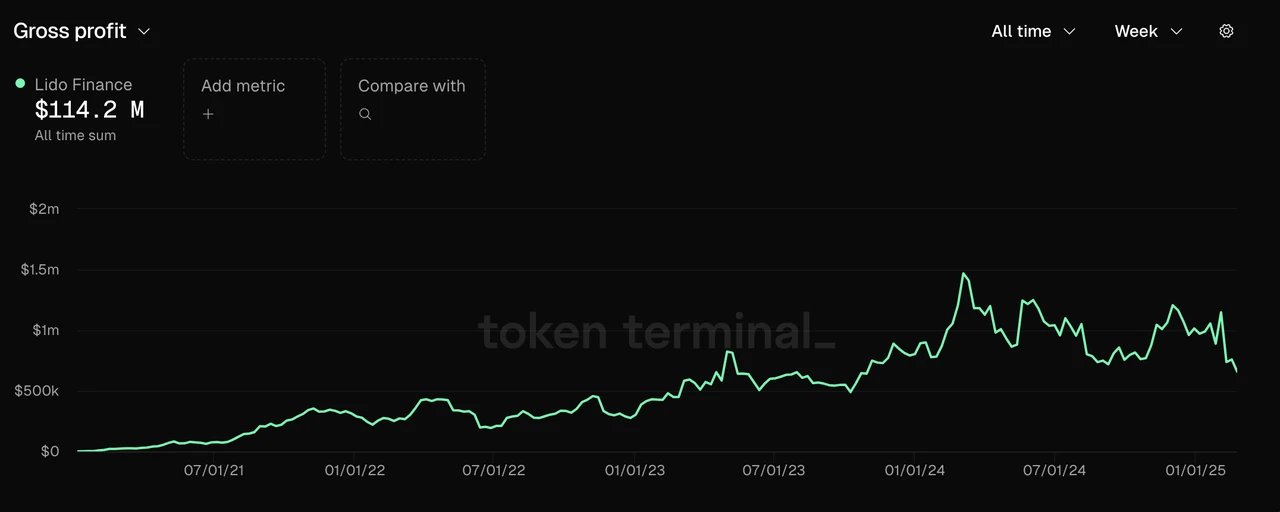
Data Source: Tokenterminal
It is evident that Lido's protocol revenue is strongly correlated with the scale of staked assets, which is determined by their fee structure. The fluctuations in Lido's weekly protocol revenue are also primarily driven by ETH price movements.
- Token Incentives
In the first two years after the protocol launched (2021-2022), Lido spent a massive amount of LDO tokens on incentives to boost the liquidity of its stETH and ETH. Over these two years, it spent more than $200 million on token incentives, which allowed Lido to maintain ETH liquidity during severe market liquidity crises, such as the ban on BTC mining in China in May 2021, the LUNA collapse in May 2022, and the FTX collapse in November 2022, securing its leading position in Ethereum's liquid staking.
After that, Lido significantly reduced its spending on token incentives, with expenditures on token incentives being less than $10 million in the past year. Moreover, the main direction of token incentives is towards ecosystem development. Lido currently does not require token incentives to maintain its market share.
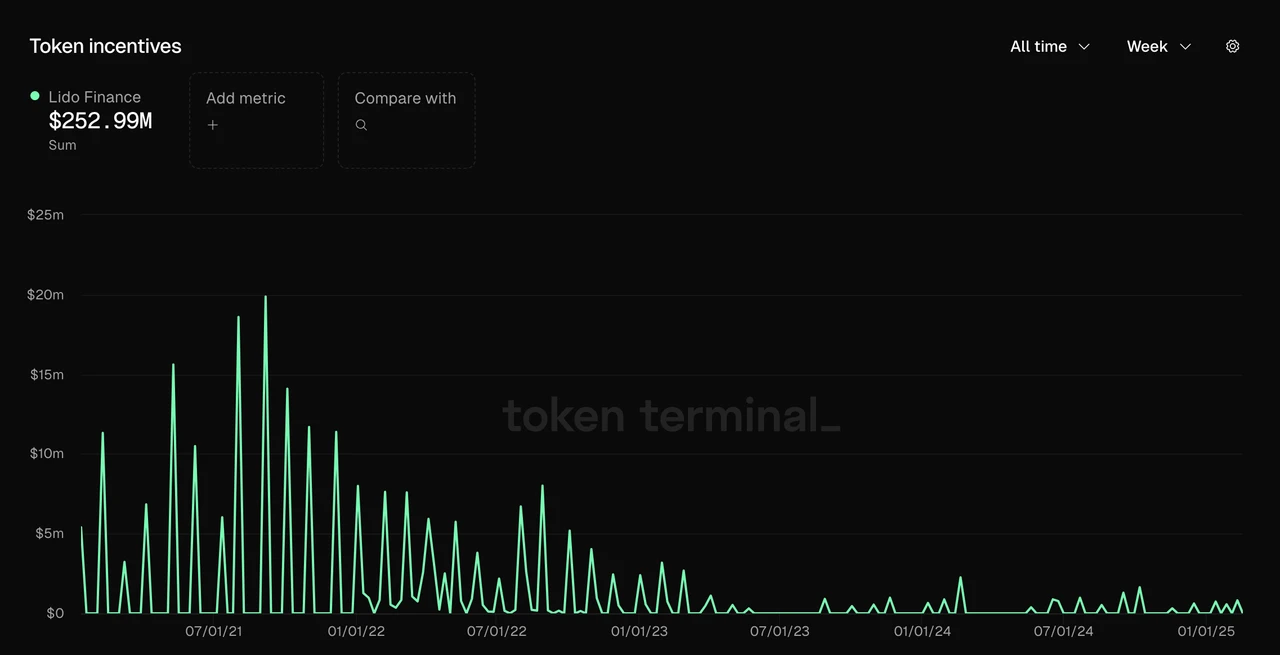
Data Source: Tokenterminal
Competitive Situation
In the liquid staking projects on the Ethereum network, few projects can compete with Lido. Currently, the second-ranked liquid staking project, RocketPool, has a staked asset scale of less than 10% of Lido's.
Among newer projects, the Liquid Restaking project ether.fi poses some competitive pressure on Lido; however, ether.fi's staked asset scale is still only about 20% of Lido's, and with the issuance of Eigenlayer tokens, the growth rate of ether.fi's staked asset scale has rapidly slowed, making it unlikely to challenge Lido's position in Ethereum staking.
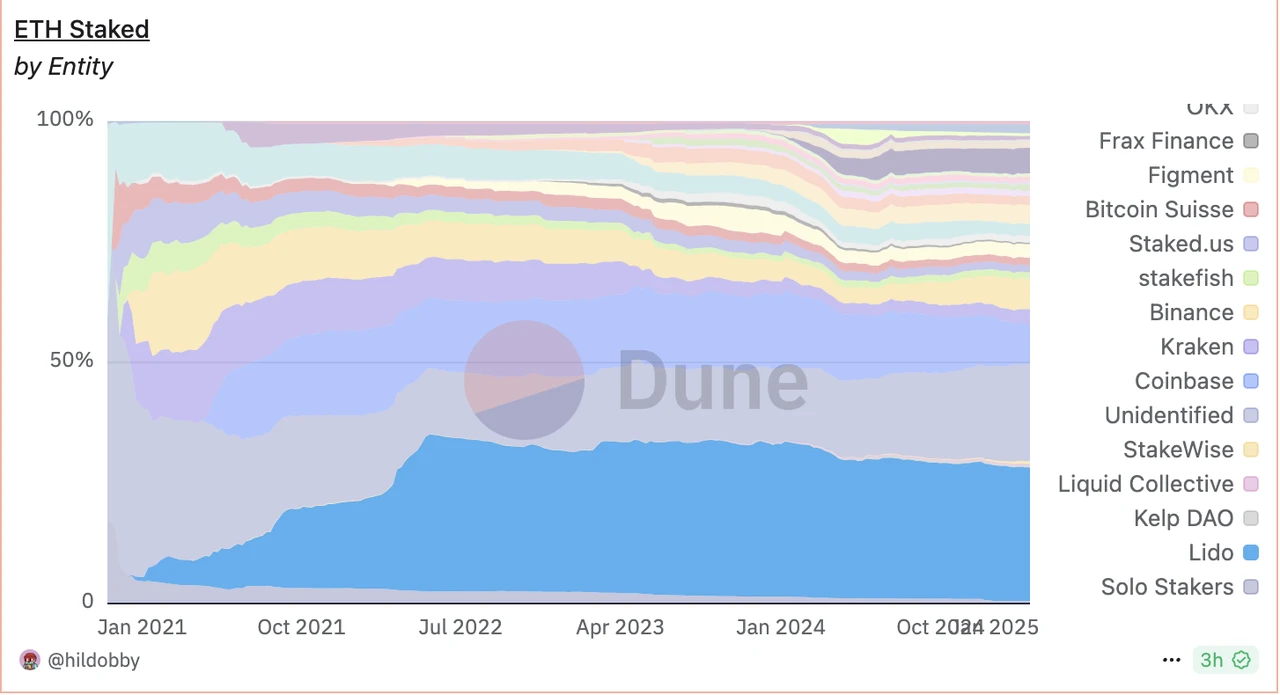
Source: Dune
Over the long-term development process, Lido has established a certain moat:
The network effects brought by the good liquidity and composability of stETH (wstETH). In addition to the liquidity advantages mentioned above, stETH is accepted as a staked asset by all major lending or stablecoin protocols, providing an incomparable composability advantage among LSTs, which will influence the choices of new stakers to some extent.
Accumulation of security credit and brand recognition: Since its launch, Lido has not experienced significant security breaches, and its long-standing market leadership has become an important consideration for whale users and institutions when choosing staking service providers. For example, Sun Yuchen and Mantle, which developed mETH independently, were typical representatives of using Lido's services.
Main Challenges and Risks
The main challenge currently facing Lido comes from the decentralization demands of the Ethereum network.
For PoS chains, stakers determine the formation of consensus, and the Ethereum ecosystem currently has the most persistent pursuit of decentralization among mainstream PoS public chains. Therefore, regarding Lido's scale issues, there are voices calling for restrictions on Lido's scale growth as its staked asset scale reaches 30% of the Ethereum network's staking scale. The Ethereum Foundation is also continuously adjusting its staking mechanisms to prevent the emergence of "overly large single staking entities."
For dApps, the inability of their sole public chain to support or even restrict their business development poses the biggest challenge for Lido in the medium to long term. Although Lido has long recognized this and began to cut off all other chain businesses in 2023, focusing on Ethereum as its important work target, the results so far have not been significant.
On the other hand, although the current ETH staking rate is still below 30% (28%), which is significantly lower than other top market cap PoS chains like Solana (65%), ADA (60%), and SUI (77%), the Ethereum team has historically not wanted too much ETH to enter staking, previously suggesting limiting the staking rate to a maximum of 30%. This also makes Lido's future market growth potential appear relatively limited.
Additionally, ETH itself has performed poorly in this cycle, and as a project that is strongly correlated with ETH prices in both concept and business data, Lido's performance in this cycle has also struggled significantly.
- Valuation Reference
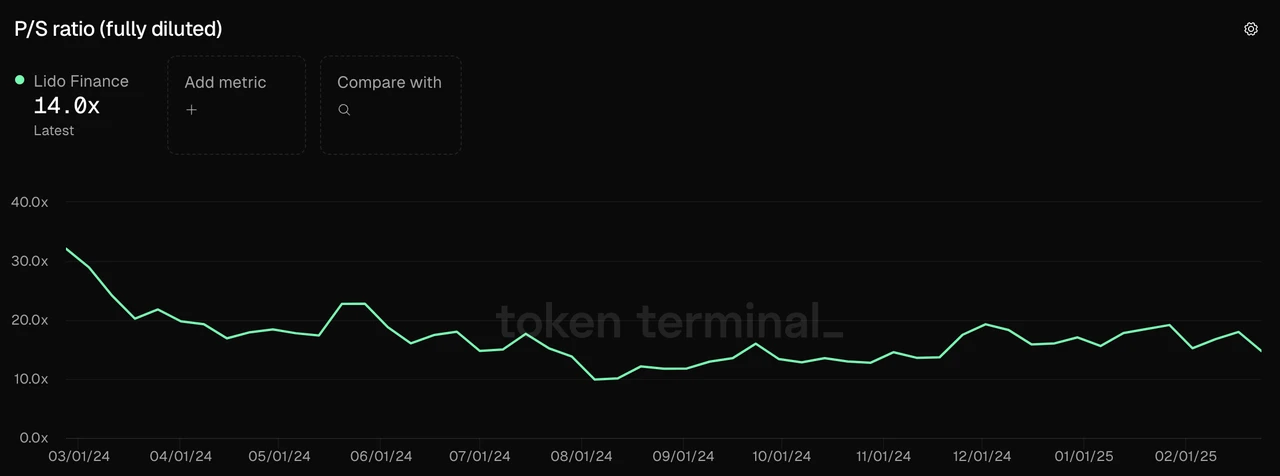
In the past year, LDO's PS has been at a historical low range, especially in the last six months, where its PS has remained below 20.
It is also worth noting that within this year, there is a possibility that protocol revenue could be converted into $LDO income. Starting in 2024, there have been multiple proposals within the community to allocate the protocol revenue (the 5% portion distributed to the DAO) to $LDO holders. However, the core team has clearly opposed this from a cautious perspective, and multiple governance process votes have not passed. Nevertheless, with the significant easing of the regulatory environment and the protocol beginning to generate accounting profits (protocol revenue minus all expenses, including team salaries, still has a surplus) starting in 2024, the core team has officially discussed "linking protocol revenue directly to LDO" in its 2025 goals. We can expect to see $LDO start to receive protocol staking revenue in 2025.
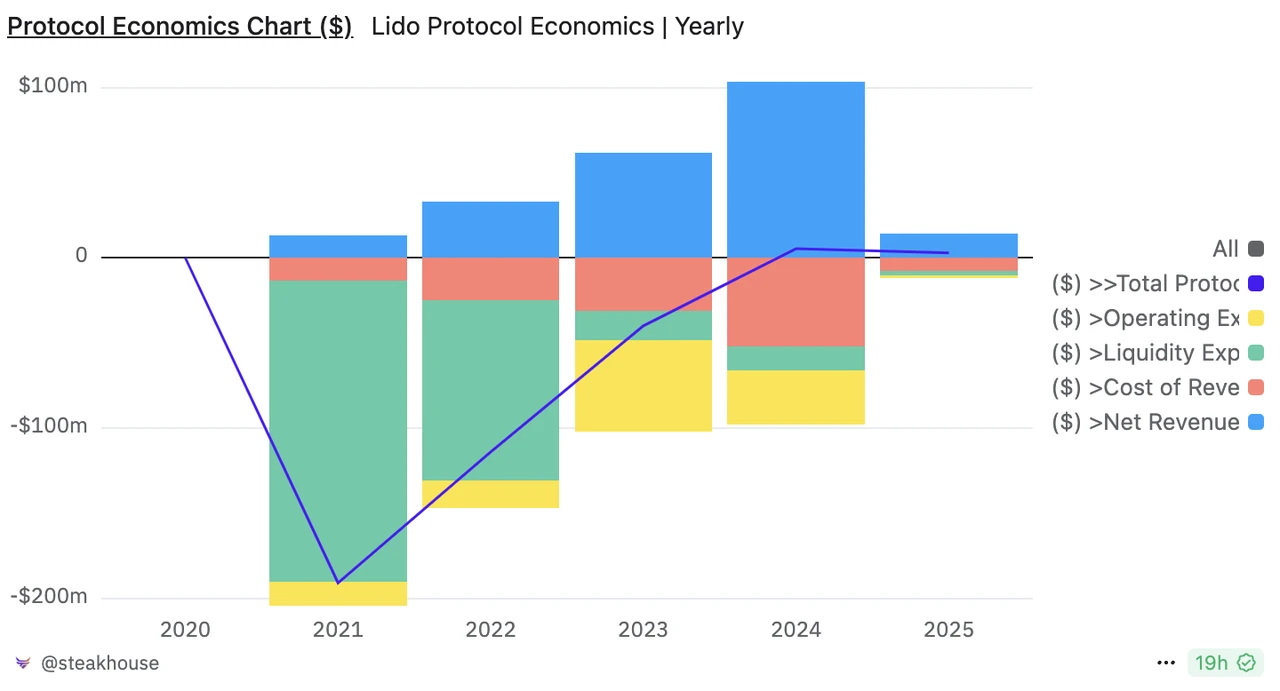
Lido protocol economics (the blue-purple line in the chart represents the protocol's "net profit"), Source: Dune
2.2 Jito: Quietly Profiting in Solana
- Business Status
Jito is the leading liquid staking service provider on the Solana network and also serves as the MEV infrastructure for the Solana network. Additionally, they began offering restaking services in 2024. However, the current scale of Restaking is still relatively small, with TVL just exceeding $100 million, and the revenue sources for the Restaking portion are not yet clear. Jito's main businesses remain the first two: liquid staking services and MEV service provision.
The liquid staking service provided by Jito on Solana is similar to Lido's on the Ethereum network, allowing users' deposited SOL to participate in Solana's staking through node operators, extracting 10% from user yields as protocol revenue.
In terms of MEV, the Jito labs team previously extracted 5% of all income, but after the recent launch of NCN (Node Consensus Networks) and the formal implementation of proposals like JIP-8 at the end of January this year, the Jito protocol began to receive 3% of MEV income, specifically distributed as follows: Jito DAO receives 2.7%, the staked JTO Vault receives 0.15%, and jitoSOL and other LST stakers receive 0.15%.
When users conduct transactions on Solana, the gas fees they pay can be divided into three categories: base fees, priority fees, and MEV tips. The base fee must be paid, while priority fees and MEV tips are optional payments, primarily used to increase the priority of transactions. The difference is that the purpose of the priority fee is to enhance the priority of transactions during the on-chain phase, which is a unified setting of the Solana protocol layer and belongs to the validators (i.e., stakers); whereas the MEV tip is a separate agreement between users and MEV service providers, aimed at obtaining a higher transaction priority from MEV service providers to ensure their transactions are prioritized for construction (and then can be on-chain), with specific distribution determined by the MEV service provider.
Currently, Jito's MEV services return 94% of the fees collected to validators, with 3% going to Jito labs and 3% allocated to the Jito protocol. In the previous Solana network gas fee structure, the base fee accounted for a negligible proportion, while the scales of priority fees and MEV tips were comparable.
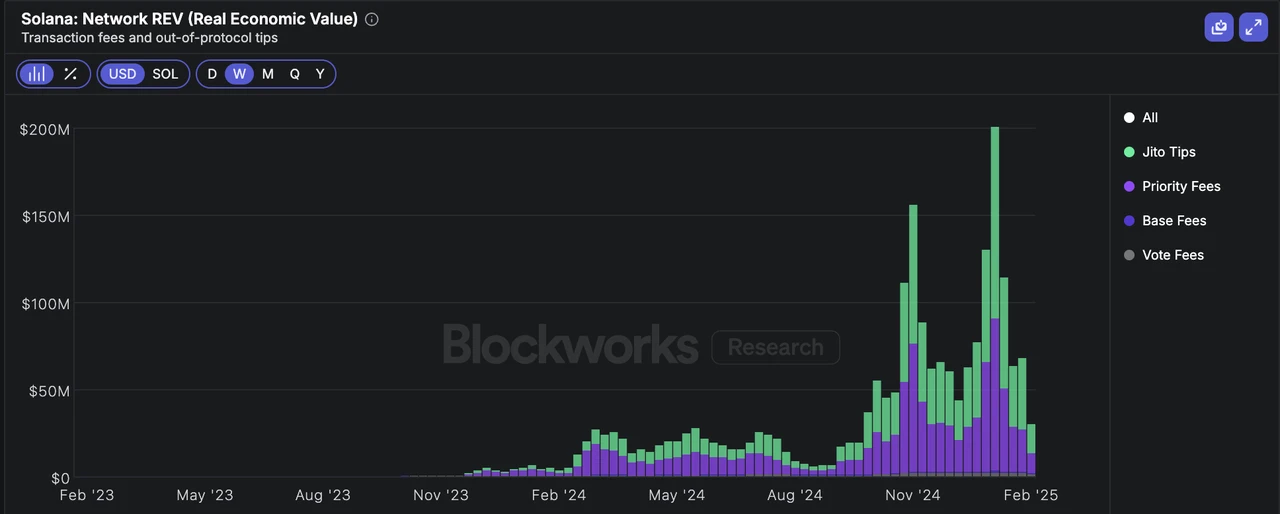
The REV (i.e., all fees paid by users) on the Solana network Source: Blockworks
Compared to Lido on Ethereum, Jito has near-monopolistic power in the MEV space within the Solana ecosystem, allowing it to capture more value from MEV revenue (the position of Jito MEV in the Solana ecosystem is similar to that of Flashbots in the Ethereum ecosystem).
Next, let's look at the specific data for Jito:
- Assets Staked
Currently, Jito's staked asset scale (liquid staking) exceeds $2.5 billion.
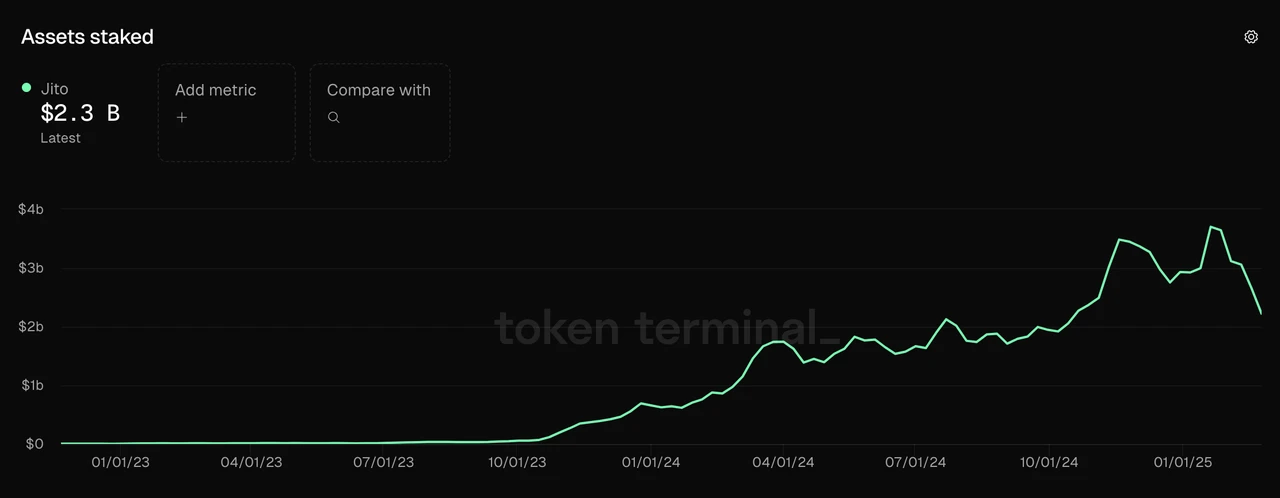
Data Source: Tokenterminal
In terms of SOL, Jito has staked 15.82 million SOL, accounting for about 3% of the total circulating supply of SOL. Over the past year, the staked SOL has shown a steady linear increase.
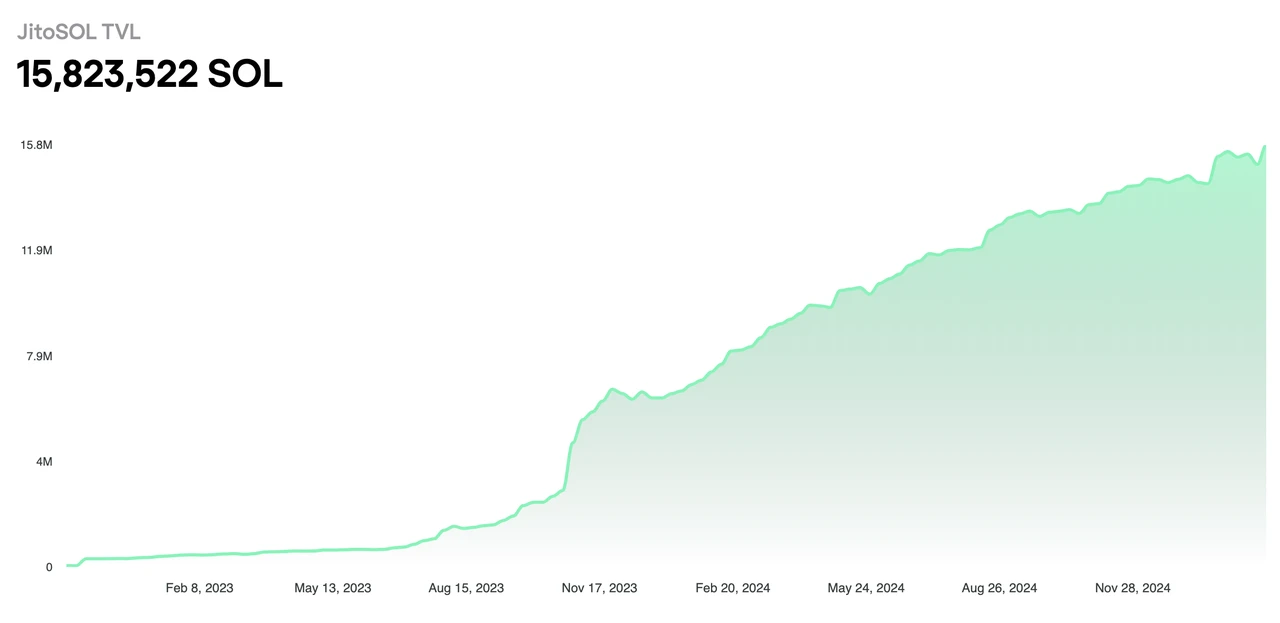
Source: Jito Official Website
In the MEV field, Jito is nearly monopolistic in Solana; currently, over 94% of the 394 million SOL staked are using Jito's MEV services.
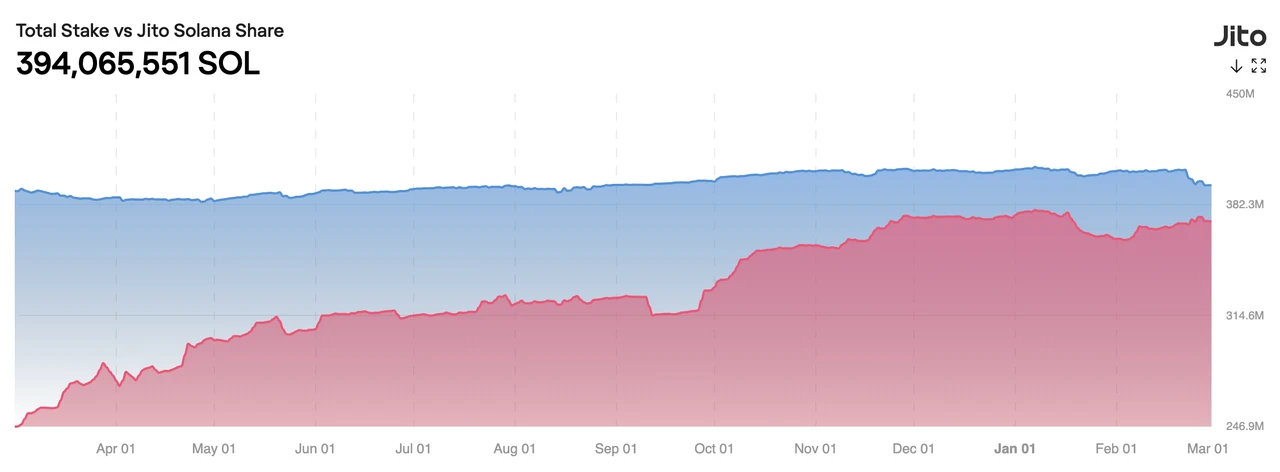
Source: Jito Official Website
- Gross Profit
Jito's current protocol revenue consists of two parts: they charge 10% of the earnings from liquid staking and 3% from MEV revenue. Currently, Jito distributes 4% of the liquid staking earnings to node operators, so the gross profit from the liquid staking portion is 60% of the revenue. Since I have not found a separate source for Jito's gross profit data, we will analyze based on Jito's revenue situation, as shown in the chart below:
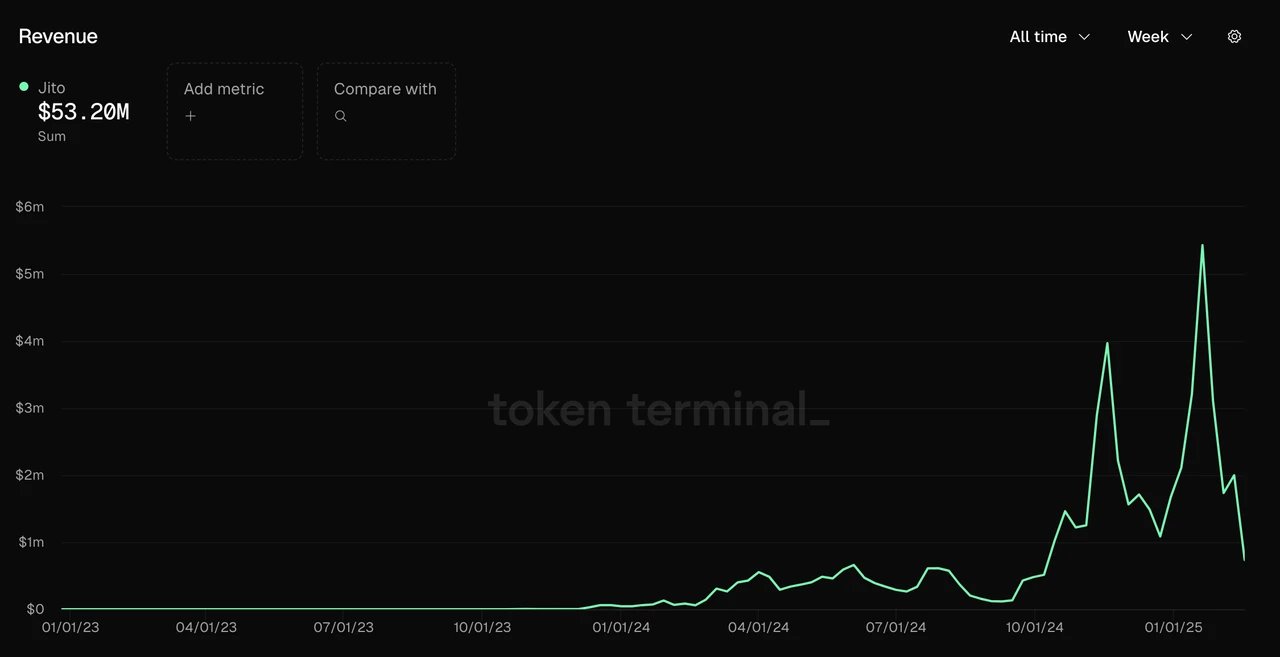
Data Source: Tokenterminal
It can be seen that Jito's revenue is entirely correlated with the popularity of the Solana network. Starting from October 2024, its revenue has seen a significant increase, exceeding $1 million weekly, with two notable peaks: $4 million on November 20 and $5.4 million on January 20, corresponding to two major speculative booms on the chain. However, following a recent cooling of the Solana chain, its revenue has also rapidly declined.
Regarding the MEV portion, it may be because the MEV revenue sharing has just been launched; I have not found statistics on this part in mainstream data aggregation sites and Dune. However, we can estimate based on Jito's total MEV revenue. The chart below shows Jito's total MEV revenue situation:
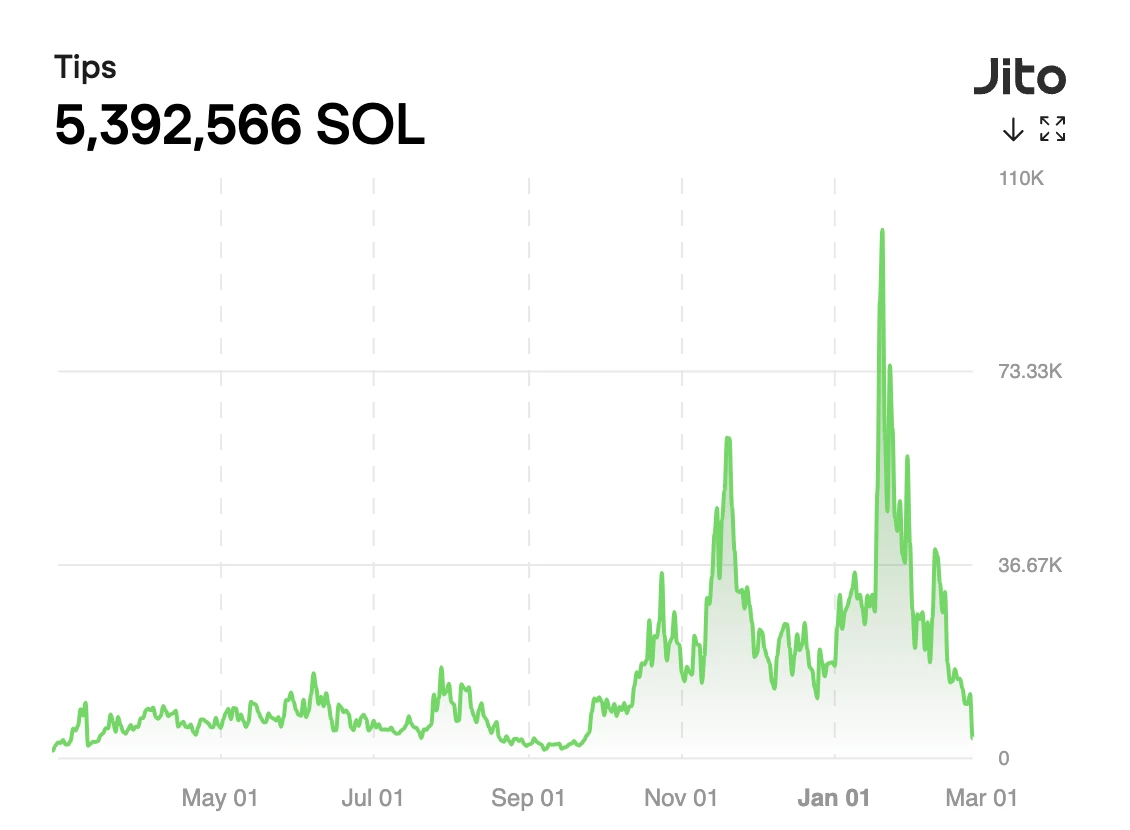
Jito's total MEV revenue Source: Jito Official Website
Jito's total MEV revenue trend is consistent with the revenue trend from its liquid staking portion. At the peak on January 20 this year, the total MEV revenue was 100,000 SOL. After October 2024, the average daily MEV revenue was around 30,000 SOL, with a minimum of 10,000 SOL.
Using a 3% protocol revenue rate to backtrack the income during this period, the highest single-day income was 3,000 SOL, which was approximately $840,000 at that time. The highest weekly income was 14,400 SOL, about $3.7 million, with an average daily MEV income of 1,000 SOL (approximately $170,000). A detailed forecast of this income was previously made in the JIP-8 proposal, which interested readers can refer to.
Overall, in addition to the current liquid staking income, the income from MEV could potentially increase Jito's revenue scale by about 50%.
In terms of gross profit scale, the gross profit from the liquid staking portion averages around $600,000 weekly, while the gross profit from MEV revenue is as high as 95% (only the 0.15% allocated to jitoSOL does not count as gross profit; the portions going to the DAO and JTO Vault can be considered gross profit), resulting in a gross profit of about $1 million weekly, which could increase Jito's gross profit scale by approximately 150%, leading to an annualized gross profit scale of around $85 million.
It should be noted that Jito's revenue and gross profit situation are strongly correlated with the popularity of the Solana network. Recently, after the meme trading frenzy on the Solana network subsided, its daily revenue dropped to about 10% of the peak, with significant data fluctuations.
- Token Incentives
Whether in liquid staking or MEV, Jito has not provided token incentives for its business. The only token incentive was a one-time airdrop of 10% at the time of launch.
- Competitive Situation
Restaking has not yet produced a true PMF, so we will mainly analyze Jito's competitive situation in liquid staking and MEV.
In the Solana liquid staking market, Jito officially launched its business in 2023 but has quickly risen to a leading position. The previous leaders, Marinade and Lido, once occupied over 90% of the entire Solana liquid staking market but were surpassed by Jito due to their own reasons.
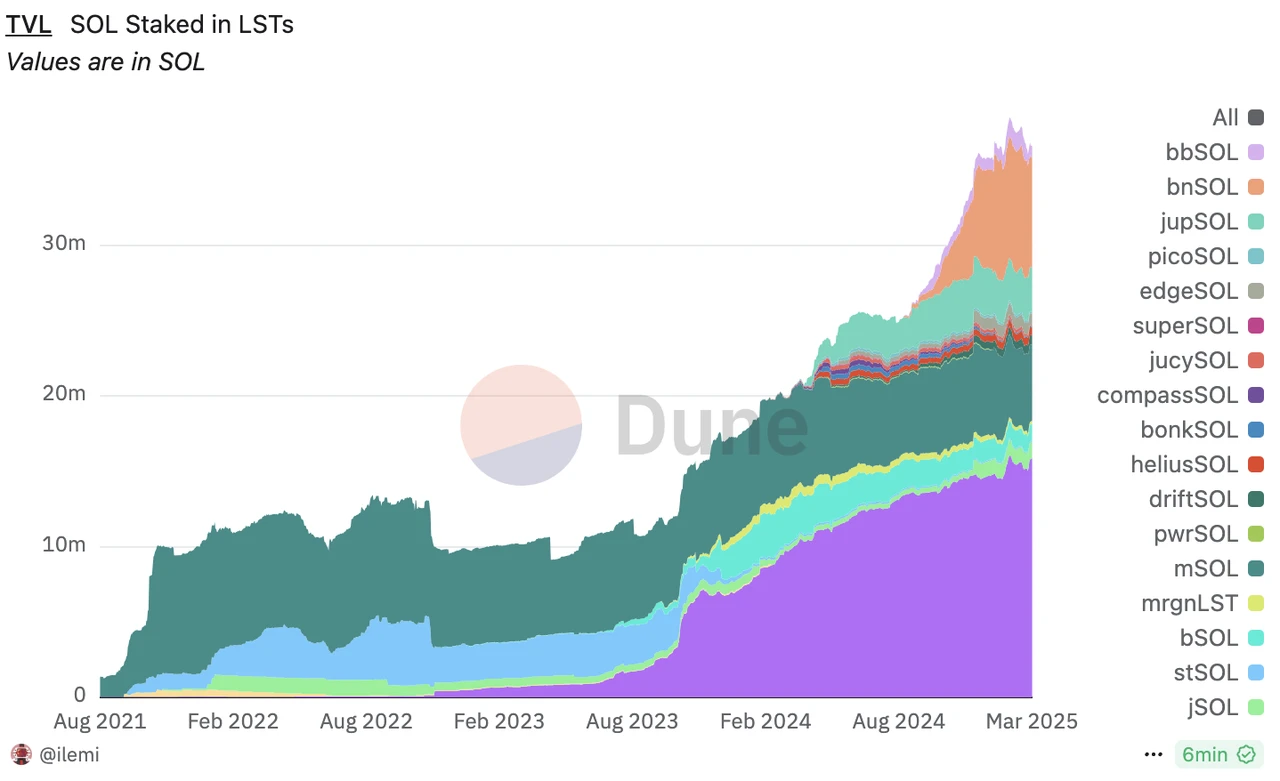
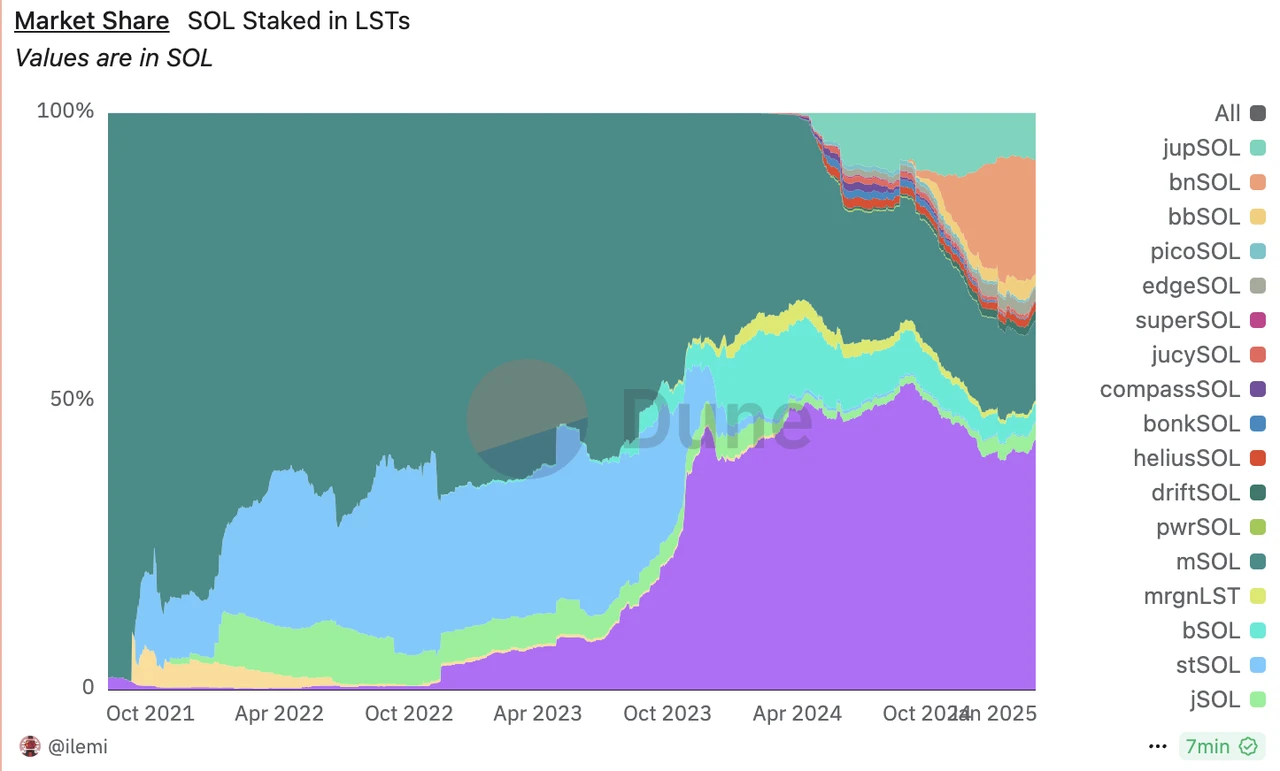
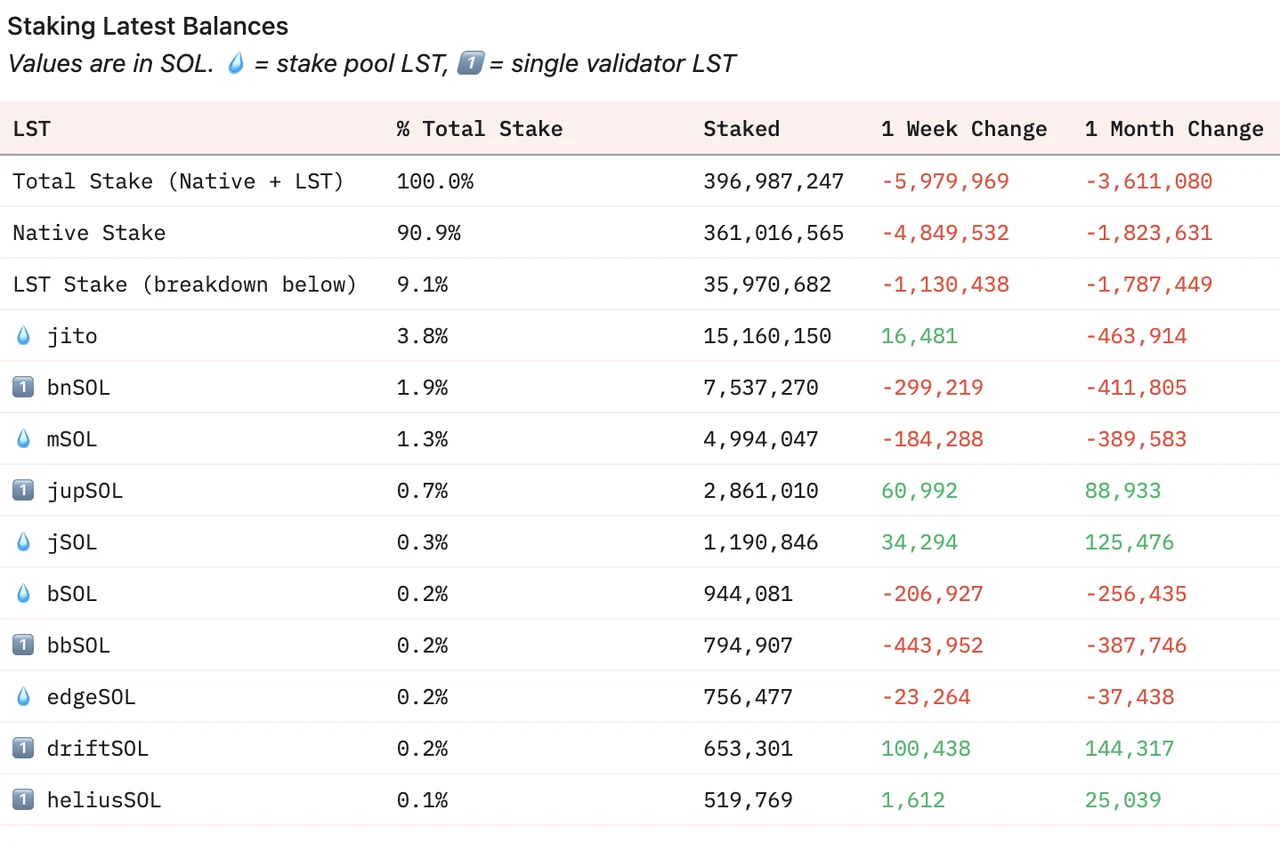
Solana Liquid Staking Market Share Source: Dune
Starting at the end of 2023, the Solana liquid staking market welcomed more players, with more and more participants like Blazestake and Jupiter joining the fray, but Jito's market share remained unaffected. However, starting in October 2024, the SOL liquid staking products from exchanges (mainly Binance's bnSOL and Bybit's bbSOL) caused a slight decline in Jito's market share. This is mainly due to centralized exchanges having a natural advantage in custodial assets, as they transformed SOL financial products from native staking to liquid staking, providing users with a better experience, leading to a rapid increase in their share. As we can see from the first chart above, the incremental portion from bnSOL and bbSOL is relatively "independent" and does not encroach on the shares of certain LST protocols.
Currently, over 90% of Solana's staking is still native staking, with less than 10% liquid staking rate, which still has significant room for improvement compared to Ethereum's approximately 38%. Of course, for ordinary users, participating in Solana's native staking is much easier than participating in Ethereum's native staking. The proportion of Solana liquid staking may not ultimately reach that of Ethereum, but liquid staking still provides relatively better liquidity and composability. In the future, Jito will continue to benefit from the overall increase in the scale of Solana liquid staking.
Solana Staking Market Share Source: Dune
In the MEV field, Jito, which occupies over 90% of the market share, has almost no competitors. This market space mainly depends on the future activity on the Solana chain.
Overall, Jito has a solid leading advantage in both liquid staking and MEV on the Solana network. Previously, when the SEC's ETP working group consulted on ETF staking issues, they invited Jito, which indirectly reflects this point.
- Main Challenges and Risks
Jito's current business and revenue are highly dependent on the popularity of the Solana network, so the main risks Jito faces also stem from this. After TRUMP and LIBRA, the market's enthusiasm for memes quickly cooled, and the price of SOL also rapidly declined, leading to a swift reduction in Jito's business revenue. Whether Jito can regain its upward momentum in the future largely depends on the popularity of the Solana network.
In the liquid staking field, competition from centralized exchanges may impact Jito's market share.
From an investment perspective, another potential risk is that the circulation ratio of the JTO token is less than 40%. In December of last year, a significant 15% was unlocked, and there will be a continuous linear unlocking over the next two years, with an inflation rate reaching 62% in the coming year. The selling pressure from early investors is also a potential risk factor.
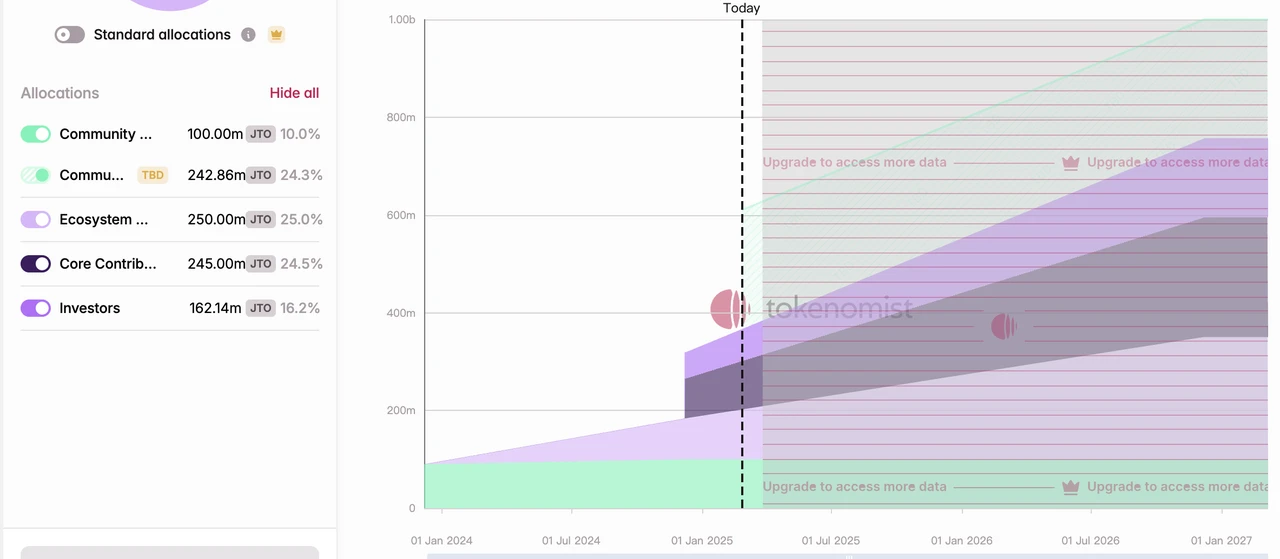
Source: tokennomis
- Valuation Reference
With the recent boost from Solana's popularity, the fully diluted PS valuation of JTO has rapidly decreased, currently falling to around 33. This valuation does not yet account for the recently started MEV revenue; if MEV revenue is considered, the fully diluted valuation of JTO would drop to around 22.
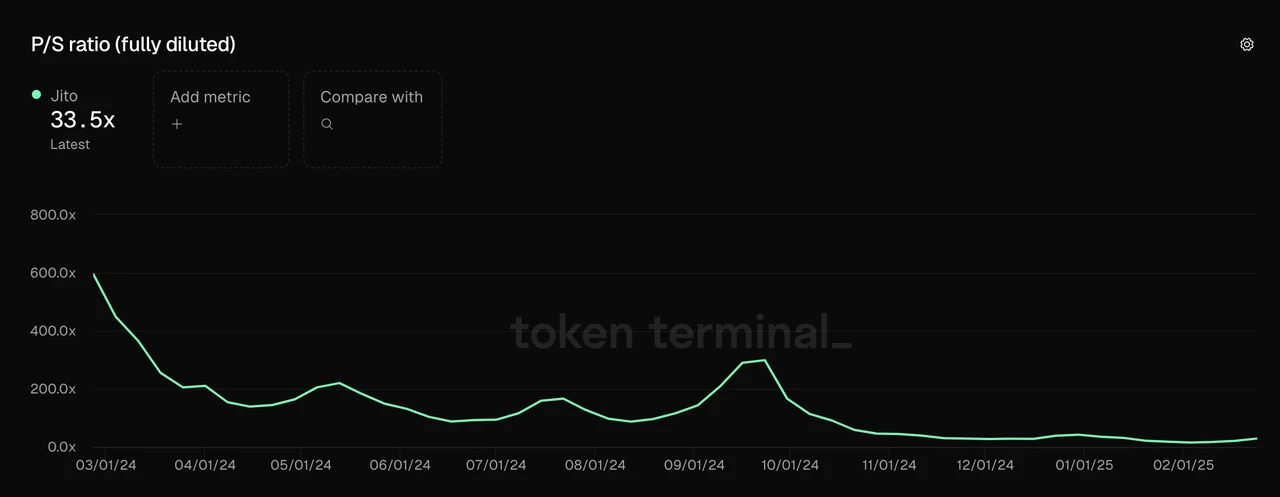
Data Source: Tokenterminal
Additionally, JTO may also accelerate income distribution. From the MEV revenue collected by the protocol, 0.15% of the share has already been allocated to JTO stakers, and as income continues to grow, more revenue may be distributed to JTO stakers in the future.
免责声明:本文章仅代表作者个人观点,不代表本平台的立场和观点。本文章仅供信息分享,不构成对任何人的任何投资建议。用户与作者之间的任何争议,与本平台无关。如网页中刊载的文章或图片涉及侵权,请提供相关的权利证明和身份证明发送邮件到support@aicoin.com,本平台相关工作人员将会进行核查。


