
Bitcoin's monthly line has formed an engulfing pattern. After three months of oscillation at a high of 90,000 to 100,000, a breakdown occurred at the end of February, and subsequent rebounds that cannot break through 89,000 to 91,000 still indicate a need for a pullback. The weekly line will close tomorrow at 8 AM, and the rebound has only recovered less than 40% of the body, indicating that the rebound remains weak.
As for Ethereum, the monthly and weekly lines show an even weaker rebound, breaking through previous lows and recovering less than one-third of the weekly line, with about 100 points of space from the low of the spike.
The three major U.S. stock indices have fallen but have not broken the upward trend line, which still leaves some hope. It will depend on whether the rebound can effectively recover the corresponding pressure. If the highs cannot be broken through for a long time, risks still need to be noted. An economic recession in 2025 is inevitable, and the AI bubble needs to be digested for the market to be more favorable. The author still hopes for a deep black swan event without breaking through, which would be better for long-term investments.
Bitcoin
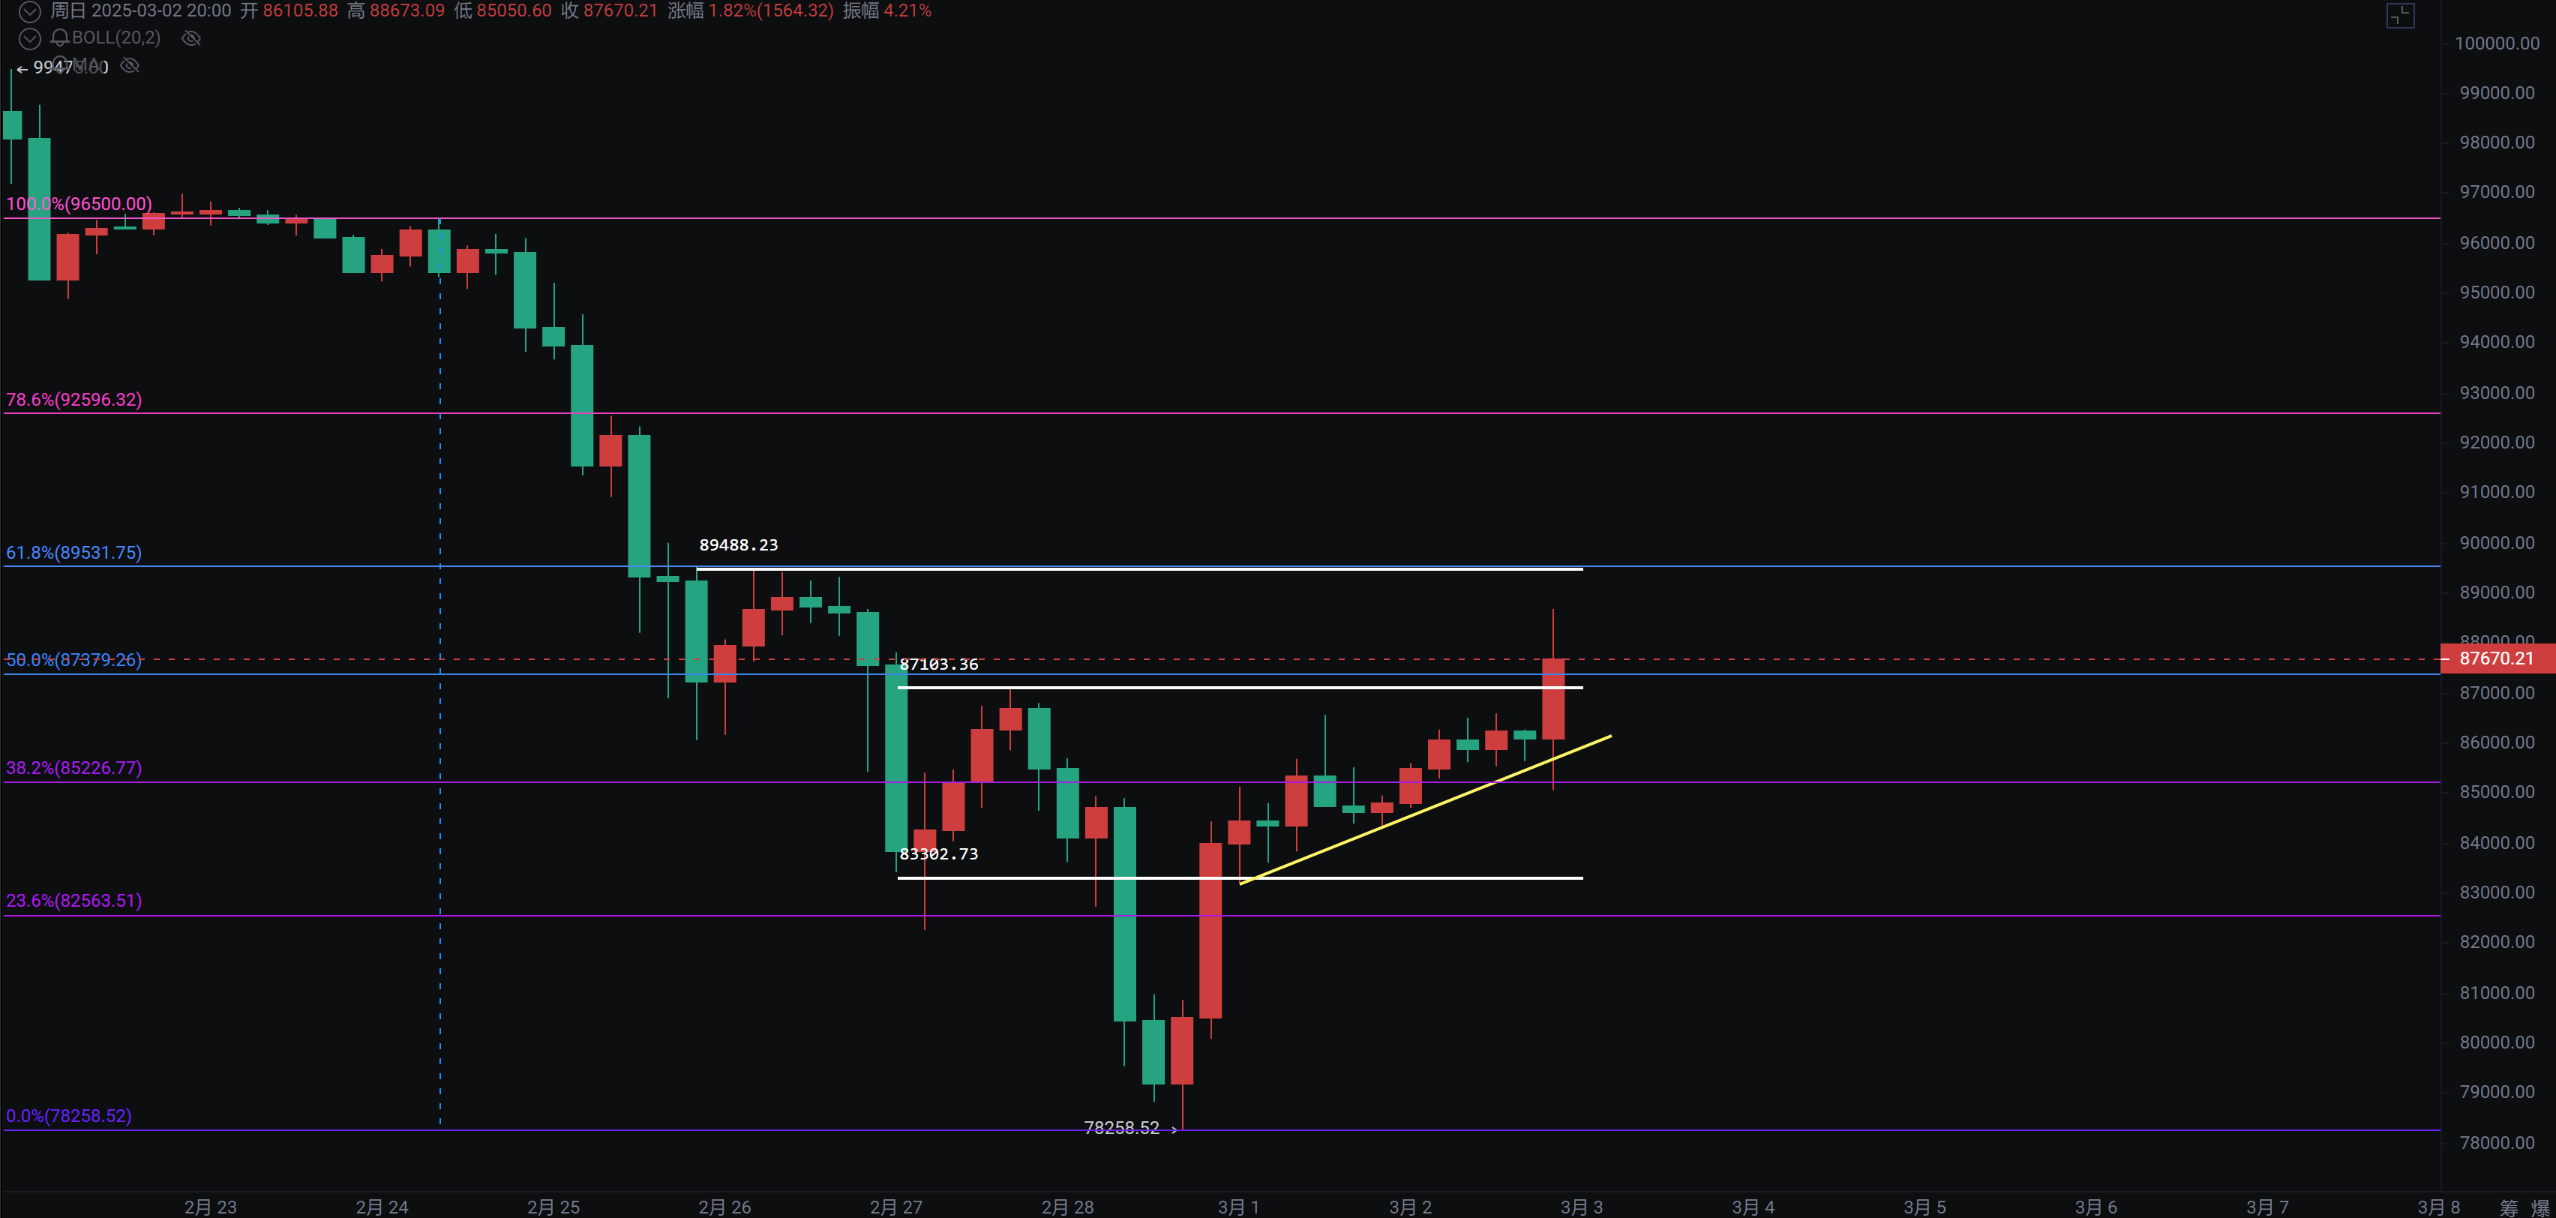
The daily line has tested the MA200 long-term moving average support three times, with a spike at 78,258 that has been recovered. Whether it can continue to hold here is uncertain, as the current rebound situation still appears weak and has not broken through 0.382.
The 4-hour bottom divergence has not broken through 87,000, and the 4-hour view indicates a pullback.
A pullback to test the 82,000 to 83,000 support needs to hold. Influenced by the news that "Trump will promote a crypto strategic reserve including XRP, SOL, and ADA," Bitcoin spiked upwards by 4%.
Support: Pressure:
Ethereum
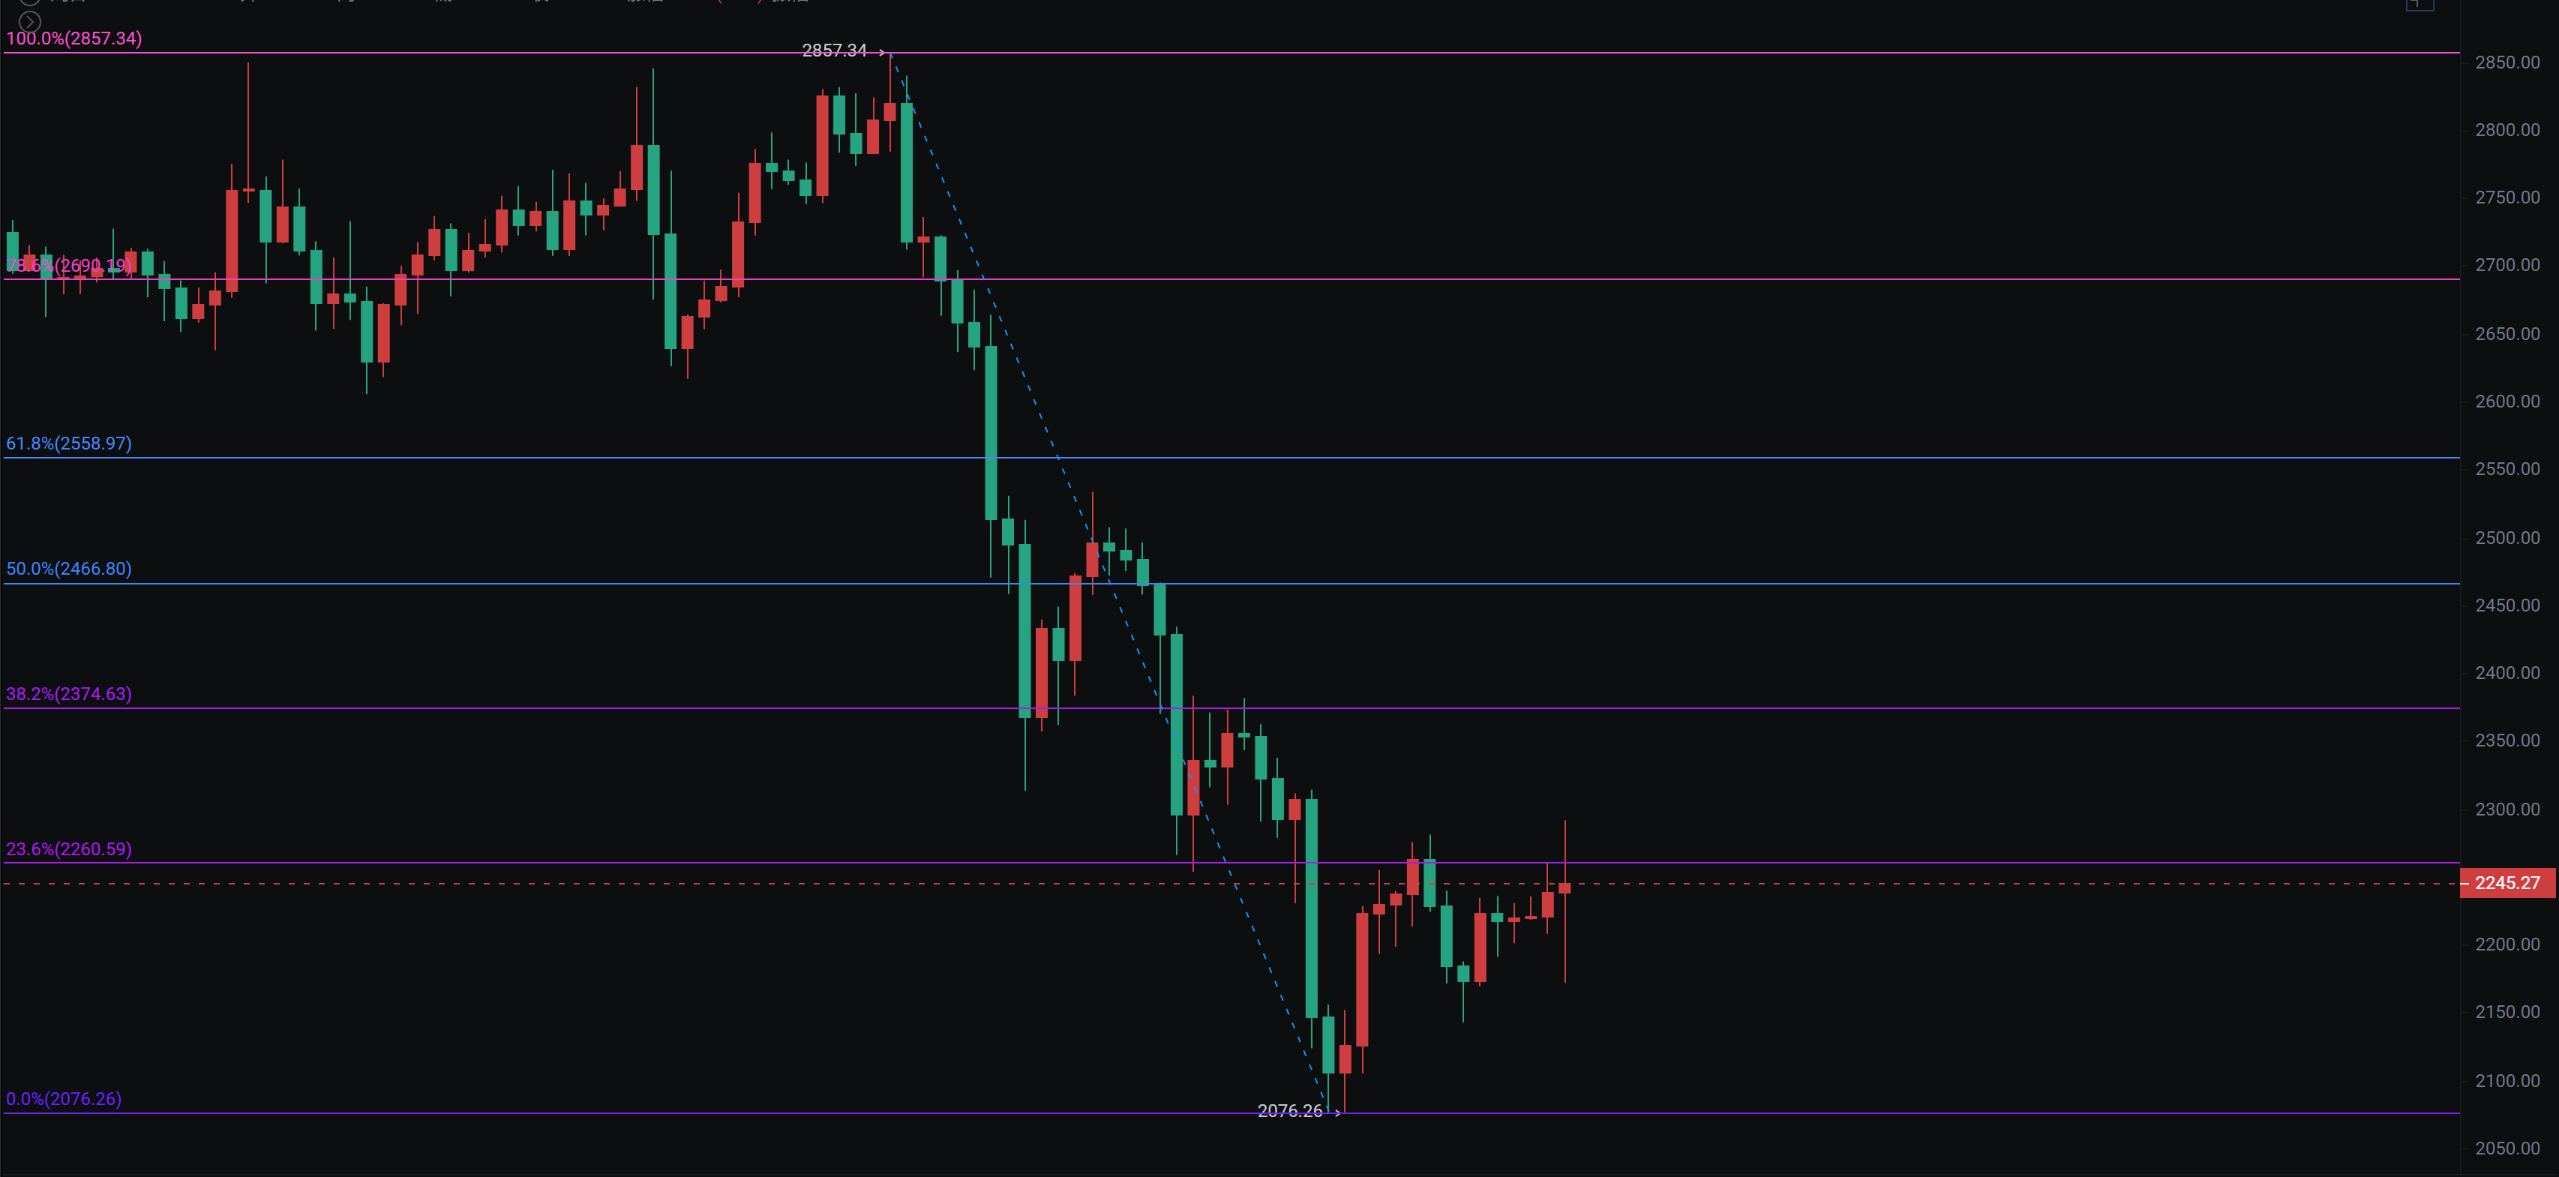
The daily line has no strong signals apart from breaking through previous lows and recovering. The 4-hour line has again pulled back, with short-term attention on the 2,142 and 2,076 support levels. Since this wave of decline, the rebound has not broken through 0.236, indicating that the rebound remains weak. As previously mentioned, any rebound that does not effectively address pressure is an invalid rebound.
Support: Pressure:
If you like my views, please like, comment, and share. Let's navigate through the bull and bear markets together!!!
This article is time-sensitive and for reference only, with real-time updates.
Focusing on K-line technical research, sharing global investment opportunities. Public account: Trading Prince Fusu

免责声明:本文章仅代表作者个人观点,不代表本平台的立场和观点。本文章仅供信息分享,不构成对任何人的任何投资建议。用户与作者之间的任何争议,与本平台无关。如网页中刊载的文章或图片涉及侵权,请提供相关的权利证明和身份证明发送邮件到support@aicoin.com,本平台相关工作人员将会进行核查。


