Meteora is a DeFi project on the Solana chain, focusing on creating an efficient, sustainable, and flexible liquidity layer for the Solana ecosystem. Its goal is to address the issue of insufficient liquidity on Solana, making transactions smoother and cheaper, while providing better returns for users who provide liquidity.
Meteora's pools mainly consist of DLMM pools and Dynamic Pools, where users can add both bilateral and unilateral pools in the DLMM pool. For example, the developer can use a unilateral pool for selling and accumulating, such as the trump/sol trading pair. When the price rises, the developer can add a unilateral pool of $trump at a higher price range. When the price reaches this range, it will automatically convert $trump to $sol for selling, while also earning transaction fees. Conversely, when the price drops, the developer can add a unilateral pool of $sol at a lower price range. When the price falls to this range, it will automatically buy $trump to accumulate.
If we want to know at what price the developer uses the unilateral pool for selling and accumulating, it is essential to know the corresponding price ranges.
1. Basic Concepts
Website: https://app.meteora.ag/
1. Trading Pair
Any two coins can form a trading pair, for example, $trump and $sol form the trump-sol trading pair, while $trump and $usdc form the trump-usdc trading pair.
2. Pool (LP Pool)
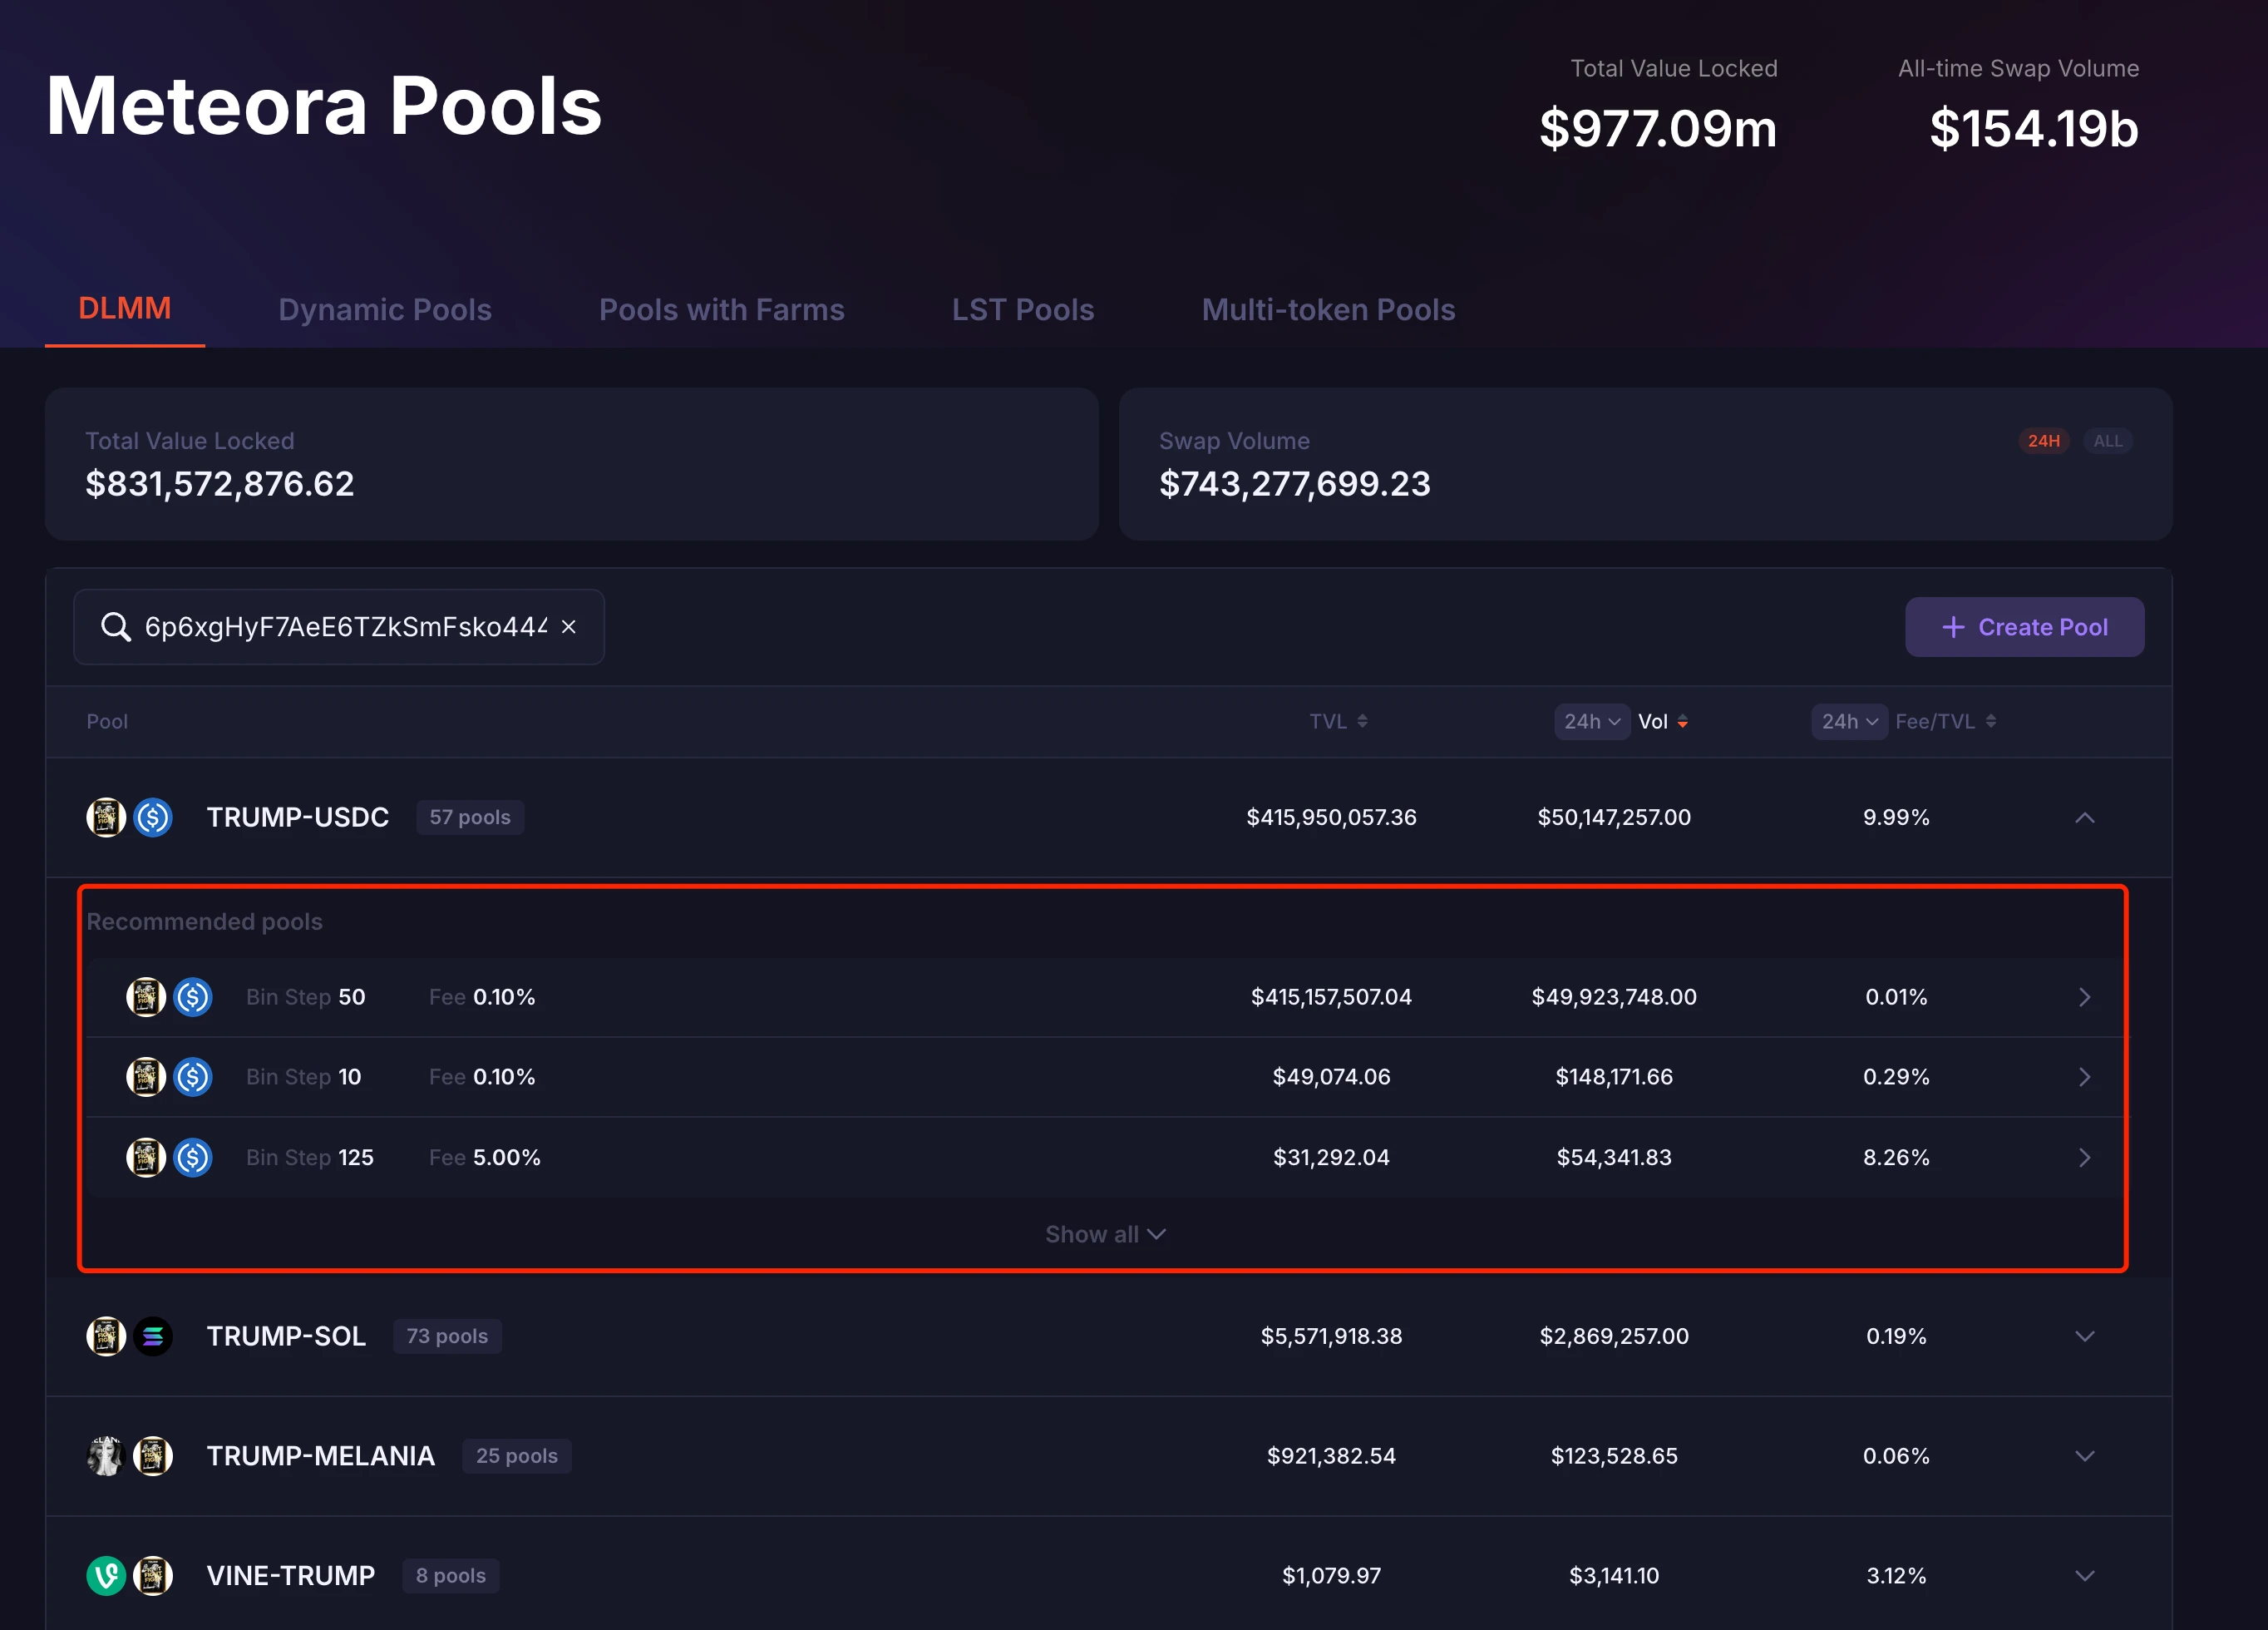
Each trading pair can have multiple Pools, differentiated by Bin Step and Fee. For instance, the trump-usdc trading pair has 57 Pools, each corresponding to a unique address, as shown in the image.
3. Bin
In DLMM, each bin represents a price, with each bin being a buy or sell order at a specific price.
4. Bin Step
Bin step refers to the price interval size between two adjacent bins, calculated in basis points (1 basis point = 0.01%). It determines the density of bins and the granularity of liquidity distribution, set by the pool creator.
For example:
Suppose the current price of SOL/USDC is $20, and the bin step is set to 25 basis points (0.25%).
The next bin price would be 20 × 1.0025 = $20.05, and the following one would be 20.05 × 1.0025 ≈ $20.10, and so on.
5. Position
A position describes how liquidity providers allocate funds to specific price ranges, with each position corresponding to a unique address. A position is created within a specific pool, and a pool can have multiple different positions.
A position typically includes the following key elements:
(1) Price Range
Each position has a defined price range, indicating the price range the liquidity provider wishes to support, composed of a series of consecutive bins.
(2) Amount of Funds
The quantity of the two tokens (e.g., SOL and USDC) invested. Meteora calculates the specific ratio of each token based on the current price and range, ensuring it meets the pool's requirements.
(3) Distribution Strategy
Meteora offers several liquidity distribution methods, allowing users to decide how to allocate funds across bins:
Spot (Uniform Distribution): Funds are evenly distributed across each bin, suitable for scenarios with expected low price volatility.
Curve (Bell Curve Distribution): Funds are concentrated near the current price, decreasing as the distance from the current price increases, resembling a bell curve, suitable for LPs focusing on the current price.
Bid-Ask (Two-Sided Distribution): Funds are concentrated on both sides of the current price, forming two peaks, suitable for high-volatility markets.
(4) Bin Step
Users cannot change the bin step when creating a position; it is set when creating the pool.
2. Connect Wallet to View
Meteora supports connecting wallet addresses to view held positions and allows for observation of wallet addresses. We can use this feature to check the price ranges of pools.
Taking $trump (6p6xgHyF7AeE6TZkSmFsko444wqoP15icUSqi2jfGiPN) as an example.
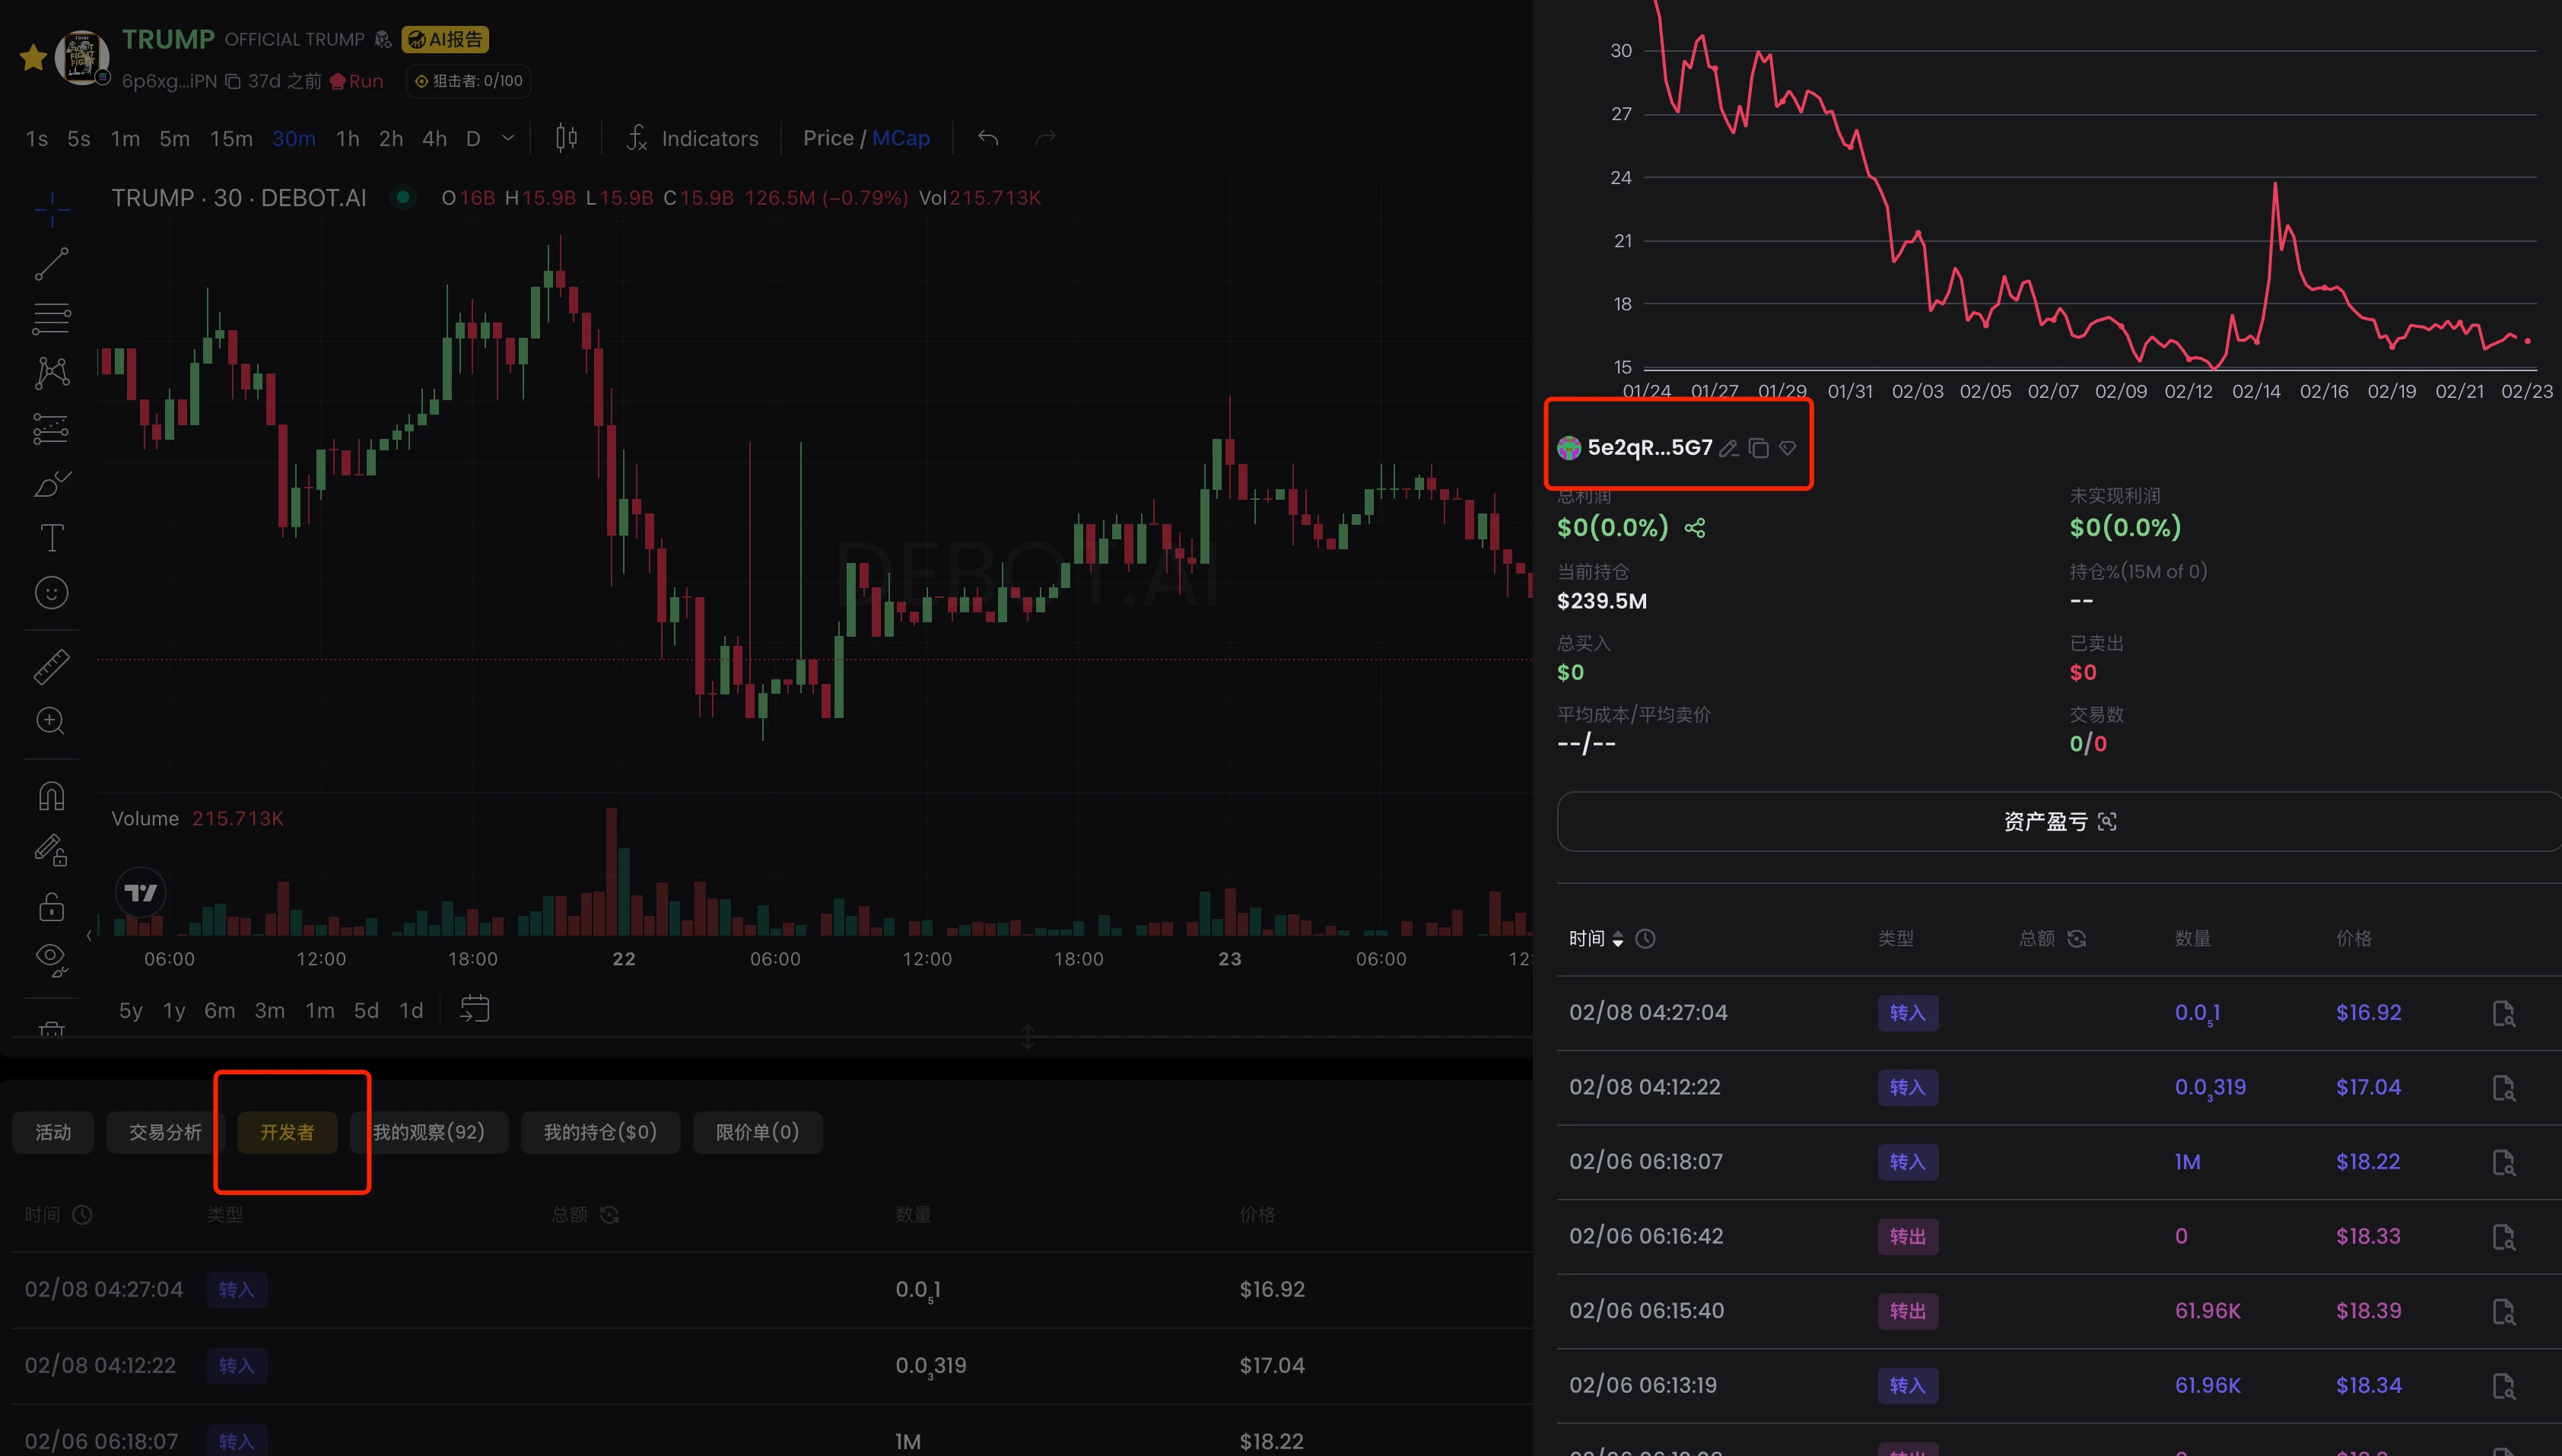
First, we open debot and input the CA of $trump to find the developer's address 5e2qRc1DNEXmyxP8qwPwJhRWjef7usLyi7v5xjqLr5G7, as shown in the image.
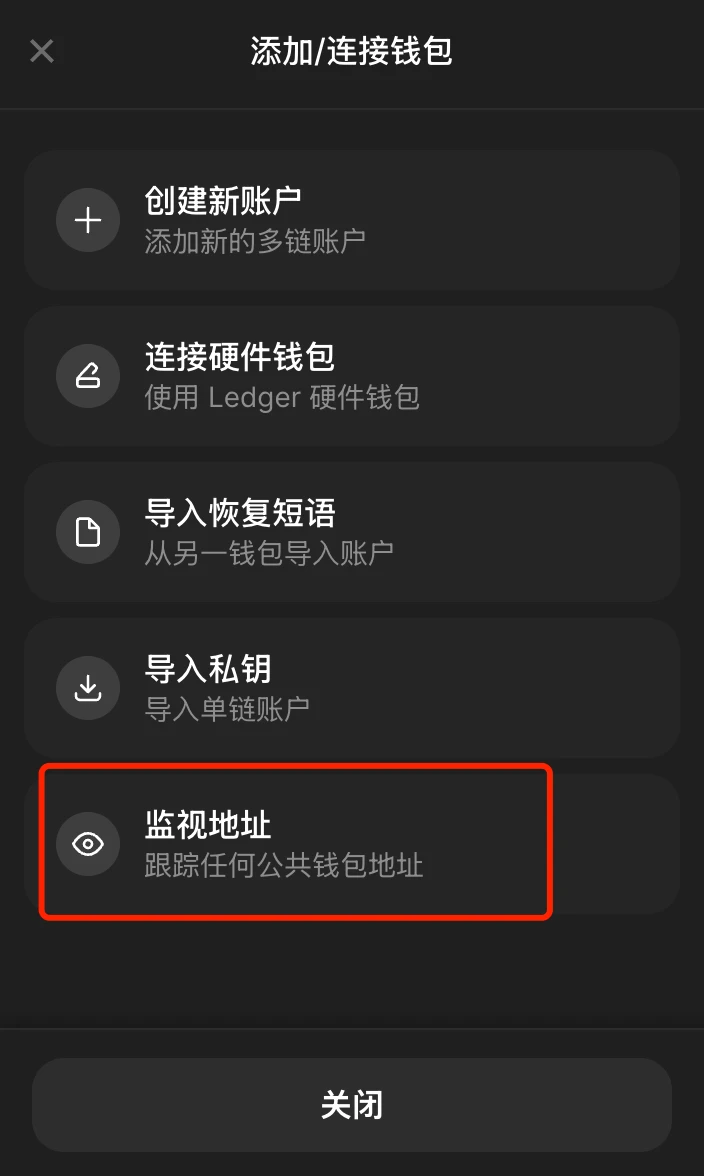
Next, we open the Phantom wallet, click on [Add/Connect Wallet] -- [Monitor Address], input "Name" and "Address," filling in the developer's address 5e2qRc1DNEXmyxP8qwPwJhRWjef7usLyi7v5xjqLr5G7.
Finally, we open Meteora, connect the Phantom wallet, and click on [Portfolio] at the top to see all added pools. Clicking on any DLMM pool will display the pool's details and all positions, as shown in the image.
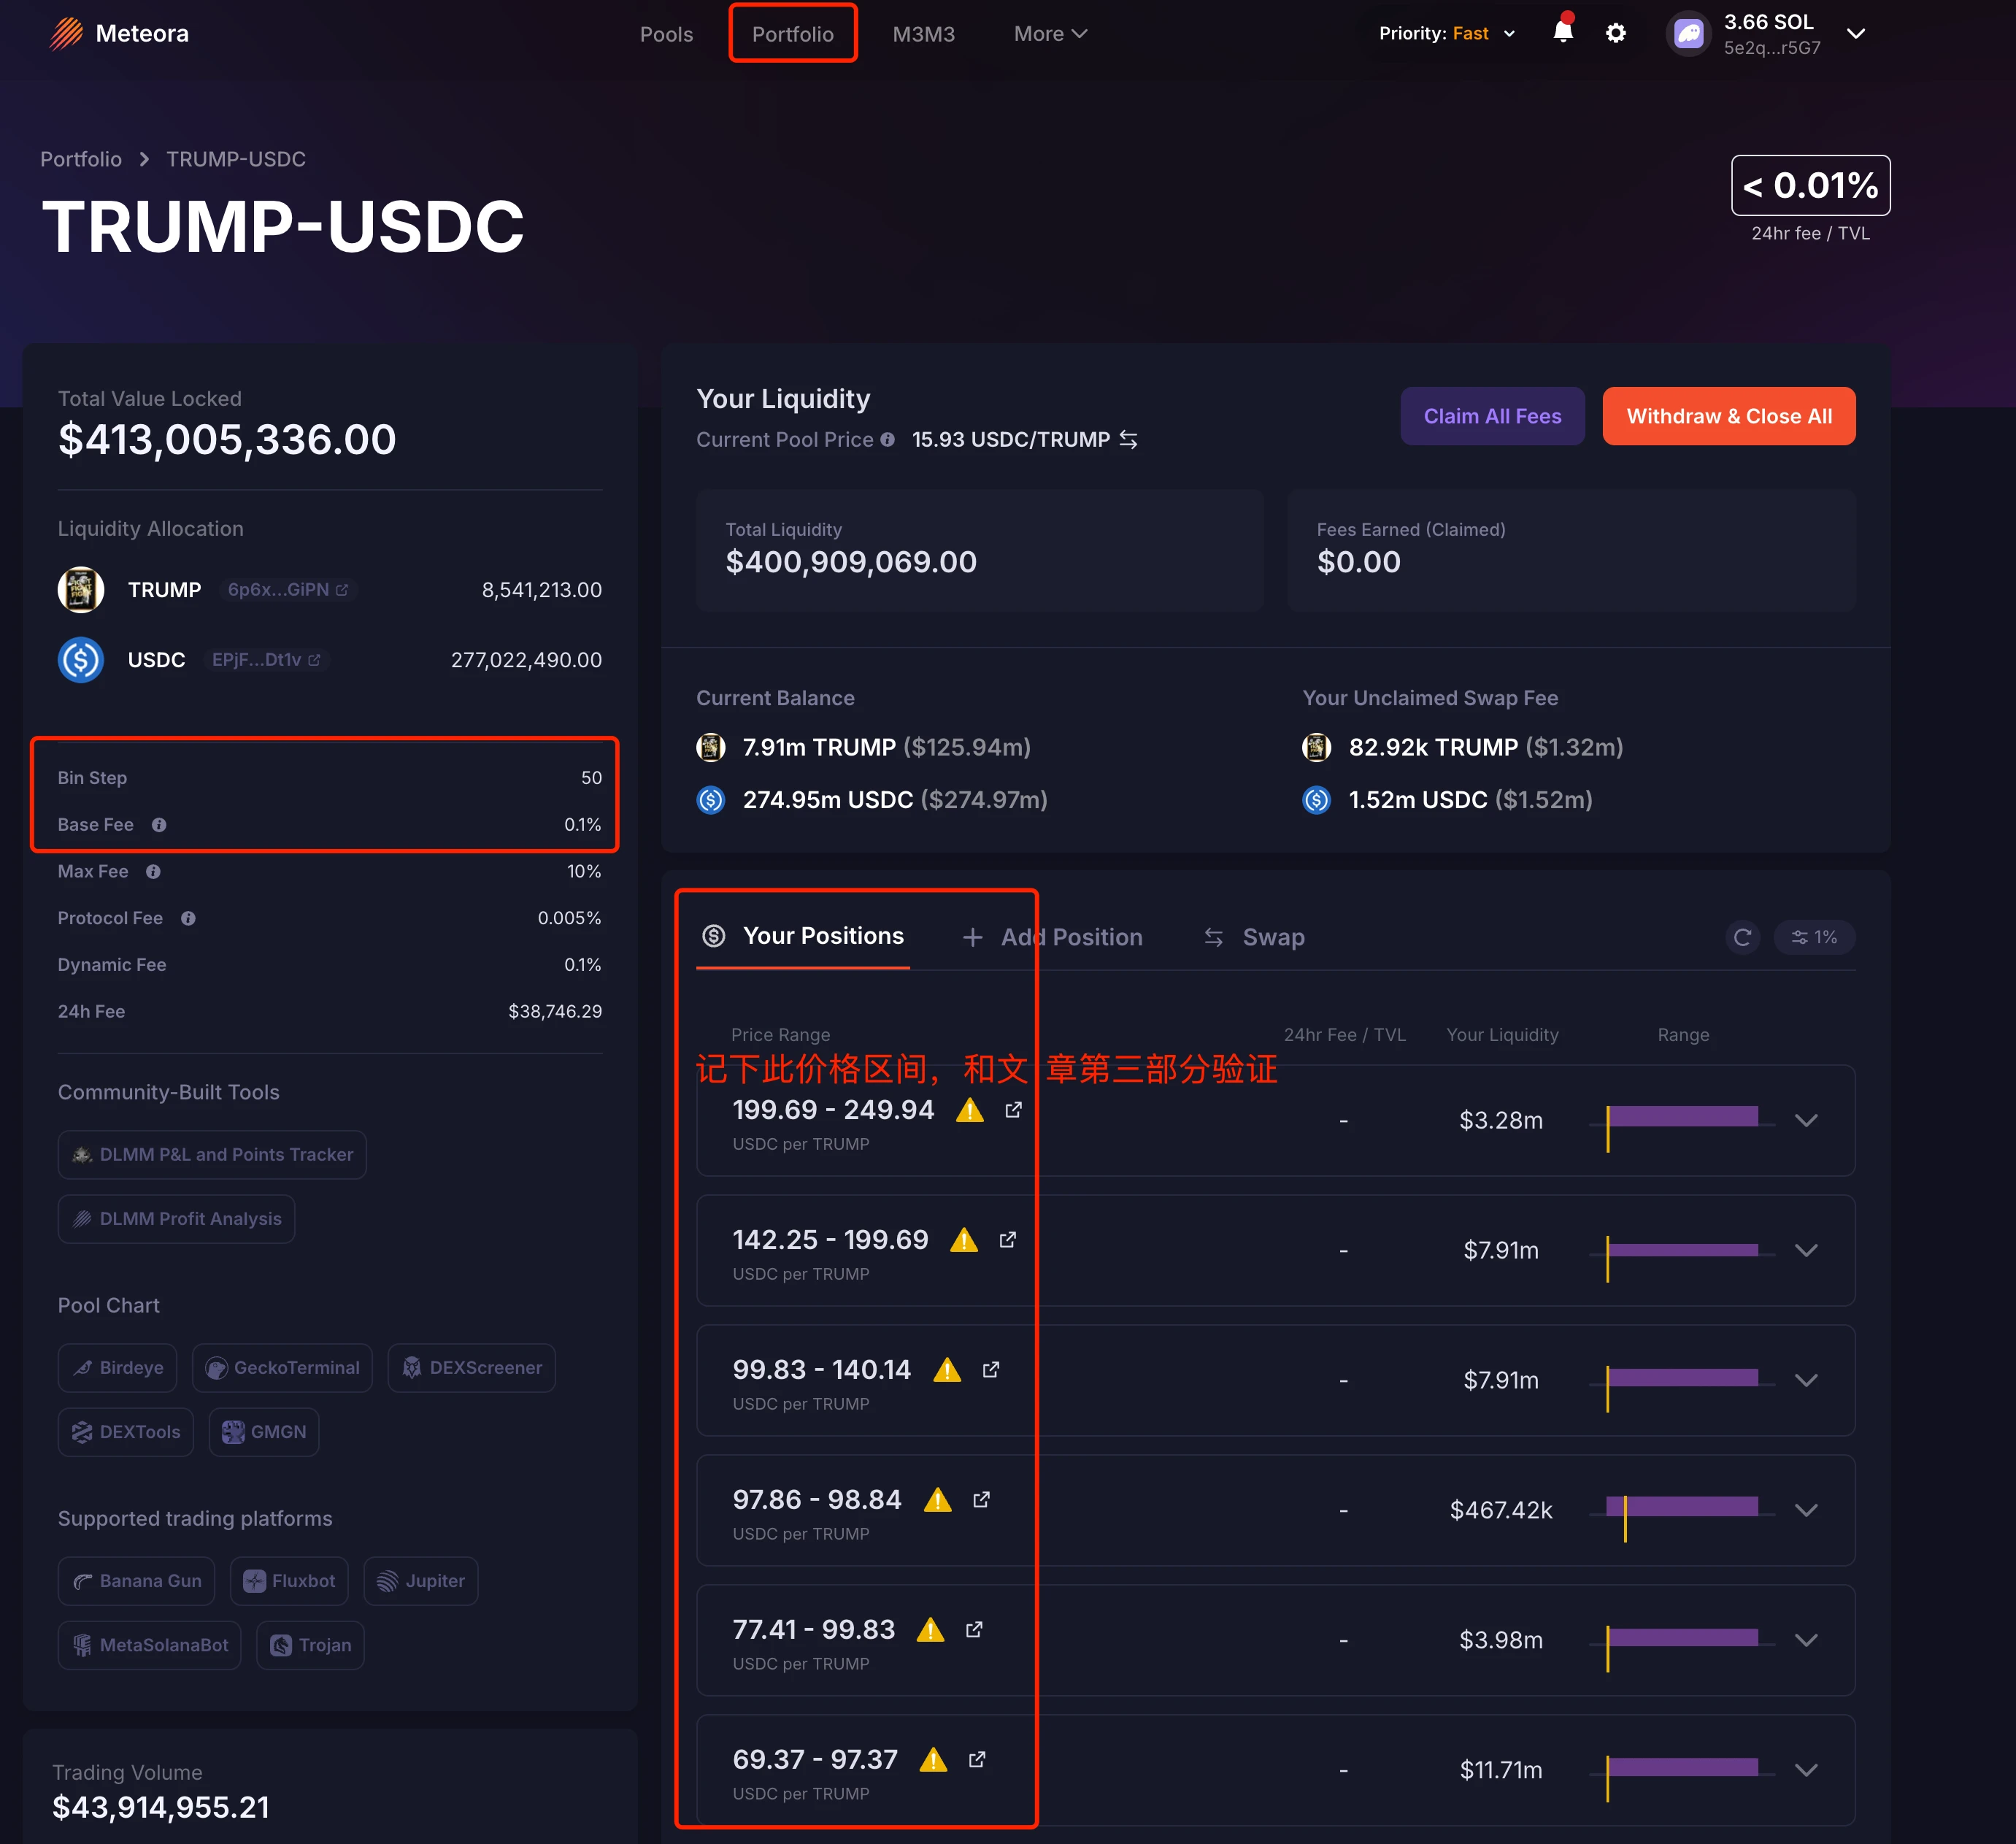
In the image, the Bin Step and Base Fee on the left show the current pool's information, while the middle section displays positions across different price ranges. Clicking on any position reveals current balances, unclaimed fees, distribution strategies, and more.
The advantage of viewing price ranges this way is its convenience and intuitiveness, as it lists all existing position data. The downside is that once liquidity is withdrawn, it cannot be viewed.
3. On-Chain Data Calculation
We can calculate the price range of each position using on-chain data, regardless of whether the position still exists.
Meteora's documentation provides the calculation formulas:
Minimum price of the price range: minprice = (1 + binstep/10000) ^ lowerbinid
Maximum price of the price range: maxprice = (1 + binstep/10000) ^ upperbinid
If the trading pair is represented as A/B, where token A has a precision of decimalsA and token B has a precision of decimalsB, the final calculation formulas are:
Minimum price of the price range: minprice = (1 + binstep/10000) ^ lowerbinid / 10^(decimalsB-decimalsA)
Maximum price of the price range: maxprice = (1 + binstep/10000) ^ upperbinid / 10^(decimalsB-decimalsA)
It is important to note that the calculated price here is the price of token A relative to token B. If you want to view the price of token A relative to USD, you will need to check the USD price of token B and then convert it.
From the above formulas, we can see that to calculate the data, we need to know a pool's binstep, the lowerbinid and upperbin_id of the position, as well as the precision of the two tokens in the trading pair.
Continuing with $trump (6p6xgHyF7AeE6TZkSmFsko444wqoP15icUSqi2jfGiPN) as an example, we will calculate the price range of a unilateral pool for this developer.
We open solscan, input the developer's address for $trump ( https://solscan.io/account/5e2qRc1DNEXmyxP8qwPwJhRWjef7usLyi7v5xjqLr5G7?activitytype=ACTIVITYTOKENADDLIQ&page=5#defiactivities ), open the [Defi Activities] tab, and filter the [Action] for "ADD LIQUIDITY." In the Amount column, we can see that all listed liquidity addition transactions are unilateral pools, either adding only $trump or only $usdc. This article takes the last transaction in the image as an example.
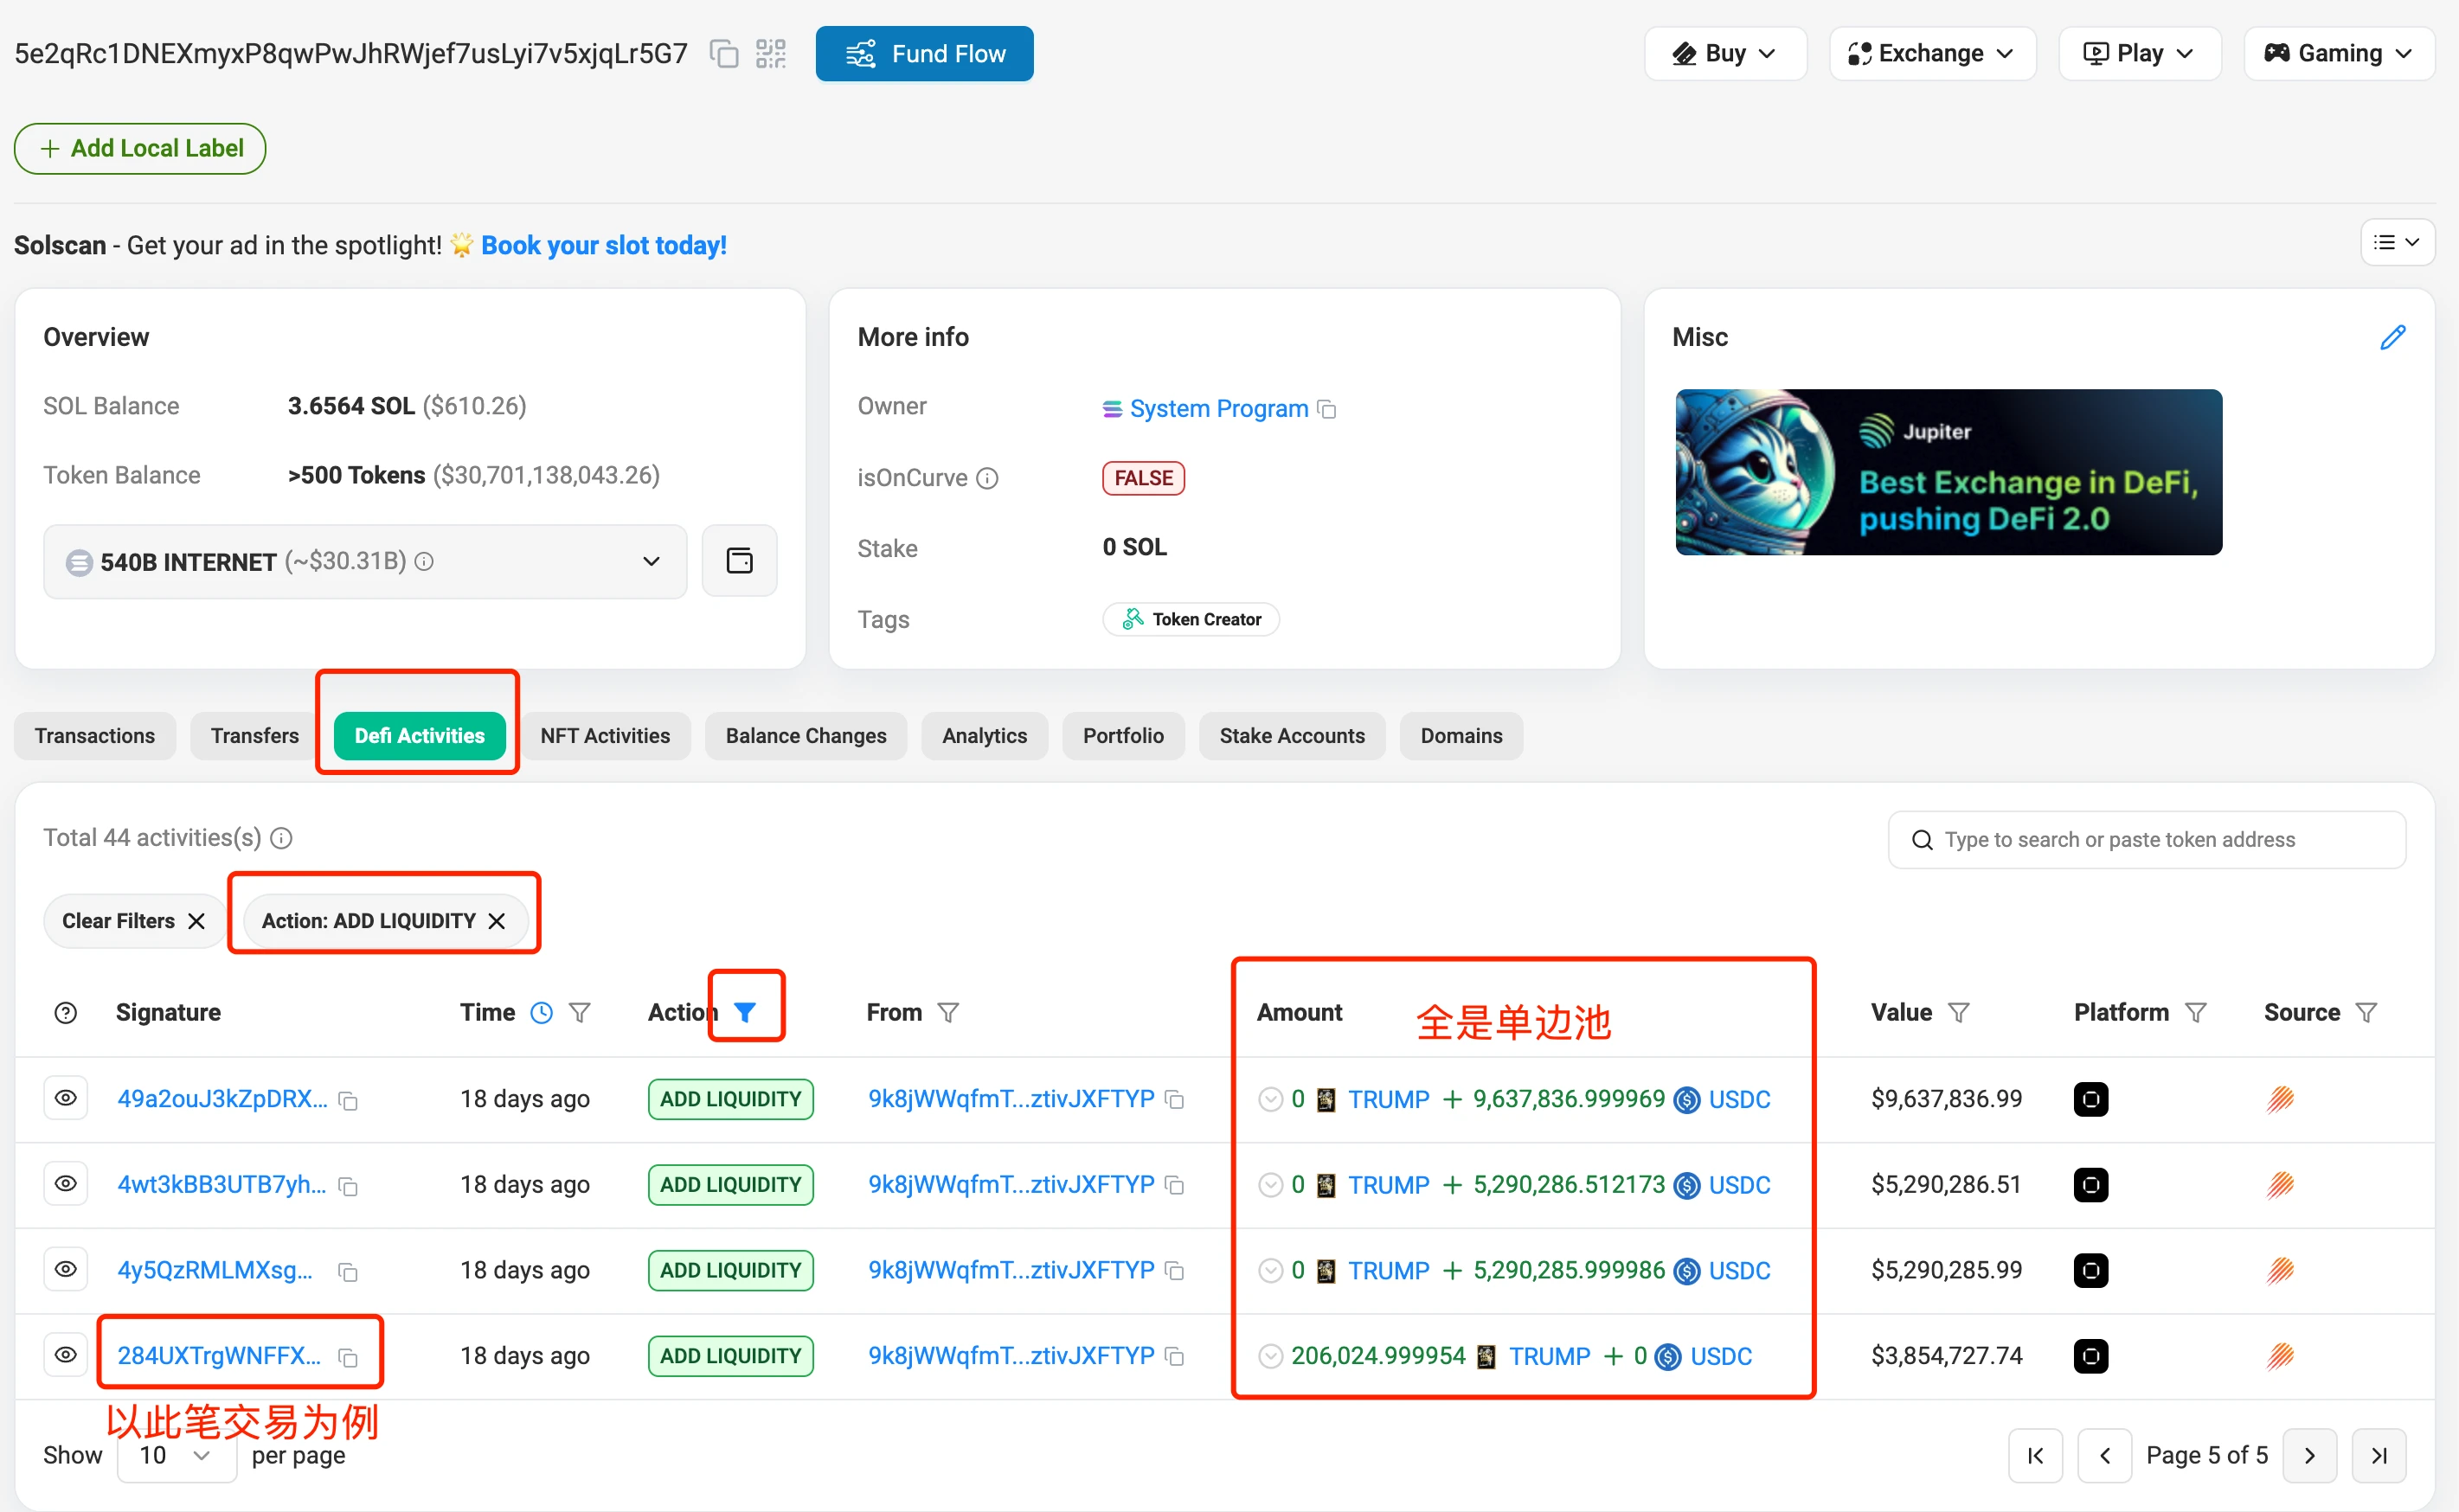
We open the last transaction in the image ( https://solscan.io/tx/284UXTrgWNFFXTovbCAQsJA8U5mW4rntwa8KyRvSmhNYf7cus1rtskiVqwNkErdosDMUsJfxXm8KgkCf1DzTPmPr ), and by checking the transaction details, we can see that this liquidity addition only included $trump.
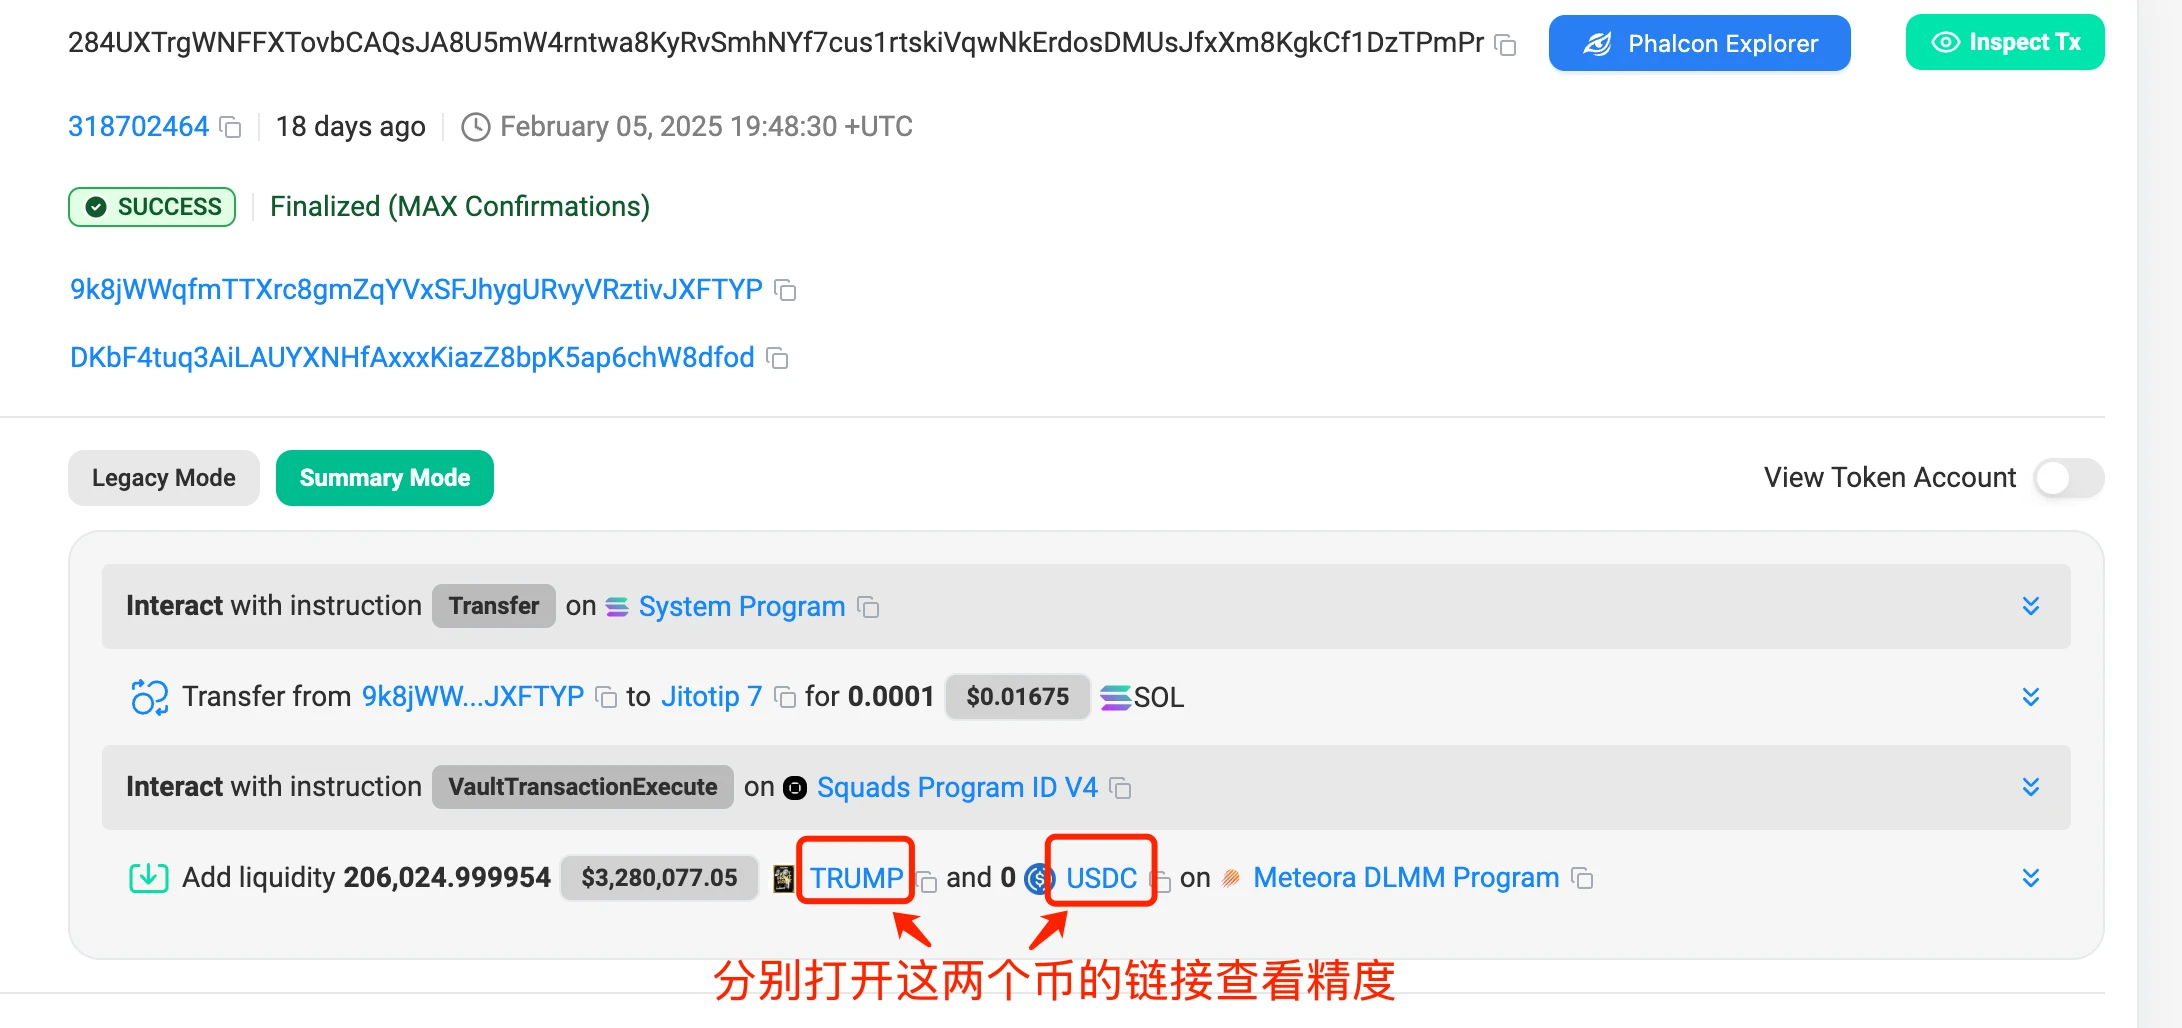
We can check the links for $trump and $usdc to find that the precision for $trump is 6, and the precision for $usdc is also 6, as shown in the image.

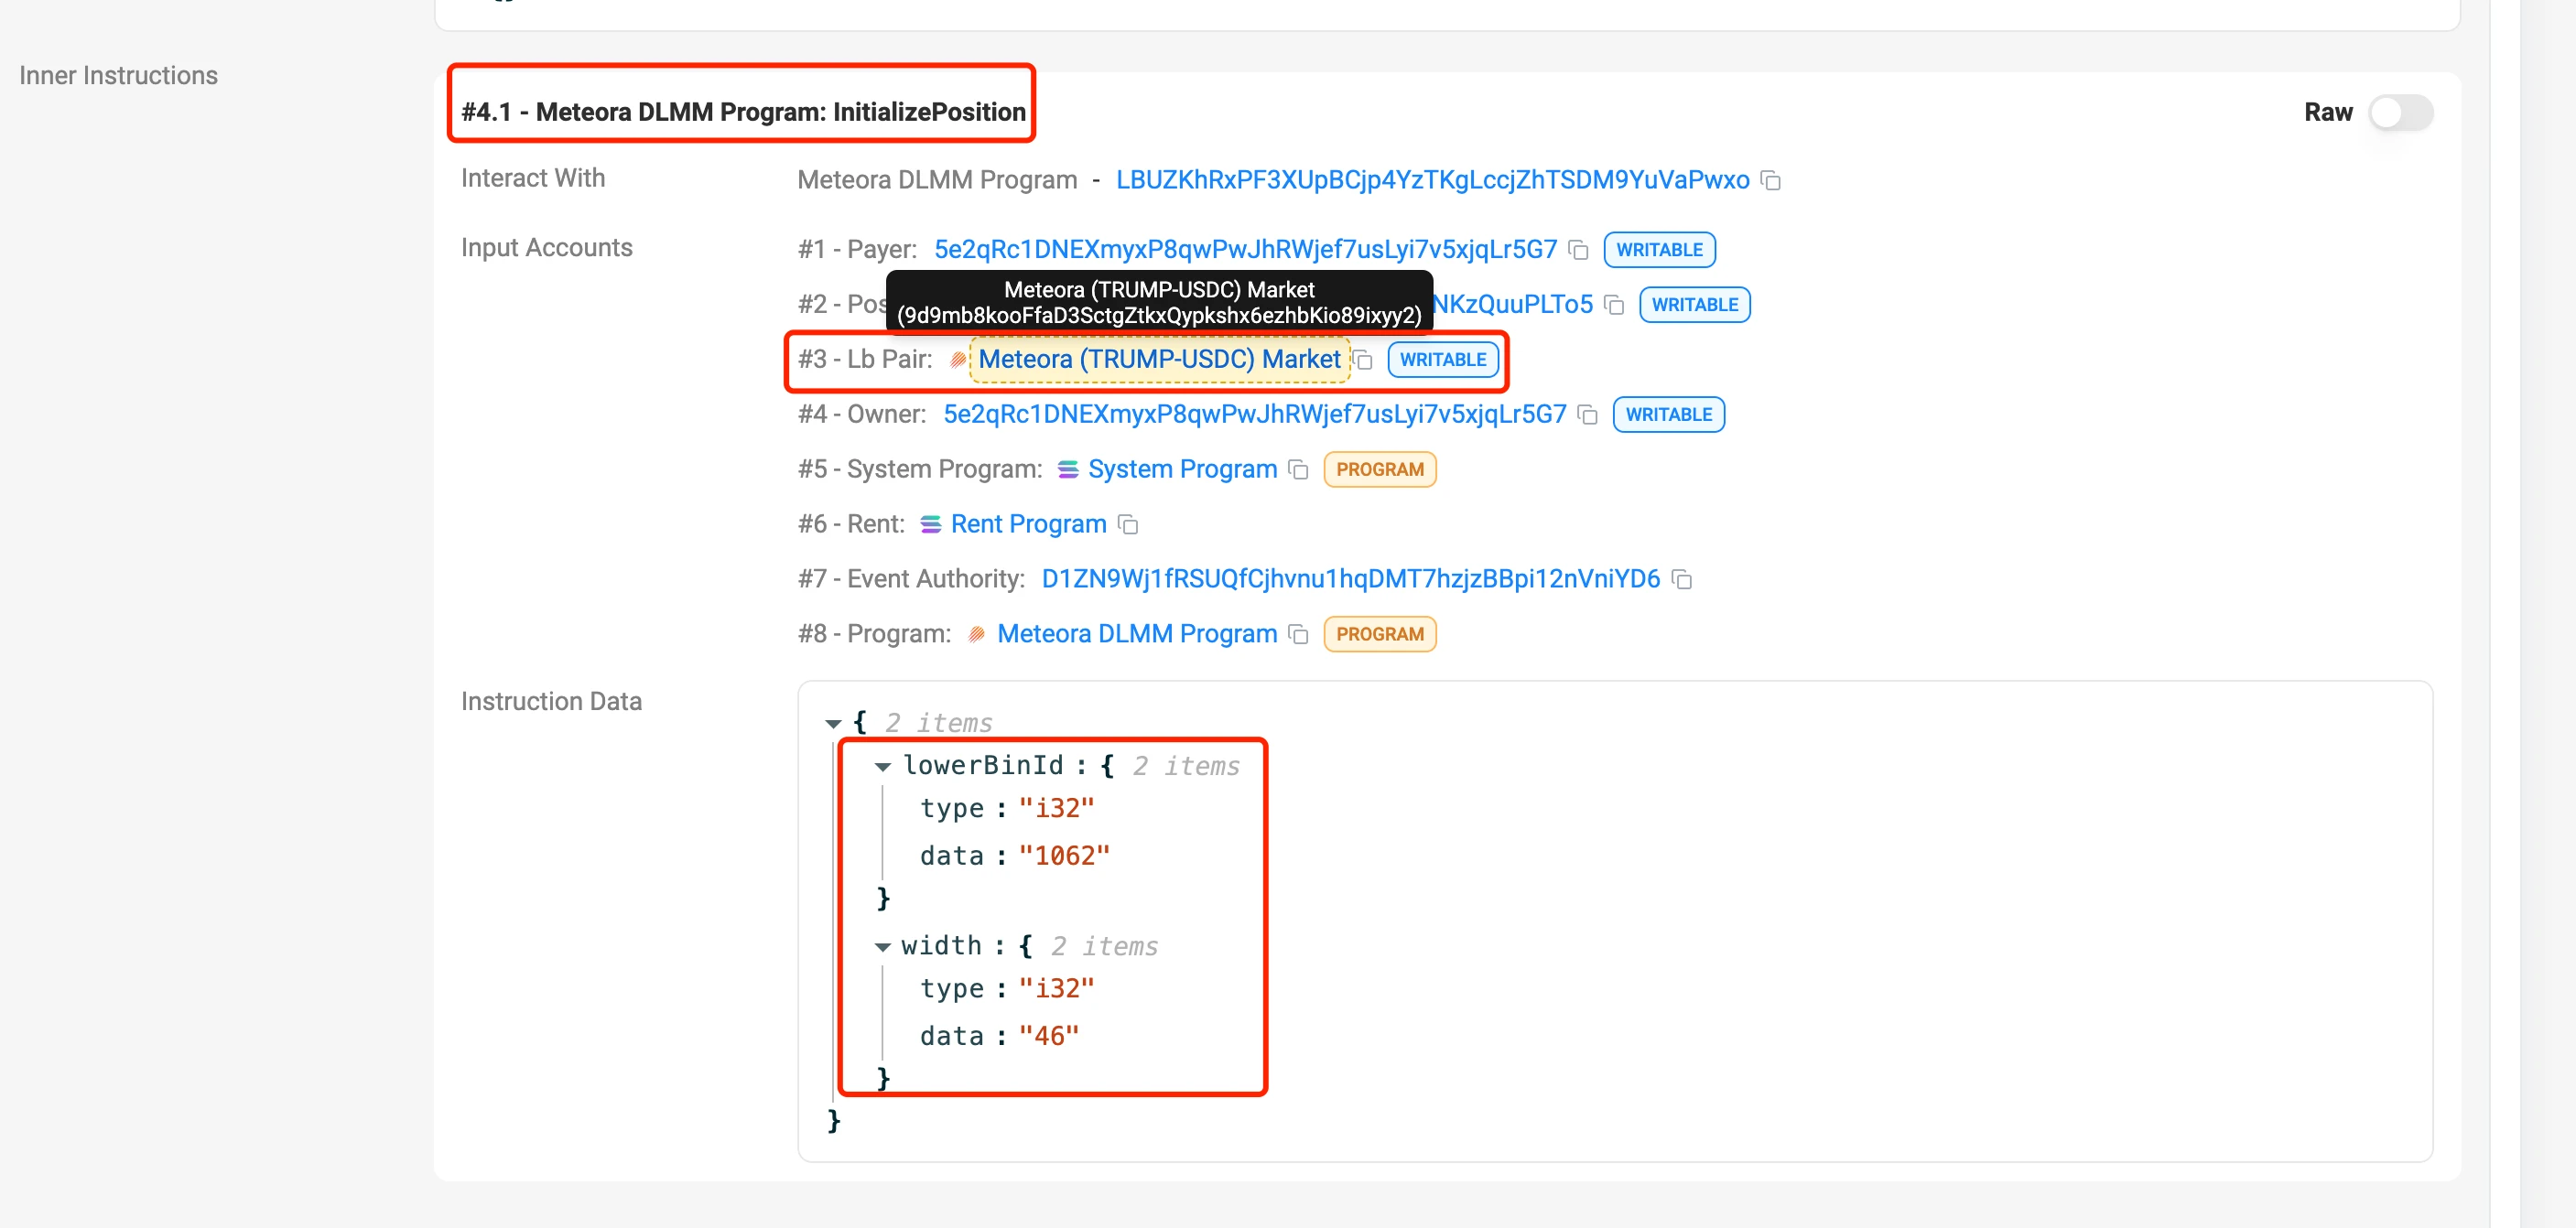
On the transaction details page, scroll down to [#4.1 - Meteora DLMM Program: initializePosition] to find that the lowerBinId is 1062, and the width (number of bins) is 46. The pool address is 9d9mb8kooFfaD3SctgZtkxQypkshx6ezhbKio89ixyy2, as shown in the image. From this information, we can calculate upperBinId = lowerBinId + width - 1 = 1062 + 46 - 1 = 1107.
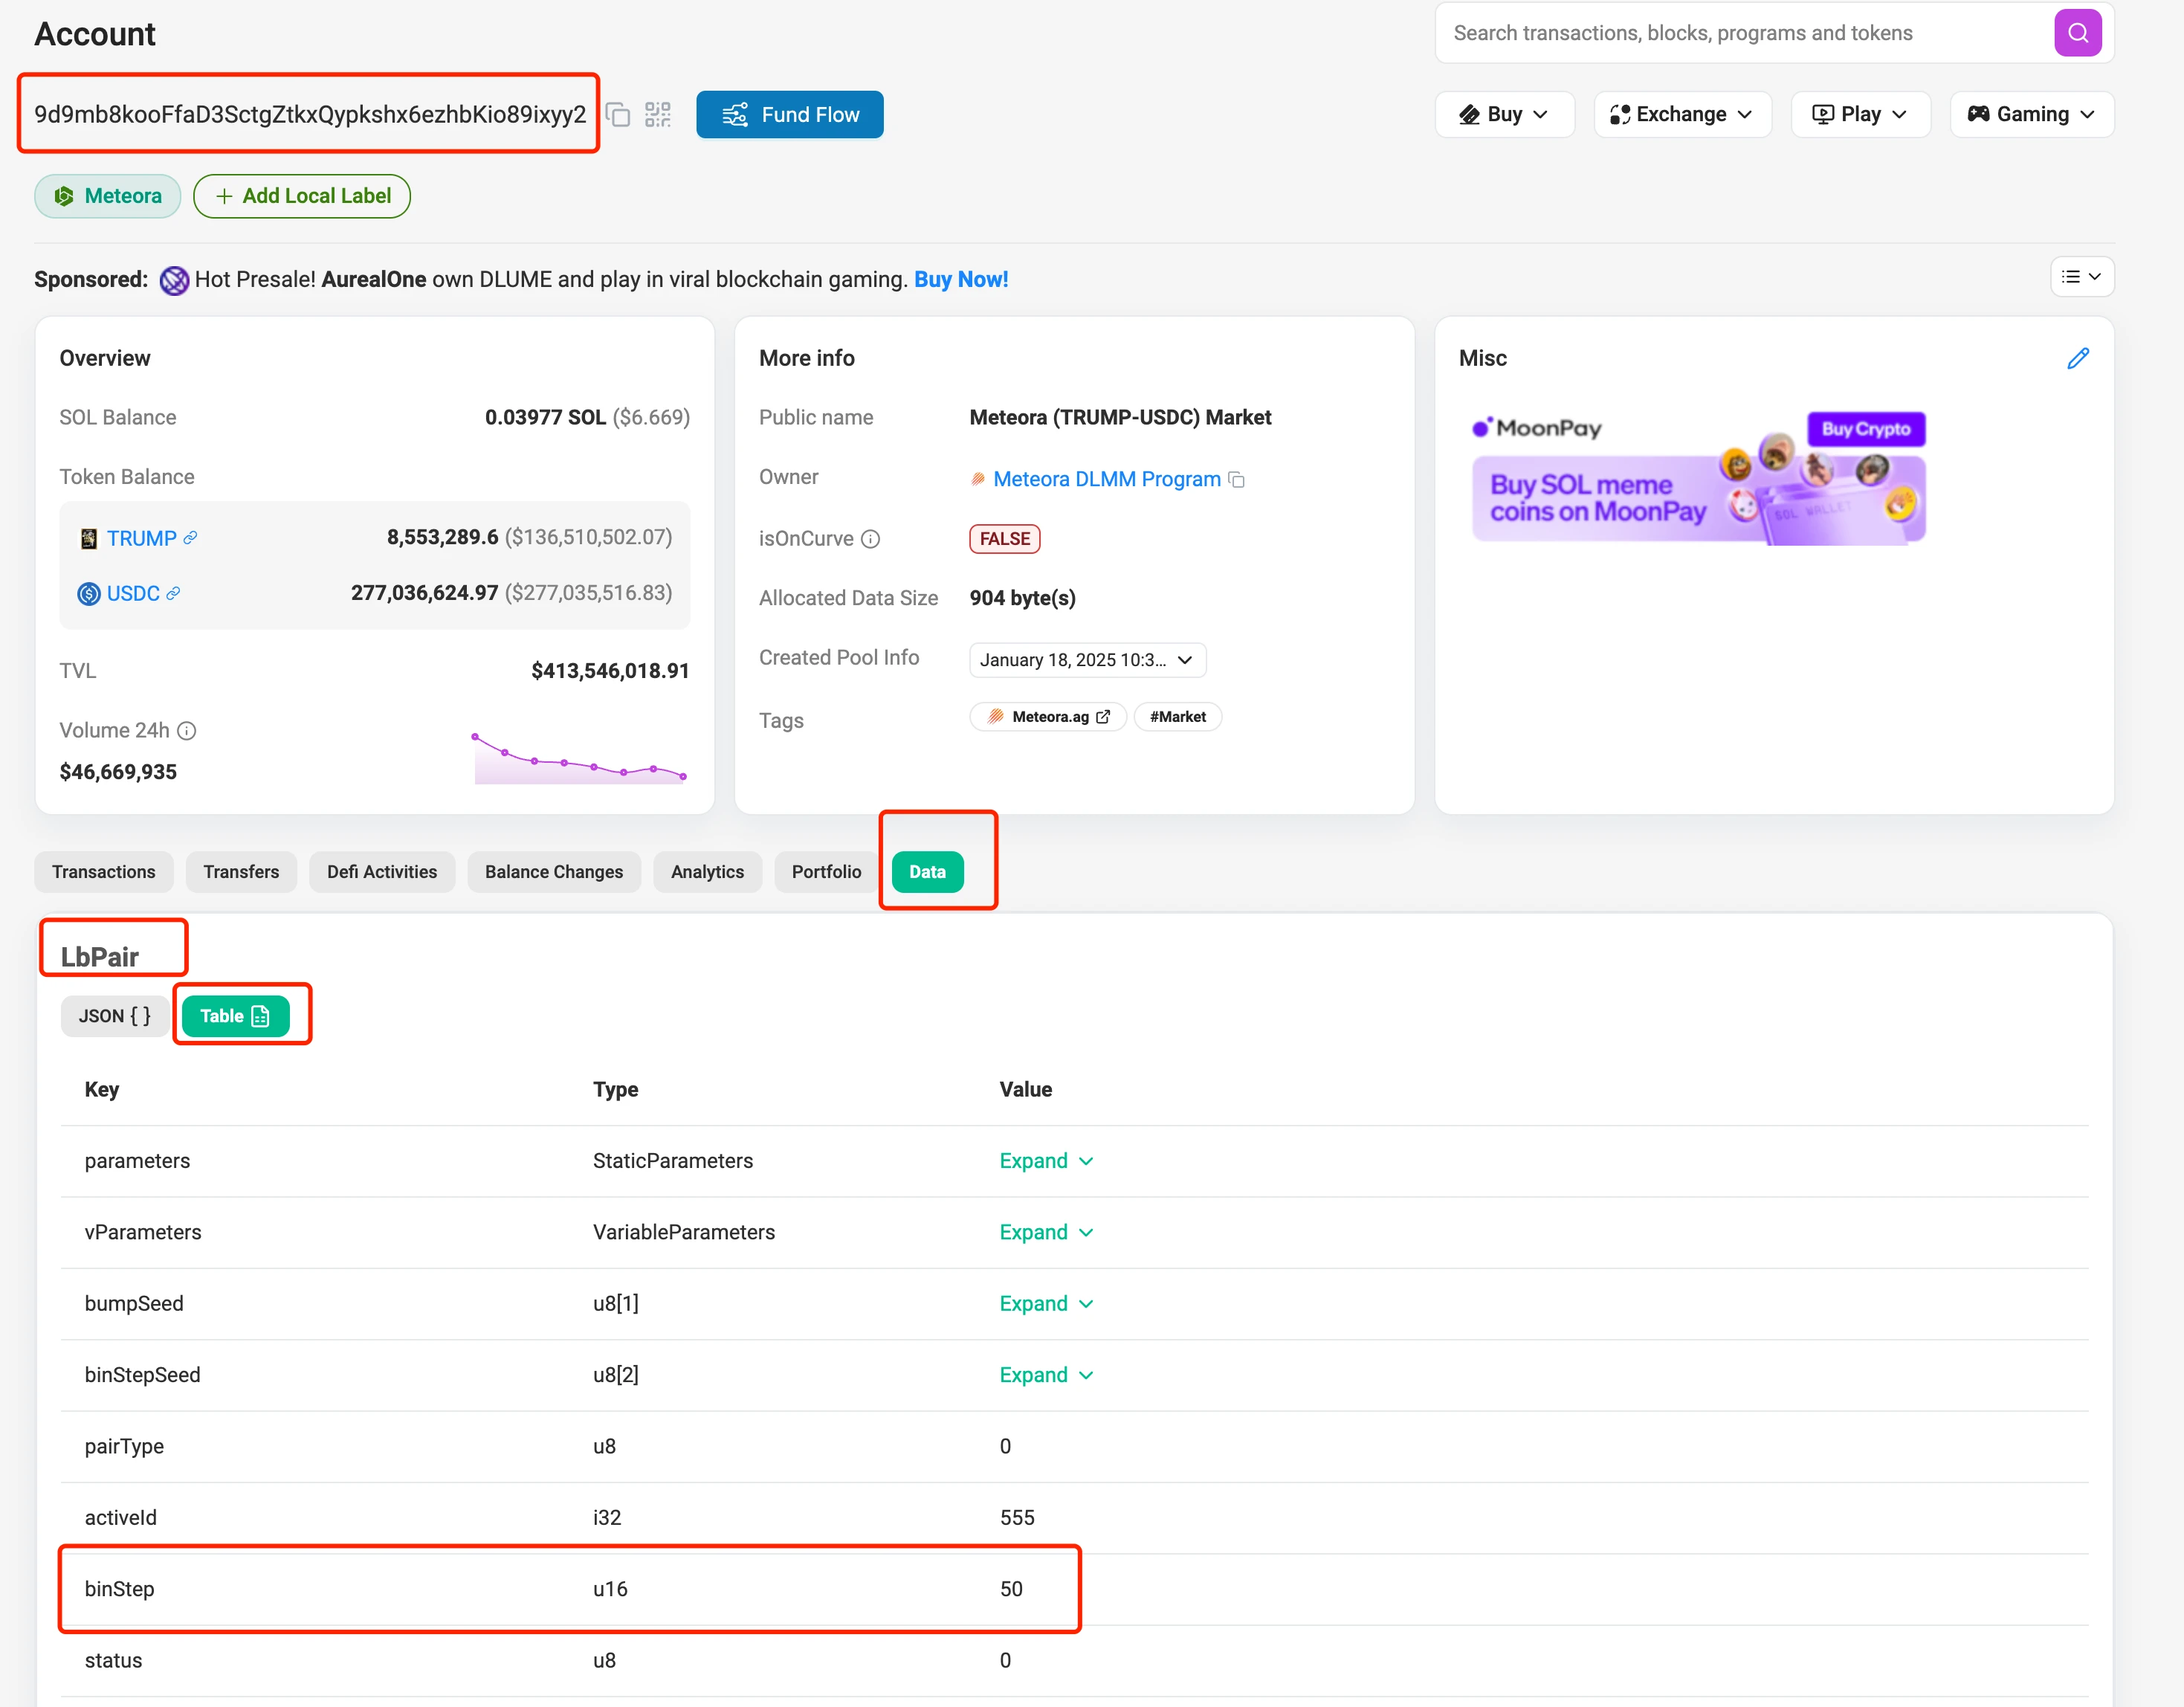
Open the pool address 9d9mb8kooFfaD3SctgZtkxQypkshx6ezhbKio89ixyy2 on solscan ( https://solscan.io/account/9d9mb8kooFfaD3SctgZtkxQypkshx6ezhbKio89ixyy2 ), click on the [data] tab, and switch "LbPair" to "Table" to find that the binStep value is 50, as shown in the image.
From the above information, we can obtain all the data needed for the calculation formulas:
bin_step = 50
lowerbinid = 1062
upperbinid = 1107
decimals_A = 6
decimals_B = 6
Thus, we can calculate:
Minimum price of the price range: minprice = (1 + binstep/10000) ^ lowerbinid / 10^(decimalsB-decimalsA) = (1 + 50/10000)^1062 / 10^(6-6) = 199.6905832
Maximum price of the price range: maxprice = (1 + binstep/10000) ^ upperbinid / 10^(decimalsB-decimalsA) = (1 + 50/10000)^1107 / 10^(6-6) = 249.9368917
The calculated price range matches exactly with the price range shown in the second part of the image.
4. Summary
By using monitoring tools, when we notice that the developer or other large holders are adding unilateral pools, we can use the above method to calculate the price range they are preparing for selling or accumulating, and then make decisions based on K-line and other data. The $libra issued by Argentine President Milei also used unilateral pool additions for selling, and we can use the methods introduced above to review the price range at which he added liquidity.
The tools I commonly use are debot, gmgn, and okx. However, these three tools are not very convenient for viewing liquidity. Some ideal features I would like to see include:
- Listing all operations of the developer, including deposits, withdrawals, adding pools, and removing pools, and being able to identify and mark transactions involving locked positions and adding/removing liquidity.
debot can identify all deposits and withdrawals, but does not track adding or removing pools;
gmgn can identify adding and removing pools, but does not track the developer's deposits and withdrawals, and does not recognize the developer's adding and removing pool transactions for the $trump token;
okx has a feature for changes in liquidity pools, which separately lists adding and removing pools, but it also does not recognize the developer's adding and removing pool transactions for the $trump token.
For each adding and removing pool transaction, providing specific price ranges so that manual calculations are not necessary.
When calculating the developer's profit data, including the received fees and changes in funds during pool removals, so that manual profit statistics are not needed.
This functionality is mainly possible with debot and gmgn, as they have already compiled profit data for each address.
I look forward to these tools becoming more user-friendly!
免责声明:本文章仅代表作者个人观点,不代表本平台的立场和观点。本文章仅供信息分享,不构成对任何人的任何投资建议。用户与作者之间的任何争议,与本平台无关。如网页中刊载的文章或图片涉及侵权,请提供相关的权利证明和身份证明发送邮件到support@aicoin.com,本平台相关工作人员将会进行核查。