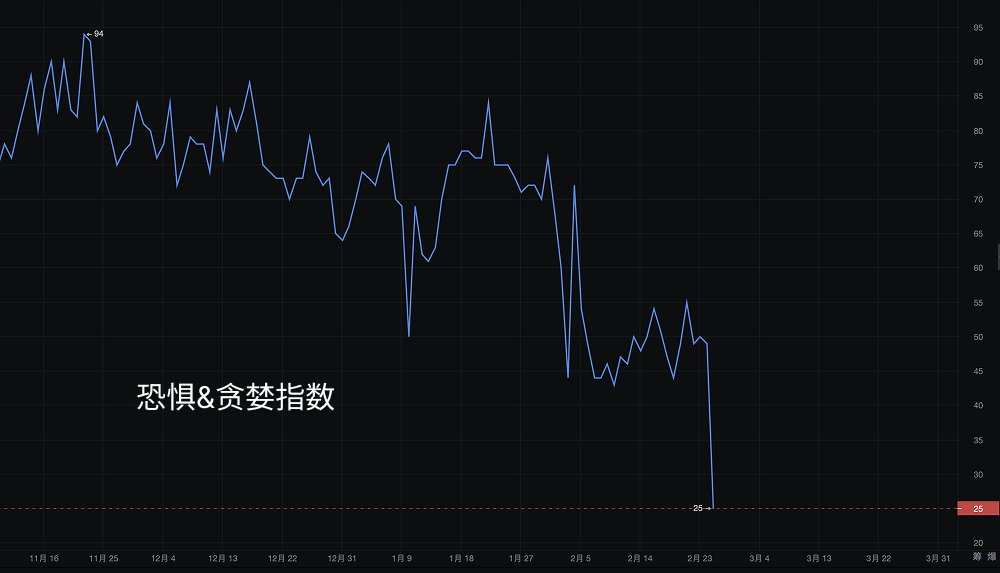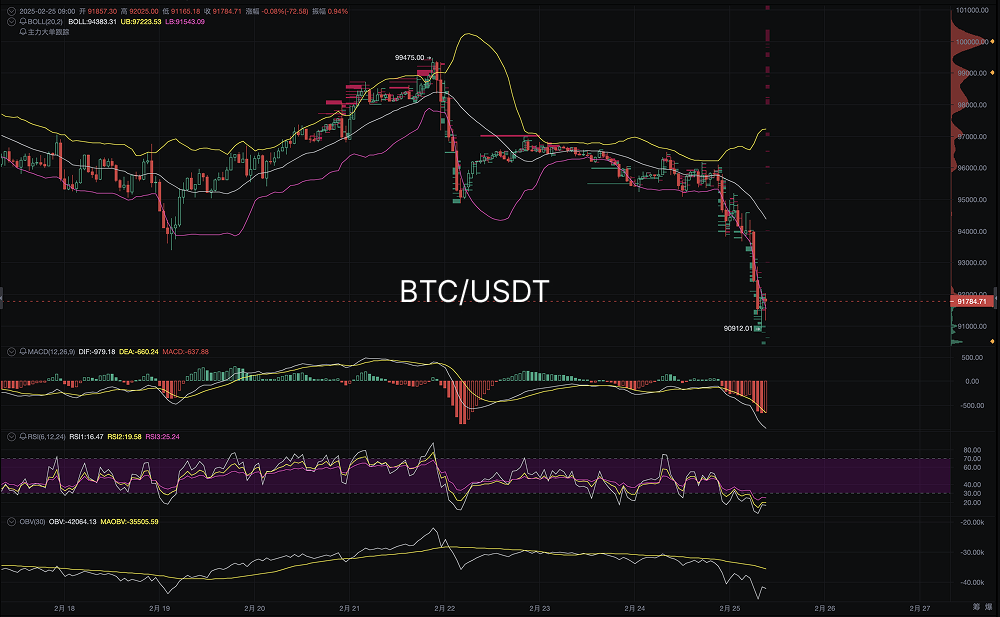
The current Fear and Greed Index has plummeted to 25, entering the Extreme Fear zone, indicating a pessimistic market sentiment, with investors panic selling and short-term selling pressure increasing. Historical experience shows that extreme fear often accompanies market declines, but it may also signal that a bottom is about to form. From the Bitcoin candlestick chart, the price has broken through several key support levels, the MACD remains in a bearish trend, and the RSI has entered the oversold zone. There may still be short-term downside risk, but the probability of a rebound from oversold conditions is also increasing.

Candlestick Pattern Analysis
(1) Recent Trend Overview
The price experienced a surge in mid-February, forming a short-term top around 99475, before quickly retreating.
Recently, the candlestick chart has shown a significant decline, with a low point reaching 90912 and a closing price of 91784.71, indicating strong market selling sentiment.
The candlestick pattern shows a "headless guillotine" trend, which means a sudden sharp decline after a period of consolidation at high levels, typically indicating a trend reversal, with market sentiment leaning bearish in the short term.
(2) Key Support and Resistance
Support Level: 90912 (current low), if this point is broken, it may test the psychological level of 90000 or even lower.
Resistance Level: Short-term 93000-94000 area, if the price rebounds to this area but fails to break through, further declines may occur.
Large Capital Flow
The OBV (On-Balance Volume) indicator shows that large funds are continuously flowing out, indicating that the main capital in the market may be withdrawing.
During the decline, trading volume has significantly increased, showing that bearish forces dominate the market, and bulls have not yet organized an effective counterattack.
There is no significant large order support in the order book, indicating that the current market still tends to sell off and has not formed a bottom.
Technical Indicator Analysis
(1) MACD (Trend Indicator)
DIF (Fast Line) = -378.18, DEA (Slow Line) = -660.24, MACD Histogram = -637.88 (Deep Red)
The MACD shows a "death cross" state, and the red color of the histogram is gradually deepening, indicating that the downtrend is still continuing.
If the DIF does not quickly rebound, the price may further decline.
(2) RSI (Relative Strength Index)
RSI6 = 16.47, RSI12 = 19.58, RSI24 = 25.24
The RSI has entered the oversold zone (below 30), but has not yet formed a significant rebound, indicating that market sentiment still leans towards panic.
It is necessary to observe whether the RSI can rise above 30; otherwise, it may continue to decline.
(3) Bollinger Bands
The price has broken through the lower Bollinger Band and continues to run along the lower band, indicating that the market is in an extreme oversold state.
If the price does not return to within the Bollinger Bands in the short term, it may further decline.
Today's Trend Prediction
(1) Possible Trends
First Scenario (Weak Rebound Followed by Continued Decline, Probability 70%)
The price may oscillate in the 91000-92000 area in the short term, but if the rebound is weak, it will continue to test the 90000 support.
Observe the 92000-93000 area; if it cannot stabilize, the bears may further push the price down.
Second Scenario (Strong Rebound, Probability 30%)
If capital inflow strengthens and stabilizes above 92000, it may rebound to the 93000-94000 area, but it still needs to break through 94500 to potentially restart the upward trend.
(2) Operational Suggestions
Short-term Traders: Be cautious about bottom fishing; if the price stabilizes at 92000, consider trying a light long position, targeting 93000-94000.
Medium to Long-term Investors: Patiently wait for bottom signals; if it breaks below 90000, there may be better entry opportunities.
The current Bitcoin market is in a bearish dominant state, and the candlestick pattern shows that the downtrend has not yet ended, with technical indicators not forming significant reversal signals. If it cannot stabilize at 92000 in the short term, it may continue to test the 90000 support level. Investors are advised to remain cautious and closely monitor market movements.
Disclaimer: The above content does not constitute investment advice.
AiCoin Official Website: www.aicoin.com
Telegram: t.me/aicoincn
Twitter: x.com/AiCoinzh
Email: support@aicoin.com
Group Chat: Customer Service Yingying、Customer Service KK
免责声明:本文章仅代表作者个人观点,不代表本平台的立场和观点。本文章仅供信息分享,不构成对任何人的任何投资建议。用户与作者之间的任何争议,与本平台无关。如网页中刊载的文章或图片涉及侵权,请提供相关的权利证明和身份证明发送邮件到support@aicoin.com,本平台相关工作人员将会进行核查。


