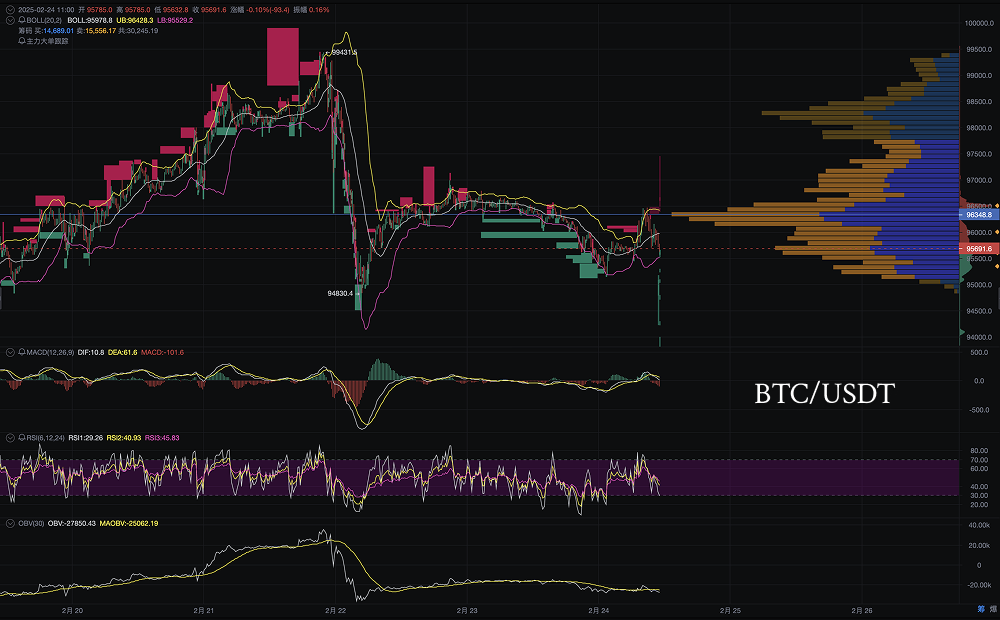
The current Bitcoin price is around $95,800, and after experiencing significant fluctuations, the market is in a consolidation phase. This article will conduct an in-depth analysis from multiple dimensions, including candlestick patterns, trading volume, capital flow, technical indicators (MACD, RSI, Bollinger Bands), market sentiment, and today's trend prediction.

1. Candlestick Pattern Analysis
1.1 Recent Trend Review
- Bitcoin quickly fell from the high of $98,431.5 on February 21, reaching a low of $94,830, with a short-term decline of over 3.6%, entering an adjustment period.
- The current price is fluctuating in the range of $95,800-$96,350, and no clear reversal signal has formed yet.
- A "M-top" pattern (double top structure) has formed, and the current price is still in the neckline area. If it breaks below $95,000, it may further test the key support at $94,000-$93,500.
1.2 Key Support and Resistance
| Level | Support Level | Resistance Level | Remarks | |---------------|---------------|------------------|-------------------------------------------| | Strong Support| 94,800 | 97,000 | Recent low support / high transaction area| | Important Support| 95,500 | 96,350 | Intraday support / short-term resistance | | Short-term Support| 95,800 | 96,000 | Current price area, short-term key point |
2. Large Capital Flow
2.1 Capital Flow
- Main capital: Net outflow, with large sell orders appearing continuously recently, indicating weak rebound.
- The OBV (On-Balance Volume) indicator continues to decline, showing insufficient bullish momentum.
- After a deep correction, the market has entered a consolidation and repair phase, but the volume support is limited, indicating further downside risk.
2.2 Market Trading Volume
- Trading volume has gradually shrunk after the sharp drop, indicating that the market has entered a wait-and-see period.
- If there is a volume breakout above $96,350 in the future, it is expected to test above $97,000; if the volume decreases during the adjustment, it is likely to continue downward.
3. Technical Indicator Analysis
3.1 MACD (Trend Momentum)
- The DIF line (36.5) is below the DEA line (74.7), and the MACD green bars continue to shorten, suggesting a decrease in bearish momentum, but no clear reversal has formed yet.
- There are signs of a golden cross in the short term; if accompanied by volume, a short-term rebound may occur.
3.2 RSI (Relative Strength Index)
- RSI6 = 35.83, RSI12 = 44.96, RSI24 = 48.18; the short-term RSI is in the oversold range (35.83), indicating a potential technical rebound demand in the short term. The RSI has not yet broken through the 50 strength boundary, showing insufficient bullish strength, and overall remains weak.
3.3 Bollinger Bands (Trend Judgment)
- The price is currently at the lower Bollinger Band area (LBB: 9552.2), indicating short-term oversold conditions.
- The upper band pressure is at 97,500, the middle band pressure is at 96,000, and the short-term pressure is at 96,350.
- If the price cannot stabilize above 96,000, it is likely to continue testing the support area of 95,000-94,800.
4. Market Sentiment and Risk
The market sentiment index leans towards panic, with significant capital outflow.
Trading volume is sluggish, and short-term wait-and-see sentiment is strong.
There has been no significant short squeeze or liquidation wave in the Bitcoin futures market, indicating that the market is in an adjustment period.
5. Today's Market Prediction
5.1 Trend Judgment
- The short-term key point is 96,000; if it breaks through, there is a chance to hit 97,000.
- If it falls below 95,800, it may retest 95,000, or even the low points of 94,800-94,000.
- The overall market remains weak, with limited short-term rebound space.
5.2 Operation Suggestions
| Operation Direction | Entry Point | Take Profit Target | Stop Loss Point | Suitable Group | |---------------------|--------------|--------------------|------------------|-------------------------| | Long (Short-term) | 95,000-95,500| 96,350-97,000 | 94,800 | Low-risk investors | | Short (Rebound Short)| 96,350-97,000| 95,500-95,000 | 97,500 | Aggressive traders |
6. Summary
- Short-term market: Fluctuating consolidation between 95,800-96,350, with slight rebound space in the short term.
- Key support: 95,000, 94,800; if it breaks below 94,800, it may accelerate downward to 94,000.
- Key resistance: 96,000, 96,350; if it breaks through 96,350, it may test 97,000.
- The capital situation remains bearish, with insufficient short-term trading volume and limited bullish momentum.
- Operation strategy: It is recommended to buy low in the short term, with a stop loss set below 94,800; if the rebound does not break 96,350, consider shorting with a light position.
The market is still in an adjustment period; it is advisable to remain cautious and wait for clear signals before making decisions.
Disclaimer: The above content is for reference only and does not constitute investment advice.
Pionex official website: www.aicoin.com
Telegram: t.me/aicoincn
Twitter: x.com/AiCoinzh
Email: support@aicoin.com
Group chat: Customer Service Yingying, Customer Service KK
免责声明:本文章仅代表作者个人观点,不代表本平台的立场和观点。本文章仅供信息分享,不构成对任何人的任何投资建议。用户与作者之间的任何争议,与本平台无关。如网页中刊载的文章或图片涉及侵权,请提供相关的权利证明和身份证明发送邮件到support@aicoin.com,本平台相关工作人员将会进行核查。


