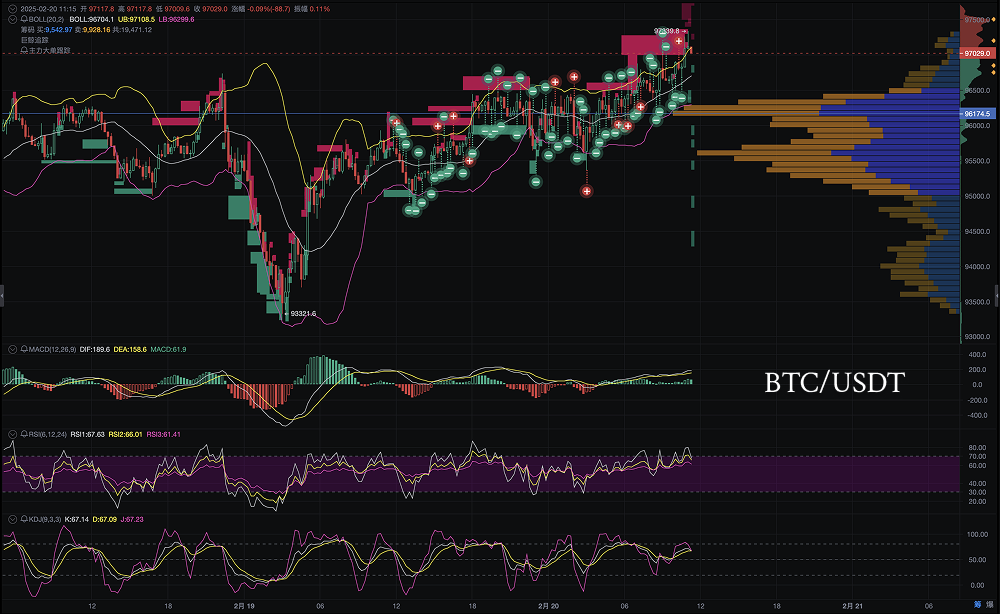
As of February 20, 2025, at 11:00, the price of Bitcoin (BTC/USD) fluctuates around $97,000, showing a clear upward trend, but also accompanied by short-term correction risks.
1. Candlestick Patterns: Fluctuation Range and Key Levels
Recent candlestick movements of Bitcoin indicate that after rebounding from a low of $93,000 on February 18, the price has gradually risen to around $97,000, forming a "doji" or "inverted hammer" pattern, suggesting a balance of power between bulls and bears, with market sentiment being somewhat hesitant. If the price successfully breaks through the resistance at $97,500, it may initiate a new round of increases, targeting $99,000 or even $102,000-$105,000 (based on flag pattern calculations). However, if it falls below the support at $93,000, the market may correct to $91,000 or even $88,000 (previous low).
Current support is at $93,000, with resistance at $97,500 and $99,000. Investors need to closely monitor the breakthrough or breakdown of these key levels to determine market direction.
2. Large Capital Flows: Whale Divergence and Buying Intent
On-chain data and capital flow histograms show that large funds (whales) exhibit significant buying signs in the $93,000-$95,000 range, with orange bars (buying or accumulation) gradually dominating, indicating that market confidence is recovering. However, near $97,000, blue bars (selling or outflow) have significantly increased, suggesting that some whales may be taking profits or cashing out at high levels. This adds pressure for a short-term market correction.
If large funds continue to accumulate positions, the price is expected to break upward; conversely, if selling pressure continues to intensify, the risk of correction will significantly rise. Investors should pay attention to real-time changes in on-chain trading volume and net exchange flows to capture whale movements.
3. Technical Indicators: Bullish Momentum Weakening but Still Dominant
Technical indicators further reveal the current complex market situation:
- Moving Averages (MA): Bitcoin's price is above the short-term moving average but is close to the medium to long-term moving averages (like the 50-day line), indicating that the price may face the risk of entanglement with the moving averages. Falling below the short-term moving average may trigger technical selling pressure, while breaking through the medium to long-term moving averages may attract chasing funds.
- MACD Indicator: The fast line and slow line have recently crossed upward, with the fast line above the zero axis, and the histogram's green bars are shrinking, showing that bullish momentum is weakening but still dominant. If the fast line falls below the slow line and crosses below the zero axis, a short-term correction will be inevitable.
- RSI (Relative Strength Index): The current RSI is 64.75, close to the overbought area (above 70), indicating that the market may face correction risks. If the RSI breaks above 70 and shows divergence, a rapid adjustment should be anticipated.
- KDJ (Stochastic Indicator): The K line, D line, and J line are crossing upward, with the J line approaching the overbought area (above 80), further supporting the possibility of a short-term adjustment.
4. Market Sentiment and Macroeconomic Impact
Bitcoin is currently near historical highs, and market sentiment is cautious, especially against the backdrop of large funds taking profits and institutions adjusting their positions. February 20, 2025, is a working day, and the market may be indirectly influenced by capital inflows after the weekend and macroeconomic data. If the Federal Reserve maintains its current interest rate policy or expectations for rate cuts rise, it will be favorable for Bitcoin prices; conversely, if risk appetite declines, funds may flow into traditional safe-haven assets (like gold), putting pressure on Bitcoin.
5. Today's Price Prediction
Based on the above analysis, Bitcoin's price today may present the following three scenarios:
- Bullish Scenario (Probability 55%): If the price remains above $97,000 and breaks through the $97,500 resistance, combined with the MACD fast line moving upward and no divergence in the RSI, the market may attract more buying, pushing the price to $99,000 or even $102,000. Driving factors include large fund buying and positive news.
- Bearish Scenario (Probability 35%): If the price falls below the $96,000 support, accompanied by a MACD death cross, RSI divergence, or KDJ downward movement, the market may enter a technical correction, targeting $93,000 or even $91,000. Driving factors include large fund selling pressure and a decline in macro risk appetite.
- Fluctuation Scenario (Probability 10%): If the price fluctuates within the $96,000-$97,500 range, with no significant signals from technical indicators and large capital flows remaining balanced, the market may enter a consolidation phase, waiting for a new breakout direction.
6. Trading Suggestions and Risk Warnings
- Bullish Strategy: Buy near $96,500, set a stop loss at $95,500, and target $99,000. After confirming a breakout above $97,500, consider increasing positions moderately.
- Bearish Strategy: Short near $97,500, set a stop loss at $98,000, and target $96,000 or $93,000.
- Risk Management: Given the current market volatility, it is recommended to control positions to no more than 10% of total account funds and closely monitor on-chain data, macro news, and changes in technical indicators.
Conclusion
Bitcoin is currently at a critical turning point, with both upward fluctuations and correction risks coexisting. Investors should carefully operate by combining candlestick patterns, large capital flows, and technical indicators, while also paying attention to macroeconomic dynamics and changes in on-chain data.
Disclaimer: The above content does not constitute investment advice.
AiCoin Official Website: www.aicoin.com
Telegram: t.me/aicoincn
Twitter: x.com/AiCoinzh
Email: support@aicoin.com
Group Chat: Customer Service Yingying、Customer Service KK
免责声明:本文章仅代表作者个人观点,不代表本平台的立场和观点。本文章仅供信息分享,不构成对任何人的任何投资建议。用户与作者之间的任何争议,与本平台无关。如网页中刊载的文章或图片涉及侵权,请提供相关的权利证明和身份证明发送邮件到support@aicoin.com,本平台相关工作人员将会进行核查。


