1. Recent Trend Analysis
1. Downward Trend and Consolidation
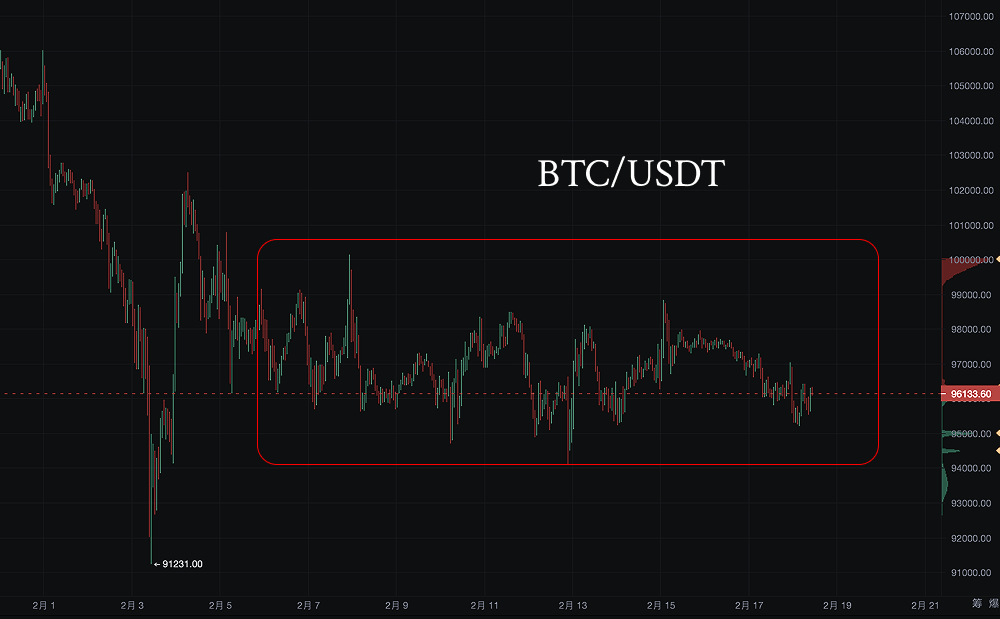
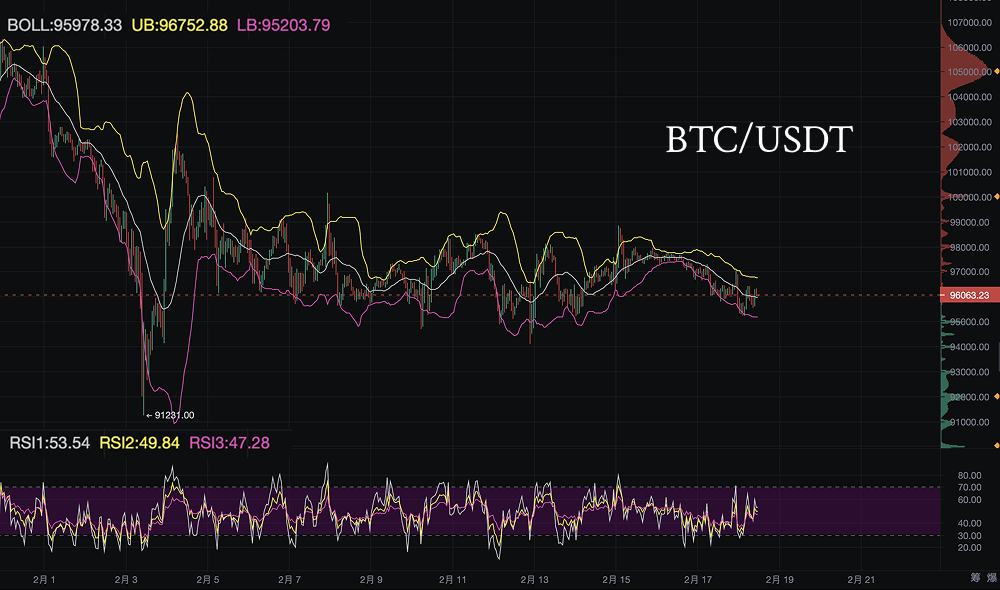
- Since the price of 106,457.44, it has shown an overall downward trend, forming a phase low around 91,231.00.
- The recent trend has been fluctuating around 96,000 - 97,500, forming a horizontal consolidation with relatively low volatility, possibly indicating that the market has entered a short-term equilibrium state.
2. Key Support and Resistance Levels
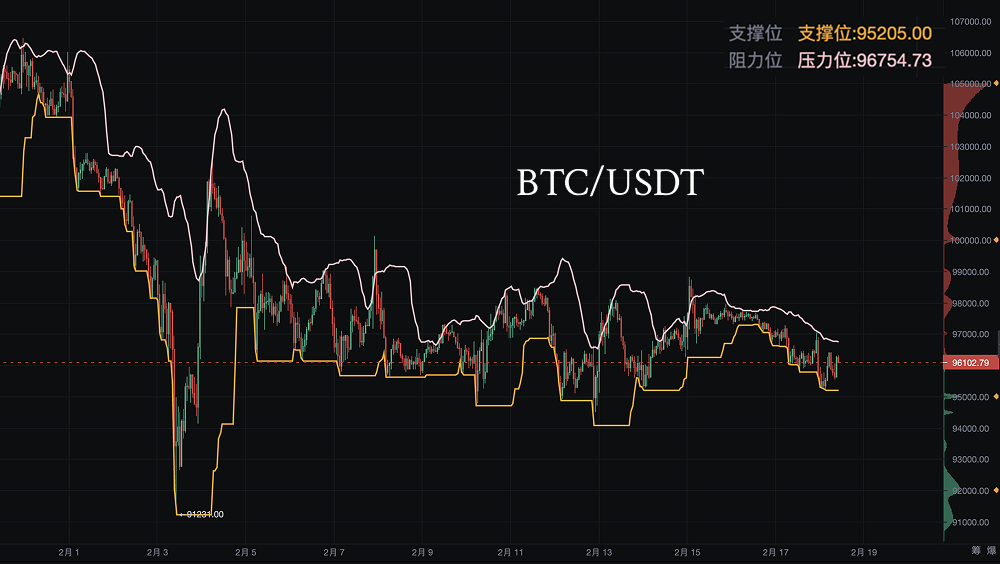
- Support Levels: 91,200 (previous low support), 95,000 (recent lower boundary of fluctuation)
- Resistance Levels: 98,500 (upper boundary of fluctuation), 100,000 (psychological level)
- If the price falls below 95,000, it may further test the support around 91,200, or even accelerate the decline.
- If the price breaks above 98,500, it may attempt to return to 100,000, or even further test 104,000.
3. K-Line Pattern Signals
- Recent K-line patterns show many upper and lower shadows with small bodies, indicating intense competition between bulls and bears, with no clear direction.
- Currently, there are no obvious bottom reversal patterns (such as Morning Star, Head and Shoulders Bottom), so rebound signals are still insufficient.
- If a strong bullish candle appears around 95,000, it may form a short-term rebound, but if the trading volume is insufficient, it may continue to fluctuate or decline.
2. Today's and Future Trend Predictions
Based on pattern analysis and trend judgment, the following trend predictions can be made:
1. Short-term (Today - 3 days)
- Since the 95,000-97,500 range is the recent fluctuation range, it is expected that Bitcoin may fluctuate between 95,500 - 97,500 today.
- If it can effectively break above 98,500, it may further test 100,000, but if it falls below 95,000, it may trend towards 91,200.
- If trading volume increases and breaks through a key range, it may form a trend breakout, leading to greater volatility.
2. Mid-term (Next 1-2 weeks)
- If Bitcoin can stabilize above 97,500 and break through 100,000, it may initiate a phase rebound, targeting 104,000.
- However, if market sentiment is low and trading volume shrinks, it may fluctuate between 95,000 - 100,000, or even decline further.
- Key signals: Pay attention to whether there is a strong bullish candle breaking through key resistance levels or breaking below key support levels with increased volume.
3. Long-term (1 month)
- If Bitcoin falls below 91,200, the support below will retest lower areas, potentially entering a longer-term bear market.
- If it can stabilize above 100,000, there is a chance to restore the upward trend and attempt to challenge the 106,000-110,000 range.
3. Strategy Recommendations
In a horizontal trend, stable profit strategies are usually based on principles such as buying low and selling high, grid trading, and trend breakouts. Here are several stable profit strategies suitable for a sideways market:
1. Range Trading Strategy (Buy Low, Sell High)
Applicable Market: Fluctuating consolidation, prices oscillating within a certain range (e.g., 95,000~98,500)
Determine Key Support and Resistance (Range Definition)
Chip Distribution Analysis
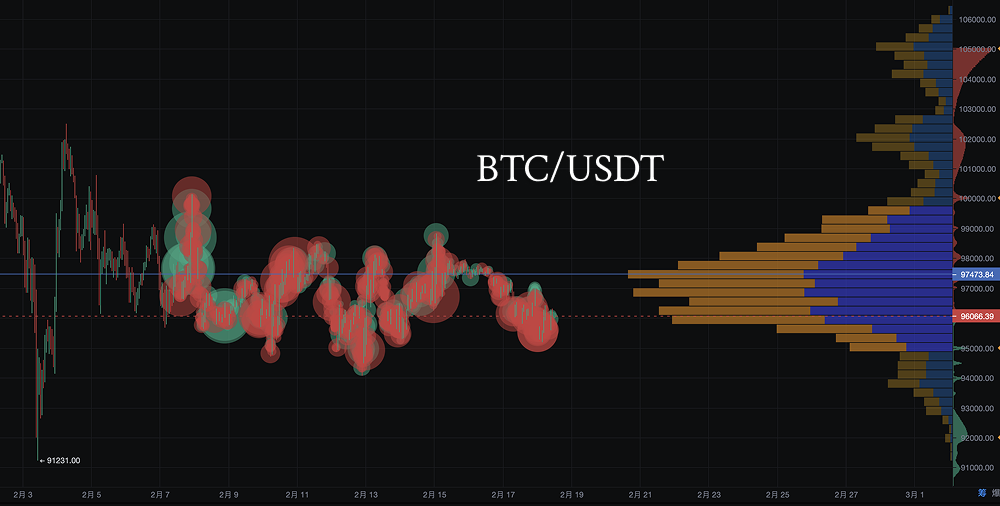
- The chip distribution on the right side of your chart (Volume Profile) shows the trading density at different price ranges: 97,000-98,500 (blue dense area) → indicates that this is a recent active trading area, possibly a resistance level.
- 95,000-96,000 (orange dense area) → indicates that there are many chips here, possibly a support level.
Large Transactions (Red and Green Dots) Analysis
- Large red sell orders are mainly concentrated in the 97,000-98,000 range, indicating that this area may be a short-term pressure zone, which can be used as a selling area.
- Large green buy orders are in the 95,000-96,000 range, indicating that there is institutional or large fund support here, possibly a short-term buying area.
Conclusion: Range trading can buy low around 95,000-96,000 and sell high around 97,000-98,500.
Trade Execution: Buy Low, Sell High
Buying Timing:
- When the price falls to 95,000-96,000 and stabilizes under large buy order support (observe K-line stop-loss signals, such as long lower shadows).
- Increased trading volume indicates funds are entering.
Selling Timing:
- When the price rises to 97,000-98,500 and there is a concentration of large sell orders, K-line shows upper shadows or signs of volume stagnation.
Stop-Loss Strategy:
- If it falls below 94,500, it indicates that support has failed, and a stop-loss sell should be executed.
- If it breaks above 99,000, it indicates that the market may turn to an upward trend, consider taking profits or following the breakout trend.
Advantages: Simple and easy to implement, suitable for low-volatility markets.
Risks: If the market breaks out of the range, it may lead to stop-losses.
2. Grid Trading Strategy
Applicable Market: Long-term fluctuations, prices oscillating around a range.
Core Logic: Set buy and sell orders at fixed intervals to automate low buying and high selling.
Execution Steps:
- Define the range: Assume the current price is fluctuating between 95,000~98,500.
- Set the grid: Place a set of buy and sell orders every 500 dollars, for example: Buy orders: 95,500 / 96,000 / 96,500 … Sell orders: 97,500 / 98,000 / 98,500 …
- Automatic Execution: Each time the price drops to the buy order range, the system automatically buys; each time it rises to the sell order range, the system automatically sells.
Advantages: Automated trading, no need to predict market direction.
Risks: If the market breaks out of the range and enters a one-sided trend, it may lead to some positions being deeply trapped.
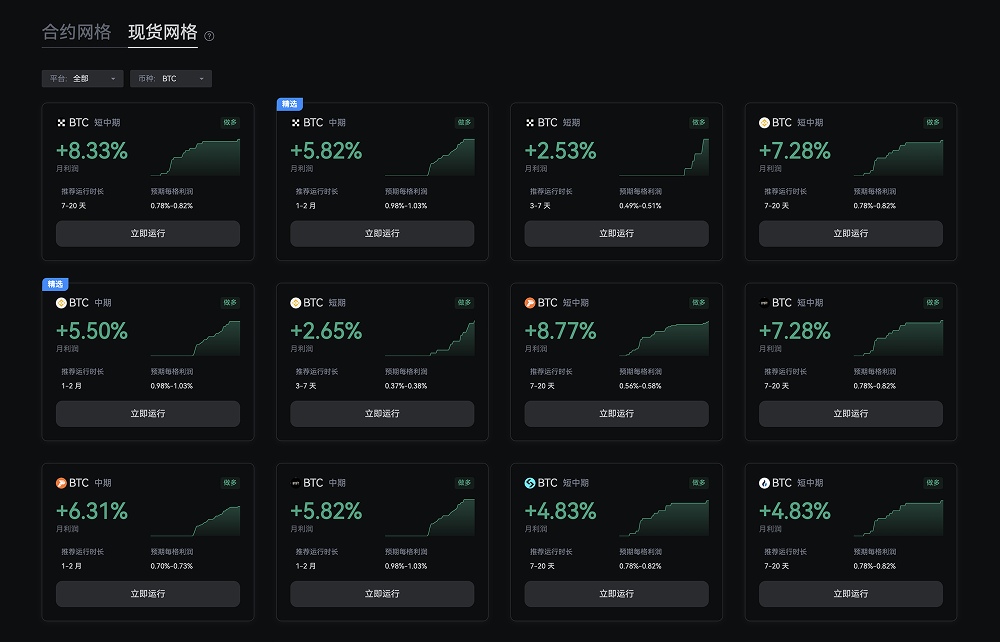
Recommended Trading Tool: AiCoin AI Grid Trading
3. Mean Reversion Strategy
Applicable Market: Prices oscillating around moving averages, Bollinger Bands converging.
Core Logic: Prices oscillate near the mean and will revert when deviating from the mean.
Execution Steps:
- Use Bollinger Bands: If the price touches the lower band (e.g., 95,000), consider buying. If the price touches the upper band (e.g., 98,500), consider selling.
- Combine with RSI Indicator: RSI < 30: Oversold signal, buy; RSI > 70: Overbought signal, sell.
Advantages: Follows market rules, suitable for fluctuating markets.
Risks: If the market enters a one-sided trend, mean reversion may fail.
4. Risk Warning
- Market sentiment and policy have a significant impact; Bitcoin is strongly influenced by global market and regulatory dynamics.
- Short-term volatility is high; it is recommended to reasonably control positions and strictly implement stop-loss and take-profit strategies.
- Monitor trading volume; if volume continues to be low, the sustainability of breakouts may be poor.
Bitcoin is currently in a phase of consolidation, and the direction is still unclear. In the short term, pay attention to the breakout situation of the key range of 95,000-98,500, which will determine the next trend. If there is a volume increase, a rebound is expected; if support is broken, it may continue to decline. It is recommended to combine trading decisions with trading volume, market sentiment, and key technical levels.
Disclaimer: The above content does not constitute investment advice.
AiCoin Official Website: www.aicoin.com
Telegram: t.me/aicoincn
Twitter: x.com/AiCoinzh
Email: support@aicoin.com
Group Chat: Customer Service Yingying, Customer Service KK
免责声明:本文章仅代表作者个人观点,不代表本平台的立场和观点。本文章仅供信息分享,不构成对任何人的任何投资建议。用户与作者之间的任何争议,与本平台无关。如网页中刊载的文章或图片涉及侵权,请提供相关的权利证明和身份证明发送邮件到support@aicoin.com,本平台相关工作人员将会进行核查。


