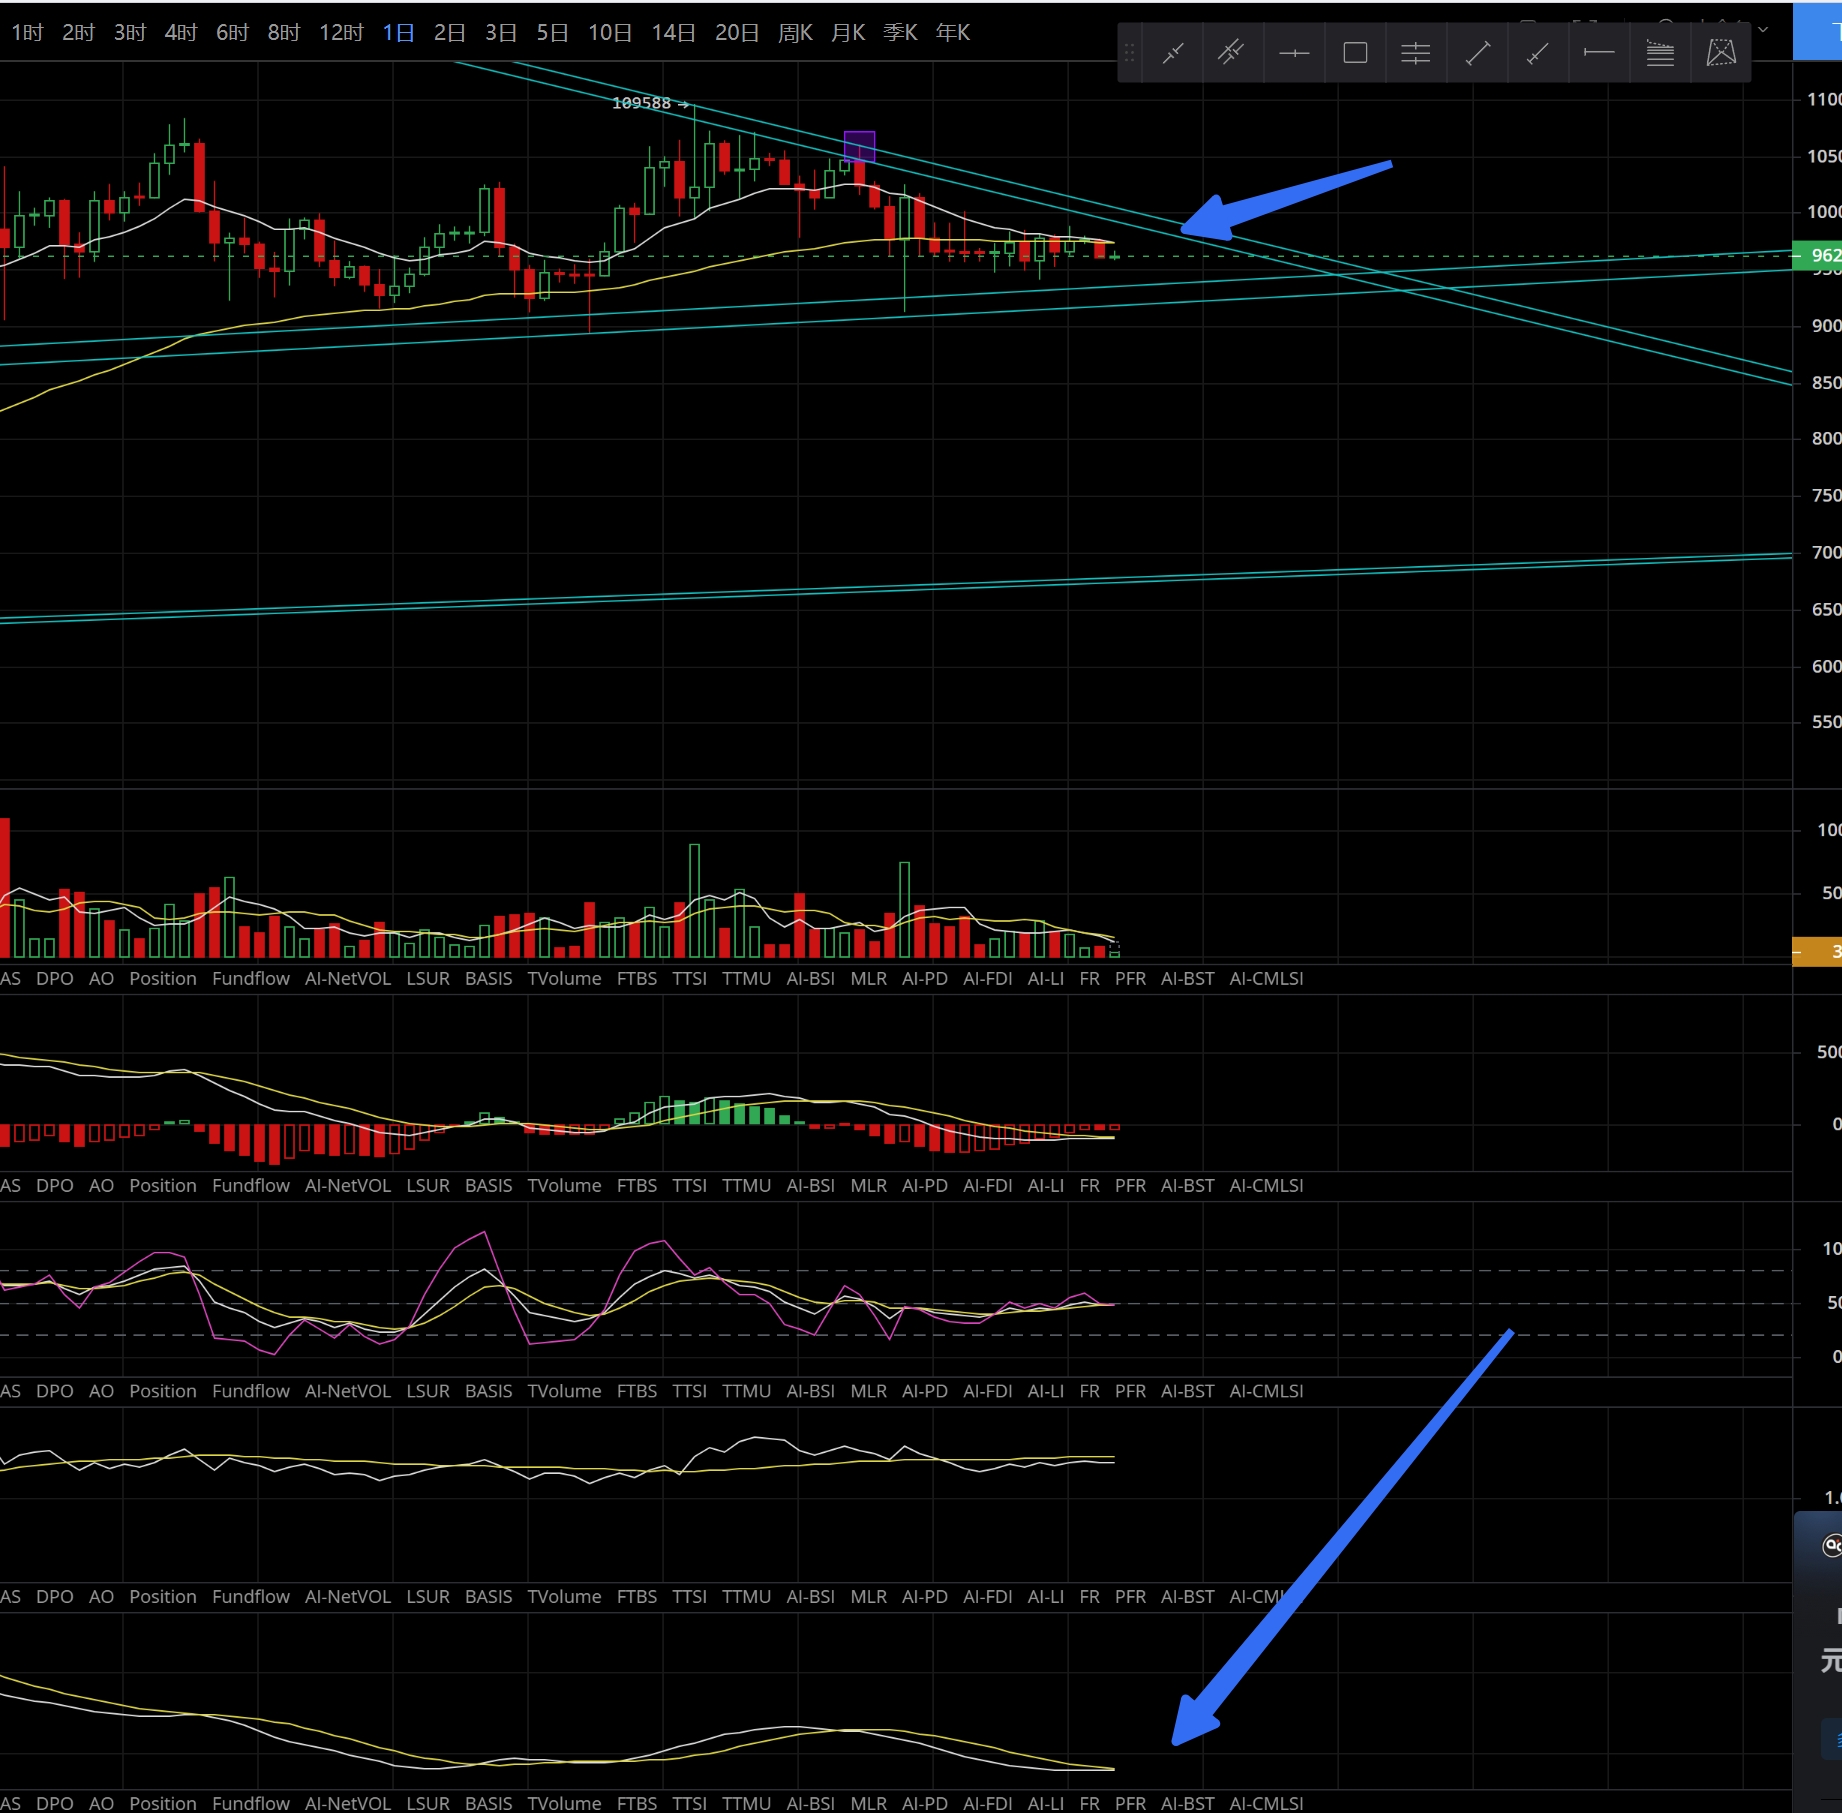
Today, BTC has changed its weekly chart. The MACD has formed a death cross on the weekly chart. Since this is at the weekly level, it is likely to take some time. The energy bars on the weekly chart are not very large, so the bearish energy is not too heavy. On the daily chart, bearish energy is still being released, but it is also not heavy. However, we need to pay attention to the 9750 position on the daily chart; it must stay above this level in the coming days. Otherwise, there will be a death cross on the larger moving averages, which would add another layer of resistance if formed on the daily chart. The comforting thing is that if the TRIX indicator on the daily chart forms a golden cross, the daily chart will have a slight upward fluctuation, creating a larger level of fluctuation to release the bearish energy.
On the ETH weekly chart, the bearish sentiment is still relatively strong, but the daily chart shows a weak bullish trend. Currently, the MACD double lines are quite far from the zero axis, so the strength is relatively small. It is still fluctuating within this range and must break through 2930 to continue moving upward.
For BTC, the short-term resistance is at 98500-99300-100500, with support at 94500-92500. For ETH, the support levels are at 2620-2570-2450, and resistance is at 2790-2860-3050-3250.
免责声明:本文章仅代表作者个人观点,不代表本平台的立场和观点。本文章仅供信息分享,不构成对任何人的任何投资建议。用户与作者之间的任何争议,与本平台无关。如网页中刊载的文章或图片涉及侵权,请提供相关的权利证明和身份证明发送邮件到support@aicoin.com,本平台相关工作人员将会进行核查。


