
Bitcoin weekly candlestick shows a doji, continuing the narrow fluctuations on the right side of the pin bar from the 3rd. My perspective has always been to look for a rebound after a second test of the pin bar before continuing to decline, but the market is consolidating instead of falling. Ethereum's situation isn't much better; after a significant pin bar, we can only wait for a second test rebound to gain more strength. Currently, we are watching if BOLL can break through.
Next week, volatility may increase as the US dollar index rebounds to 110, facing pressure to drop back to around 106, re-entering the consolidation range it has been in for two years. As mentioned before, "when a whale falls, everything thrives," so we will see if this provides some opportunities, but it's important to note that the US dollar index has not completely weakened.
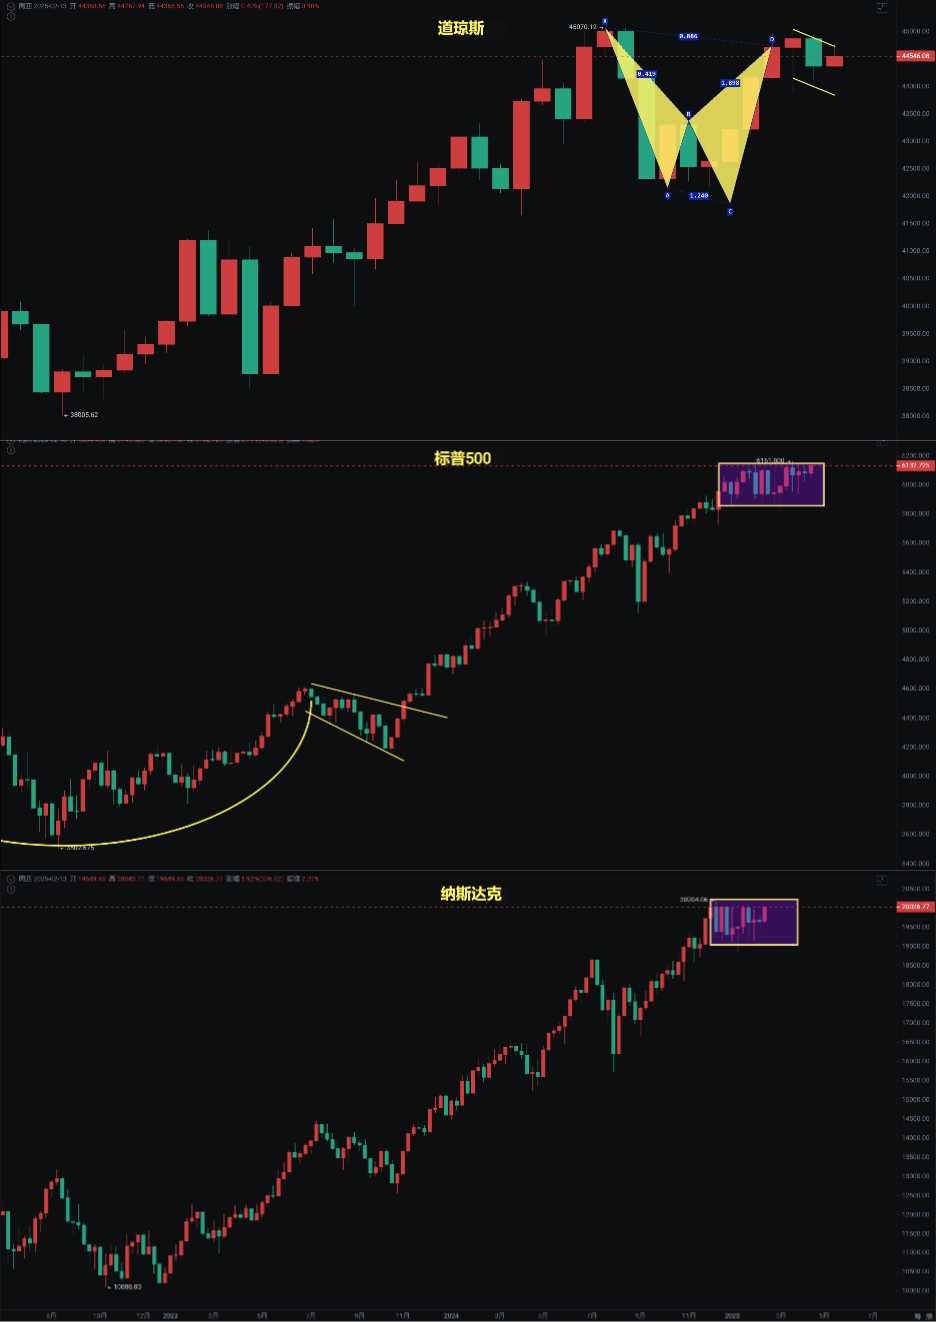
The three major US stock indices are about to face a turning point. The Dow Jones is forming a shark pattern at 0.886, followed by a descending channel, with a higher probability of breaking upwards. The Nasdaq and S&P 500 are also on the verge of a breakout at the weekly level. Bitcoin, being a major tech stock in the US market, is significantly influenced by them.
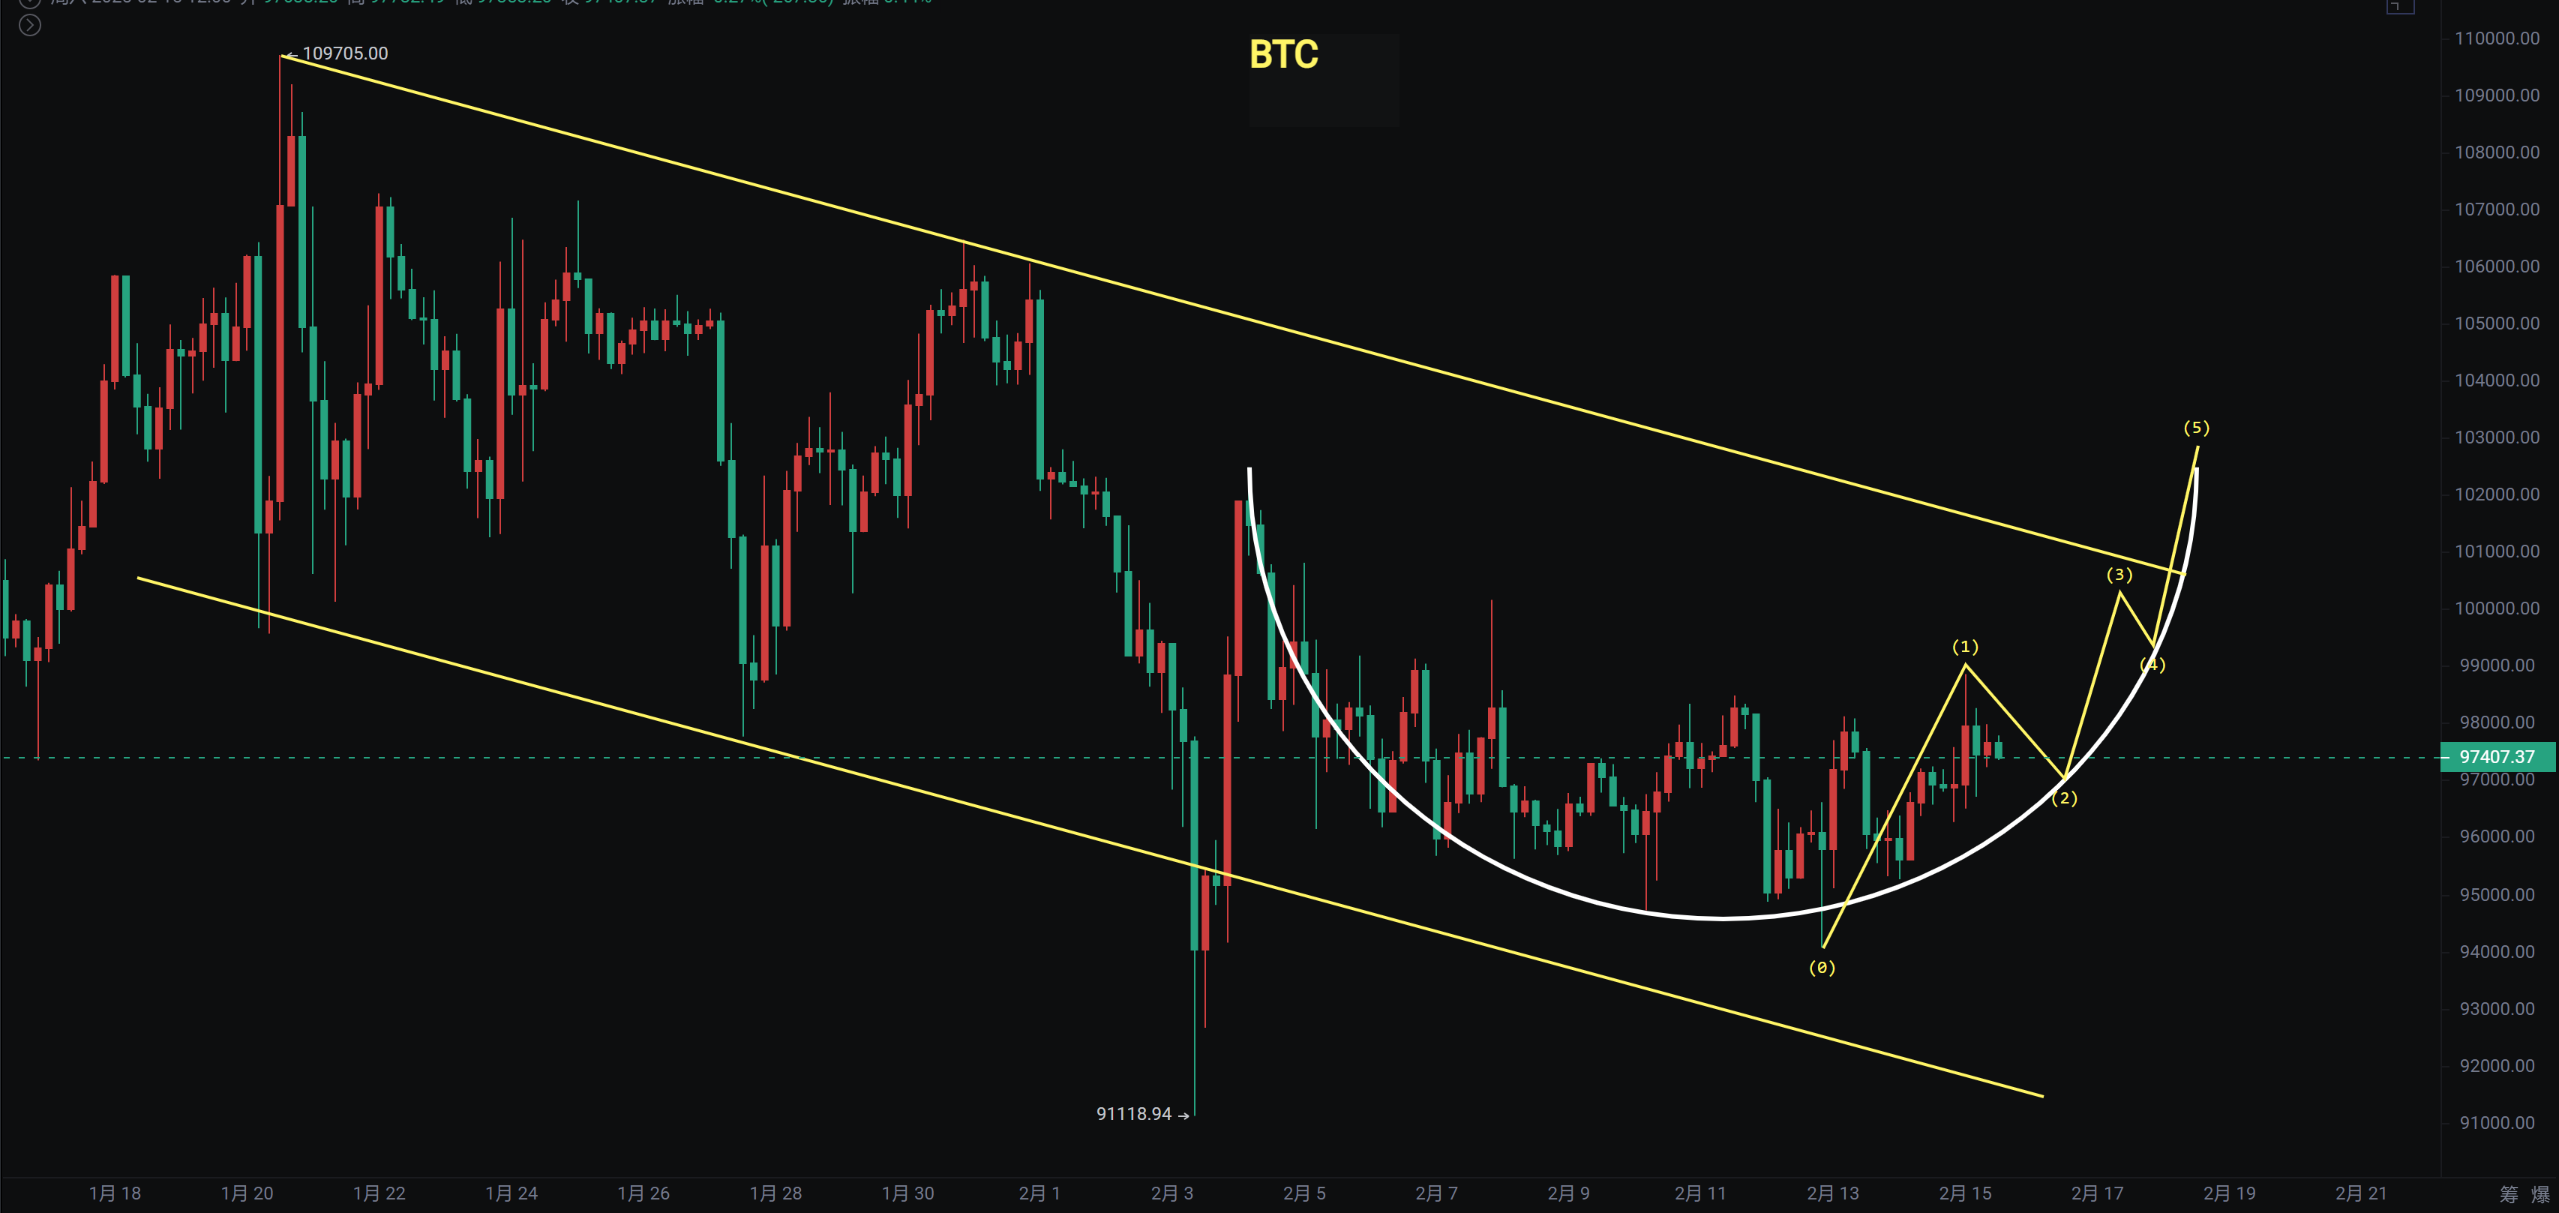
Bitcoin
Bitcoin has been in a continuous 12-day fluctuation around 95000—98400 on the daily chart. The weekly doji shows the MACD fast and slow lines crossing at the zero axis. This situation is similar to the rebound after falling to 57000 early last year, close to the BOLL middle track, so we cannot rule out Bitcoin fluctuating between 90,000 and 110,000. If it breaks below 90,000 and goes to 85,000—76,000, it would still be an opportunity for bulls to enter. Looking at the monthly chart, after nearly 3 months of consolidation, these movements do not create new highs and significantly widen the gap, indicating a probability of a pullback pin bar in the first half of the year.
On the 4-hour level, after the pin bar on the 3rd, it is moving down in wave B. If it does not break 94,000, we can expect a rebound with resistance above at 100,000—102,456, even 104,000. The only uncertainty now is whether there will be another downward pin bar.
Support: Resistance:
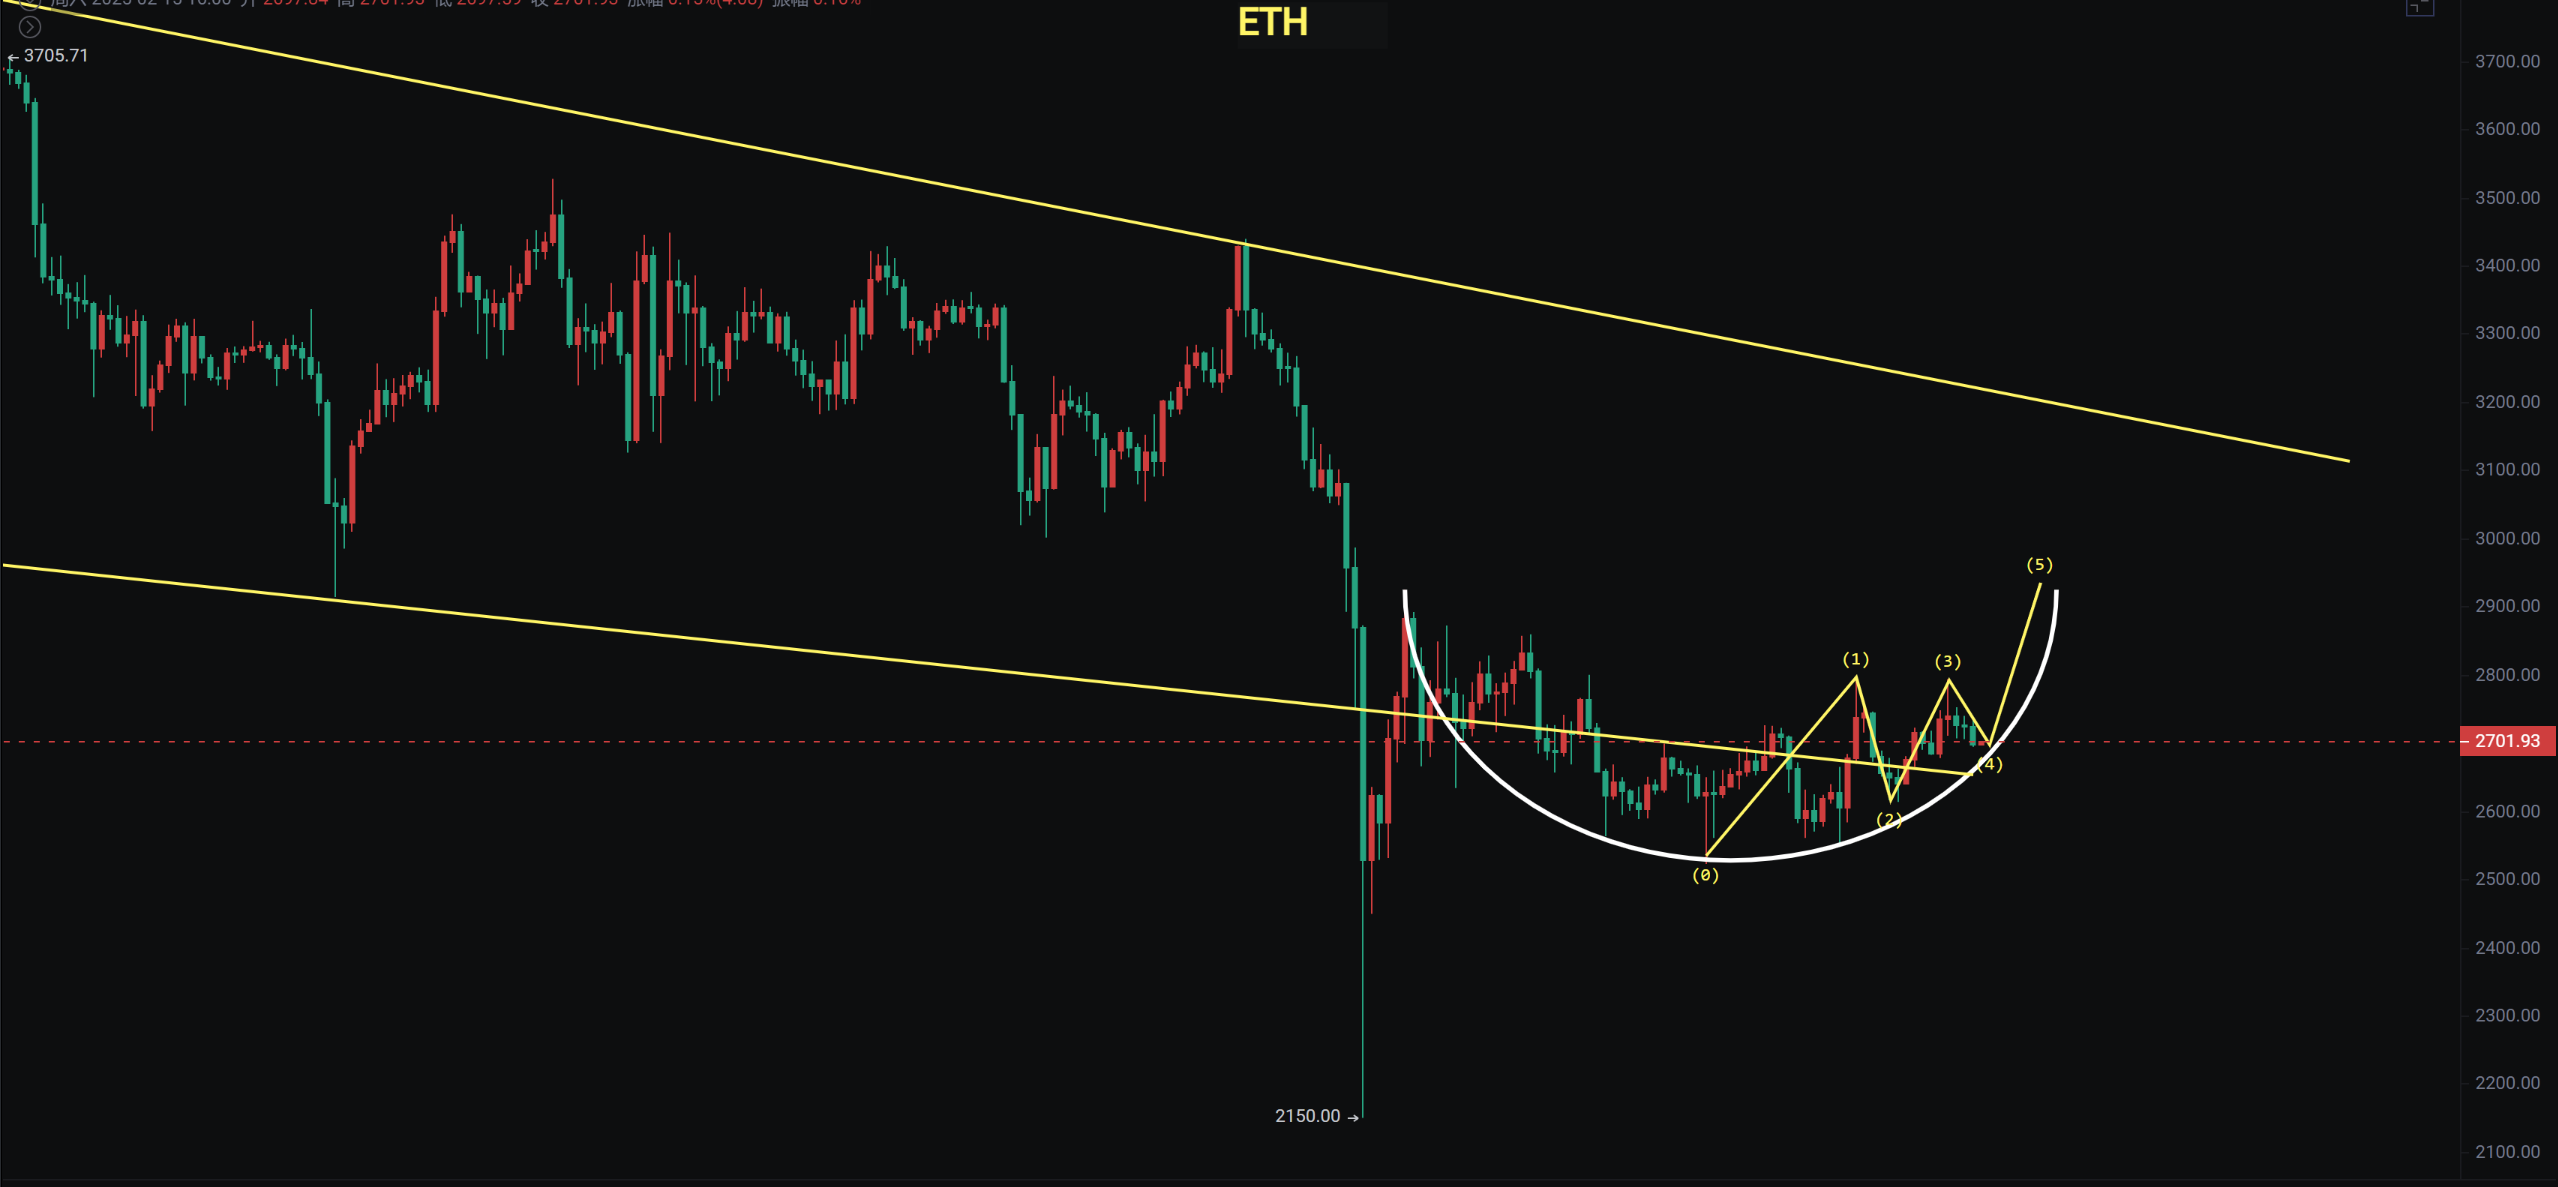
Ethereum
The weekly pin bar shows a weak rebound, and if the rebound cannot reclaim above 2920, it will continue to decline. There are two scenarios: if the rebound cannot reclaim 2900—3100, it will continue to decline; the second scenario has a possibility of a direct drop, but we will first observe the strength of the rebound.
On the 4-hour chart, there is support at 2520, and since the support is moving up, we can expect a short-term rebound strength to 2920—3100.
Support: Resistance:
Altcoins
First, let's look at some varieties that are strongly rebounding from oversold conditions.
LTC: The weekly chart maintains a box consolidation, looking to buy at the bottom or break out.
ZEN: The daily downtrend line has broken, and the weekly chart is testing the BOLL middle track. A short-term pullback near 14 is still a good opportunity to add positions.
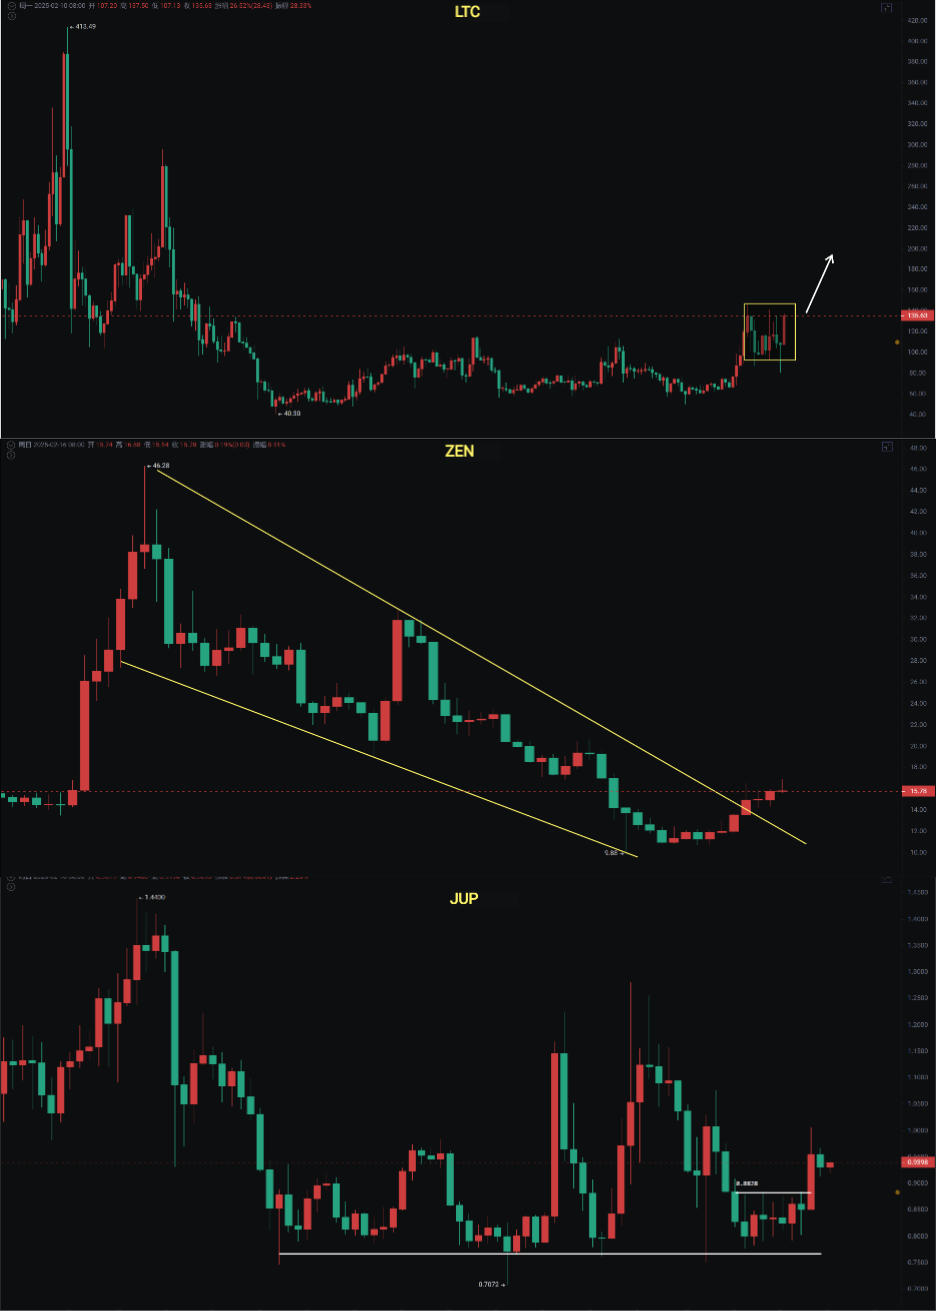
JUP: It has a relatively small decline with daily bottom support. On the 4-hour chart, if it breaks and retests around 0.91 without breaking, it is a good opportunity to add positions.
If you like my views, please like, comment, and share. Let's navigate through the bull and bear markets together!!!
This article is time-sensitive and for reference only, updated in real-time.
Focusing on K-line technical research, sharing global investment opportunities. Public account: Trading Prince Fusu

免责声明:本文章仅代表作者个人观点,不代表本平台的立场和观点。本文章仅供信息分享,不构成对任何人的任何投资建议。用户与作者之间的任何争议,与本平台无关。如网页中刊载的文章或图片涉及侵权,请提供相关的权利证明和身份证明发送邮件到support@aicoin.com,本平台相关工作人员将会进行核查。


