The cryptocurrency market briefly fell into panic on the night of the 12th due to the U.S. stock market's January Consumer Price Index (CPI) exceeding expectations. Data showed that the CPI increased by 0.5% month-on-month, marking the largest single-month increase in nearly two years, deepening concerns about the Federal Reserve potentially delaying interest rate cuts. However, as the market calmed and digested the data, investor panic began to subside, with the realization that more economic indicators are needed to confirm inflation trends.
Regarding Bitcoin, influenced by the CPI data, Bitcoin briefly dropped to $94,000 but quickly recovered, breaking through $98,000 at 6:30 AM today, reaching a high of $98,120, rebounding 4.29% from the evening low, and recovering 2.3% over the past 24 hours.
Bitcoin 4-Hour Chart
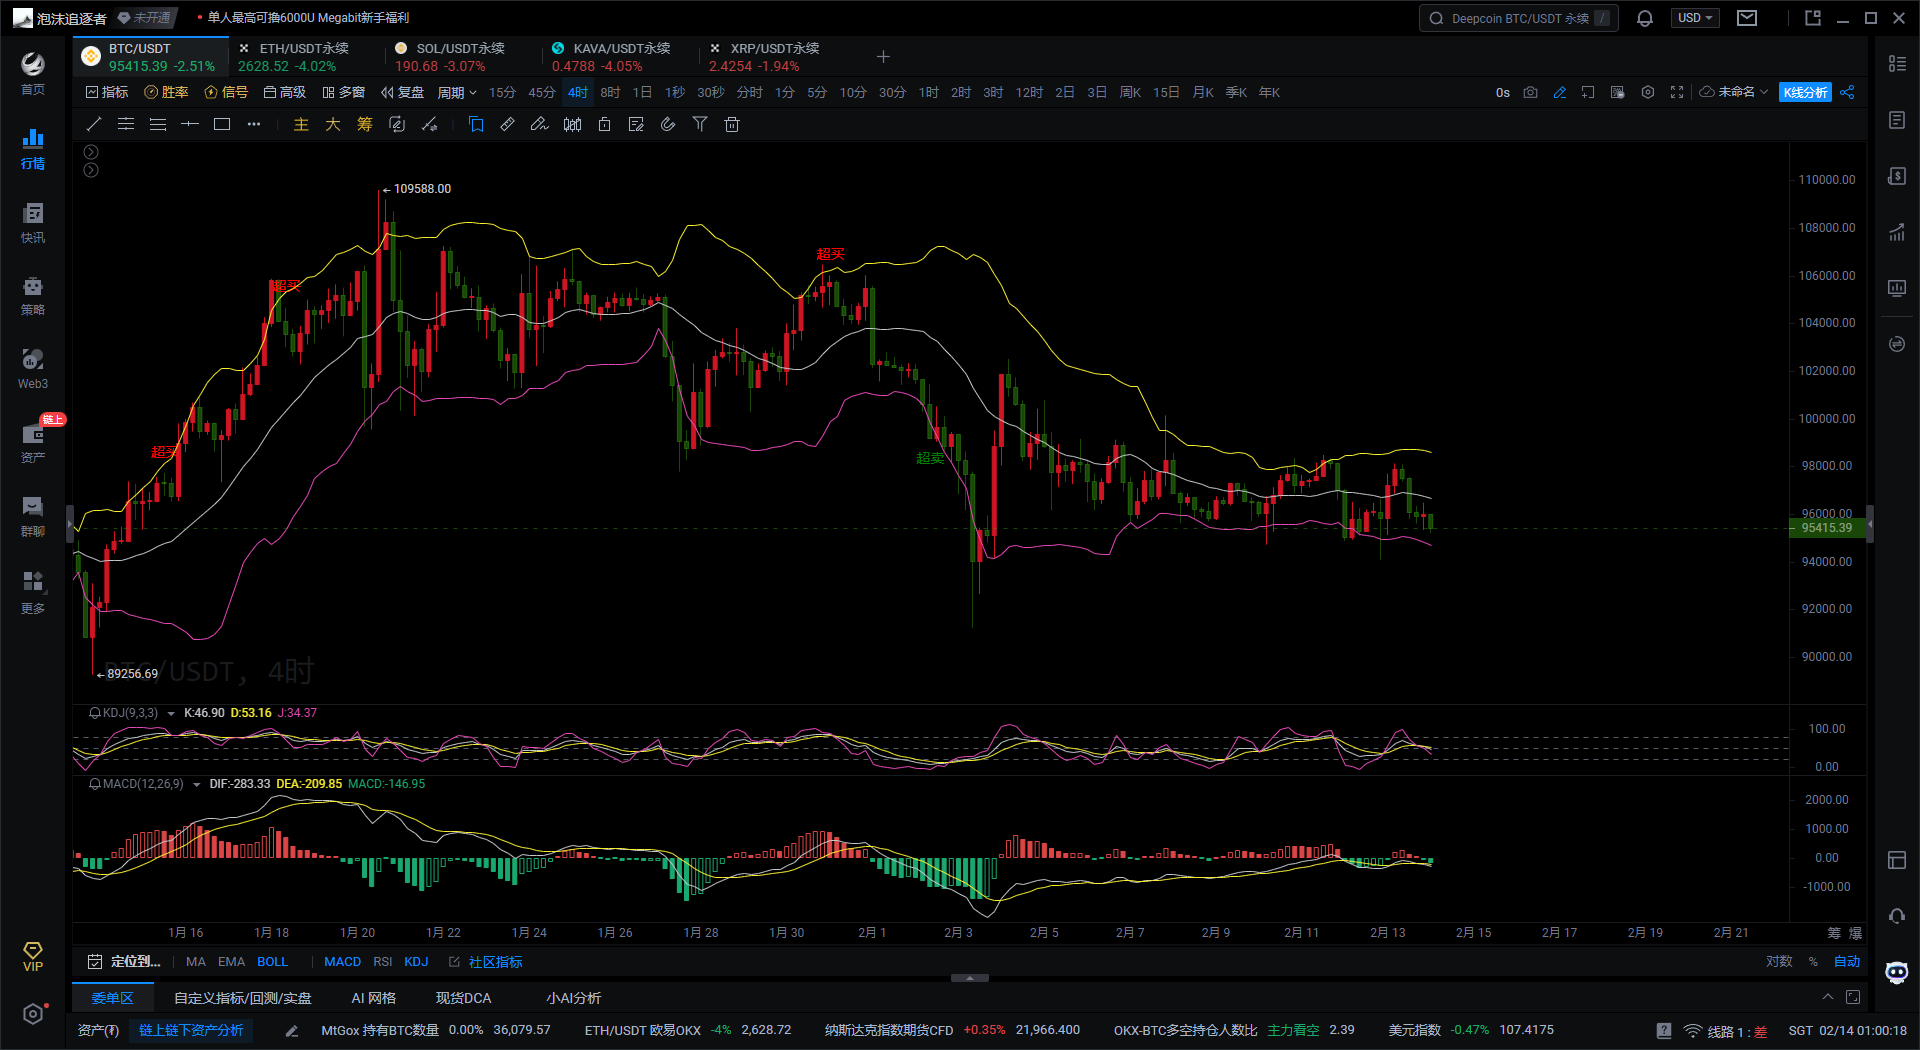
First, according to the Bollinger Bands indicator on the 4H Bitcoin chart, the current price is oscillating near the middle band and close to the lower band, indicating that the price may break downwards in the short term. If the price further breaks below the lower band, a downward trend may occur; if the price rebounds back above the middle band, attention should be paid to a potential market reversal.
Second, based on the KDJ indicator on the 4H Bitcoin chart, both the K-line and D-line values are at relatively low levels, with a downward crossover occurring, suggesting a possibility of continued decline in the short term. Additionally, the J-line value is below the 50 level, indicating that the current market is in a strong downward trend. However, there is also a possibility of overselling, and a rebound opportunity still exists in the short term.
Finally, according to the MACD indicator on the 4H Bitcoin chart, both the DIF line and DEA line are below the zero axis and remain in a downward state, indicating strong bearish forces in the market. At the same time, the MACD green histogram is gradually shortening, showing signs of a certain weakening of bearish strength. If the DIF line and DEA line move upward and break through the zero axis, it may signal a market reversal.
Bitcoin 1-Hour Chart
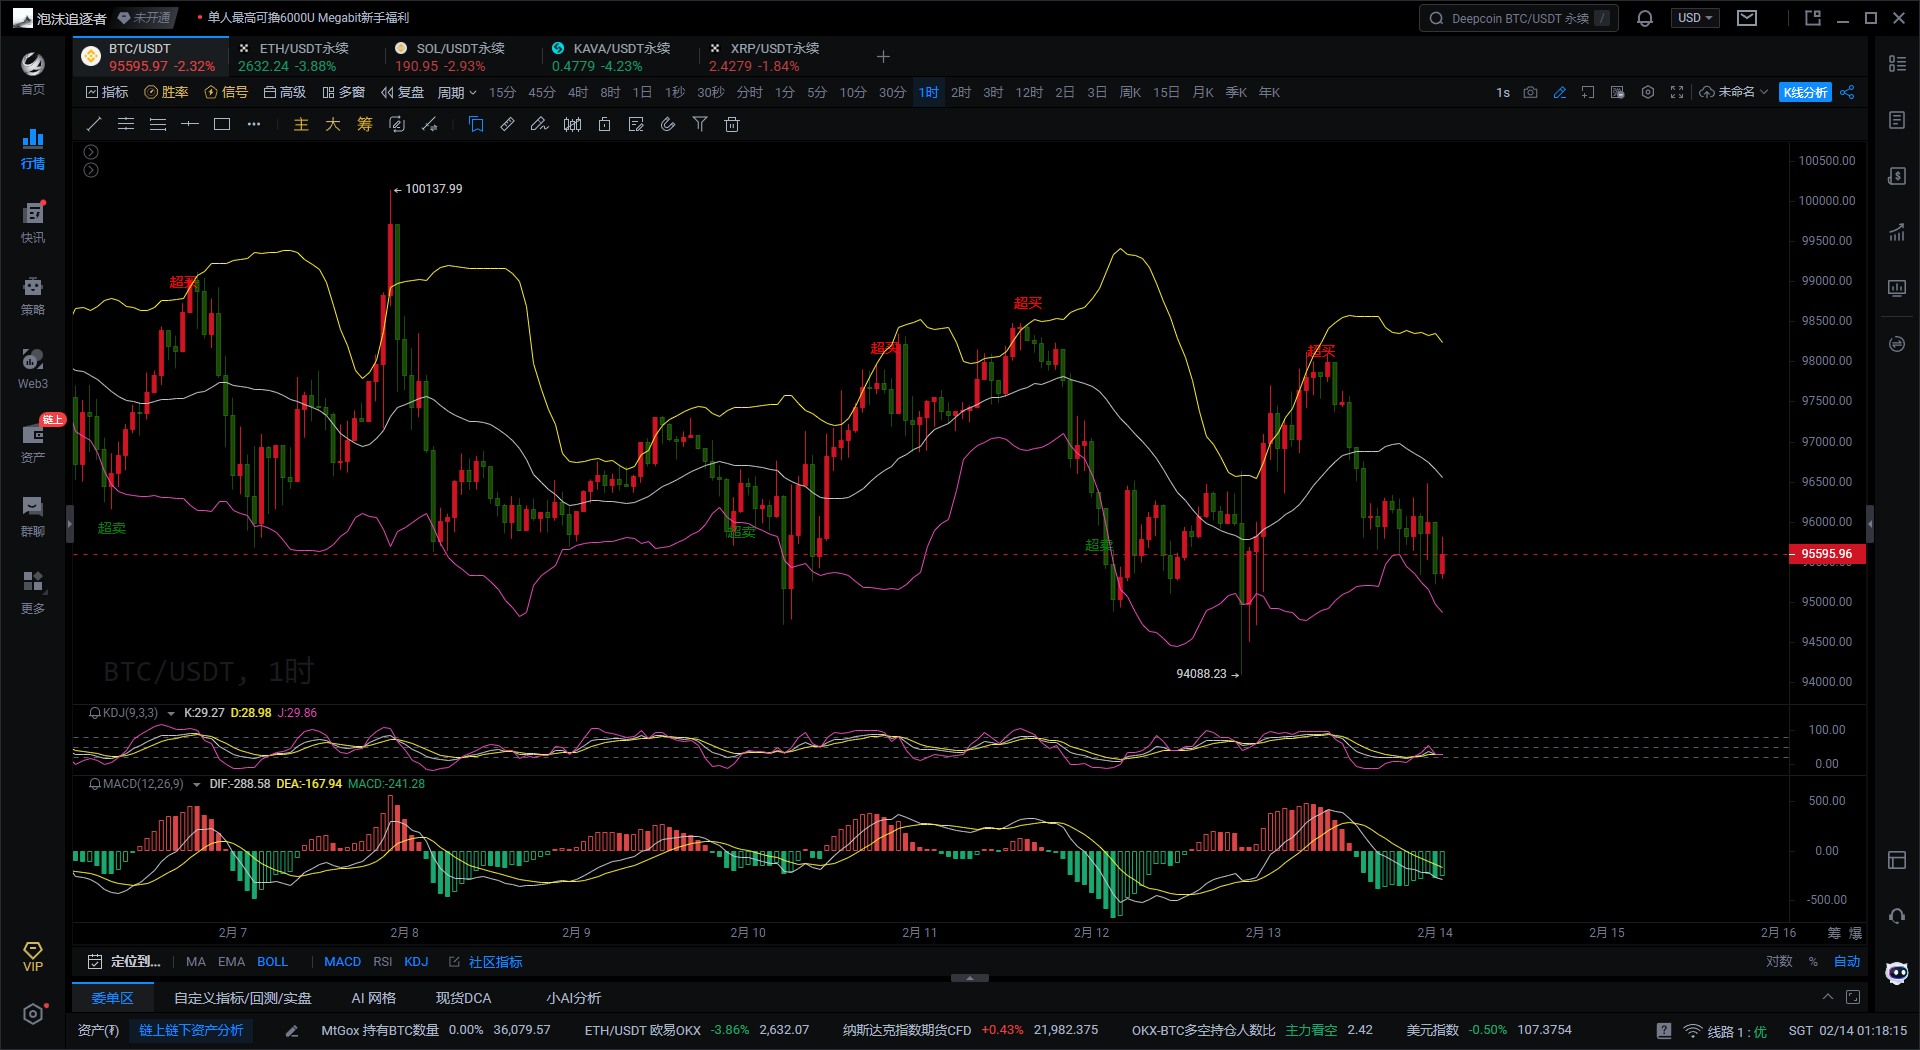
First, according to the Bollinger Bands indicator on the 1H Bitcoin chart, the price has just rebounded from the lower band but is still below the middle band, indicating that the market remains weak in the short term. The middle and upper bands of the Bollinger Bands form resistance; if the price cannot break through the middle band, it may continue to oscillate downwards. There were signs of a rebound near the lower band, and if the price continues to test the lower band without breaking it, it may form short-term support.
Second, based on the KDJ indicator on the 1H Bitcoin chart, the K-line and D-line values are at low levels, indicating that the market is currently in an overbought state, with a possibility of a rebound. The J-line value has also risen; if the KDJ three-line values cross upward to form a golden cross signal, the probability of a short-term increase will significantly increase.
Finally, according to the MACD indicator on the 1H Bitcoin chart, the DIF line and DEA line are still operating below the zero axis, but the recent MACD green histogram is gradually shortening, indicating that bearish momentum is weakening. If the DIF line and DEA line cross upward to form a golden cross signal, a rebound trend will begin in the short term. If a death cross signal forms again, it may continue the downward trend.
In summary, the market is currently in a state of oscillation and consolidation, with prices oscillating near the middle band of the Bollinger Bands. The MACD shows strong bearish momentum, but the KDJ indicates signs of a short-term rebound. If the price breaks below the lower band, it may continue to decline. If the price breaks above the upper band or the MACD begins to rise, it may turn into an upward trend.
Based on the above analysis, the following suggestions are provided for reference:
Short Bitcoin lightly around $96,000, add to the short position at $96,300-$96,500, targeting $94,500-$95,000, with a stop loss at $96,800.
Instead of giving you a 100% accurate suggestion, I prefer to provide you with the right mindset and trend. After all, teaching someone to fish is better than giving them fish; the goal is to learn to earn for a lifetime! The focus is on the mindset, grasping the trend, and planning the market layout and position. What I can do is use my practical experience to help you make investment decisions and manage operations in the right direction.
Written on: (2025-02-14, 01:10)

(Written by - Master Says Coin) Disclaimer: Online publication may have delays; the above suggestions are for reference only. The author is dedicated to research and analysis in the investment fields of Bitcoin, Ethereum, altcoins, forex, stocks, etc., with years of experience in the financial market and rich practical operation experience. Investment carries risks; please proceed with caution.
免责声明:本文章仅代表作者个人观点,不代表本平台的立场和观点。本文章仅供信息分享,不构成对任何人的任何投资建议。用户与作者之间的任何争议,与本平台无关。如网页中刊载的文章或图片涉及侵权,请提供相关的权利证明和身份证明发送邮件到support@aicoin.com,本平台相关工作人员将会进行核查。