Original Author: 1912212.eth, Foresight News
Since the market dropped from its peak in December 2024, it has been fluctuating for several months, with many players suffering heavy losses amid the endless downtrend and volatile market conditions. The market noise has also seen severe divergence between bulls and bears. The macro environment is unstable, with Trump waving the tariff stick, the Federal Reserve's interest rate cuts still far off, market liquidity tightening, and pessimistic sentiment spreading in the community.
So, what is the progress of the cryptocurrency market? If Bitcoin still has room for further upward movement, is now a phase of the market's bottom range?
- Fear Index Below 40 Since February This Year
The CMC Fear and Greed Index is used on CoinMarketCap to measure the overall sentiment of the cryptocurrency market. The index ranges from 0 to 100, with lower values indicating extreme fear in the market and higher values indicating extreme greed. This index can help investors understand the emotional state of the market, thereby planning their buy and sell decisions. Additionally, it provides reference information on whether the market is undervalued (extreme fear) or overvalued (extreme greed).
As shown in the chart, from July to early October 2024, the market saw the fear index drop below 40 multiple times (fear), followed by a FOMO sentiment in November of that year, where the index briefly exceeded 80, and then the market experienced a pullback. Currently, the fear index has once again dropped below 40 since early February this year.
When the fear index is low, it often indicates that the price of cryptocurrencies may be in a phase of bottom range.
- Bitcoin's 7-Day Average Funding Rate Down 85% Compared to Last December
The 7-day average funding rate of perpetual contracts can serve as an important indicator for observing market sentiment. When the market is booming, funding rates are often high, indicating the market's peak range. Conversely, low funding rates typically indicate the market's bottom range.
As shown in the chart, in March 2024, Bitcoin's 7-day average funding rate exceeded 0.06%, indicating that the market was willing to pay high costs to long positions, reflecting extreme FOMO sentiment, which became the highest point of Q1 that year. Between November and December 2024, the funding rate remained above 0.03%, and Bitcoin briefly broke the $100,000 mark. However, before the market took off, Bitcoin's 7-day average funding rate had once shown negative rates from May to October that year.
As of the time of writing, the funding rate has dropped to 0.004%, down 85% from the peak in December. Market sentiment is in a pessimistic state.
- ETH Profit Ratio Hits 4-Month Low
Ethereum's market cap has dropped 36% from its local peak seven weeks ago, leading to a sharp decrease in the number of profitable ETH. From daily closing data, the current ETH profit ratio has hit a new low in four months, and the number of profitable tokens has also fallen to a three-month low.
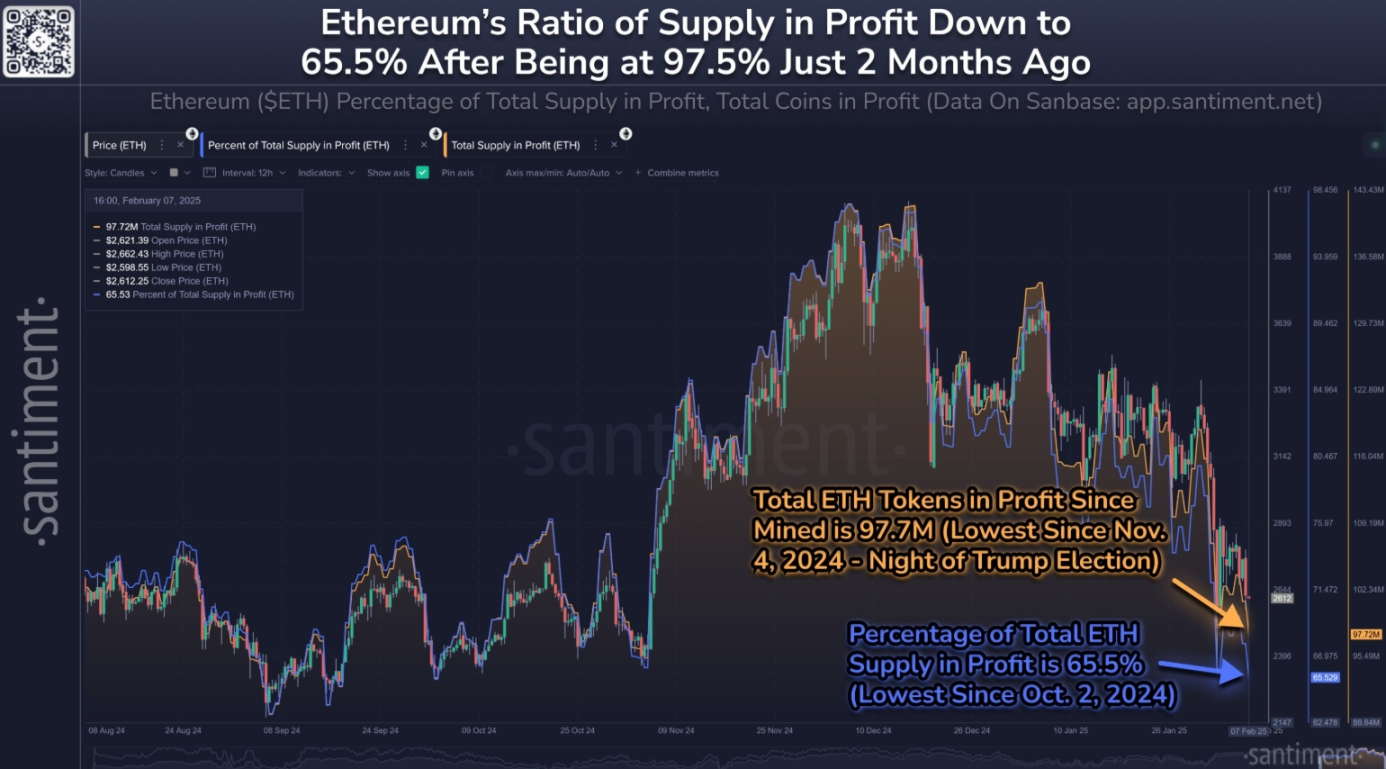
As the second-largest cryptocurrency by market cap, Ethereum has underperformed compared to other major coins, and market sentiment has significantly turned negative. Despite the current atmosphere filled with panic (FUD) and retail investors continuously selling off, once the crypto market stabilizes, Ethereum may see a rebound.
- Bitcoin Miners Surrender Again Since Early February This Year, Mining Difficulty Rises Instead of Falls
The surrender of Bitcoin miners is often seen as an important reference indicator for market bottoms. Miner surrender means that the profit from mining one Bitcoin is lower than the cost. Historical data shows that the time when Bitcoin miners surrender often coincides with the market's bottom range.
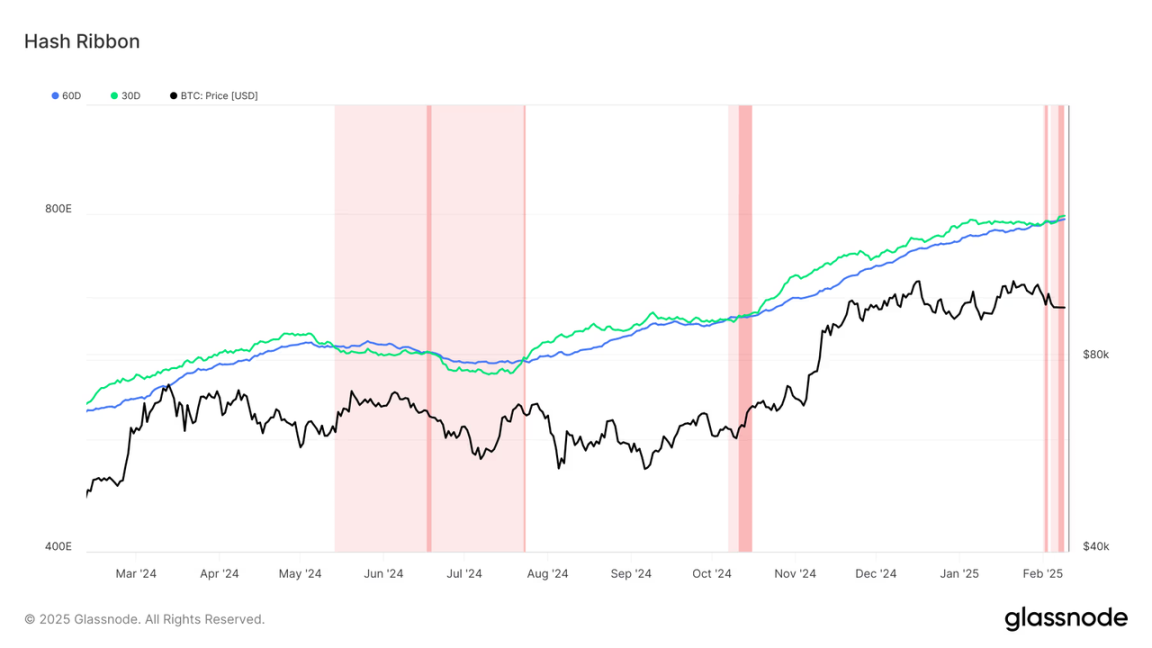
The chart shows that since 2024, Bitcoin miners have surrendered in June and October of this year. Since 2025, Bitcoin miners have begun to surrender for the first time since February.
At the same time, the difficulty of Bitcoin mining has recently reached a historical high of 114.7 T. New highs in difficulty usually indicate that miners still have confidence in Bitcoin's long-term value; otherwise, they would not continue to invest computing power. This may have a somewhat positive impact on market sentiment.
- Stablecoin Market Cap Increased Over the Past Month
Stablecoin data is one of the important reference data for observing market capital inflows. Over the past month, according to DefiLlama, the market cap of USDT increased by 3.4% ($4.676 billion), while USDC surged by 22.73% ($10.396 billion).
From January 1, 2025, the market cap of USDT has risen from $137.17 billion to the current $141.9 billion, an increase of $4.73 billion.
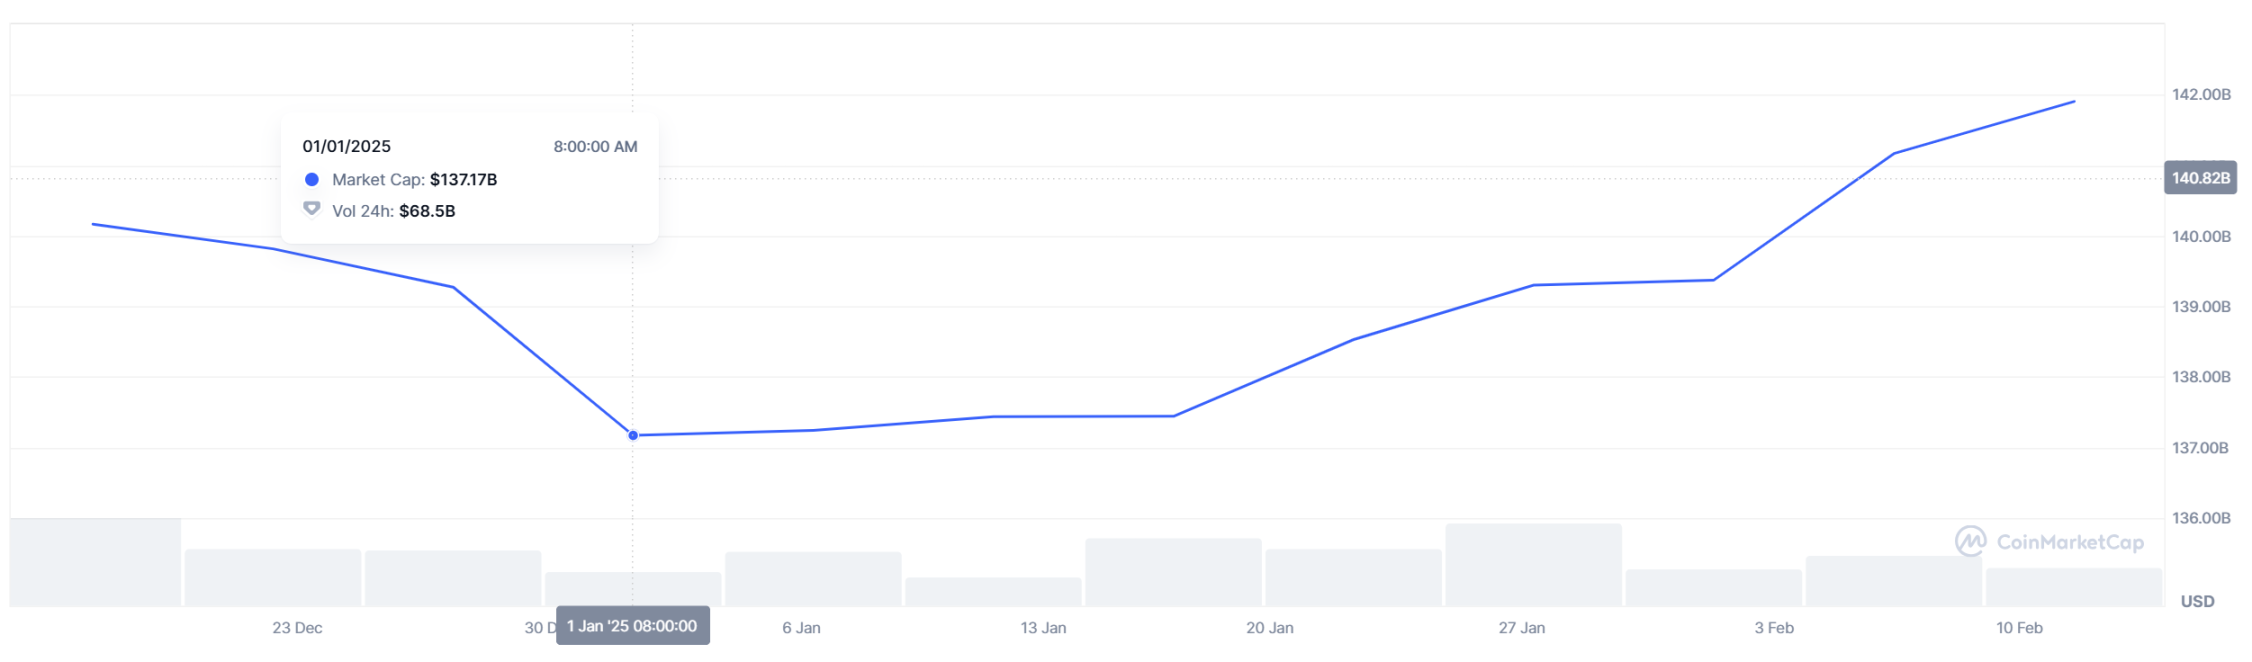
USDC data has increased from $43.77 billion to the current $56.28 billion.
Summary
The above five key data points may suggest that the market is possibly in a phase of bottom range. However, it is difficult to predict when the market will exit this bottom range. Investors should note that even if some tokens are currently in the bottom range, those lacking popularity, narrative, fundamentals, and facing continuous large unlocks may struggle to attract capital attention and could face further declines.
免责声明:本文章仅代表作者个人观点,不代表本平台的立场和观点。本文章仅供信息分享,不构成对任何人的任何投资建议。用户与作者之间的任何争议,与本平台无关。如网页中刊载的文章或图片涉及侵权,请提供相关的权利证明和身份证明发送邮件到support@aicoin.com,本平台相关工作人员将会进行核查。


