
Old Bao's remarks are slightly hawkish, and the Federal Reserve is unlikely to change its stance in the future, reiterating that there is no rush to adjust interest rates or to cut rates, focusing on bringing inflation down to 2%. Therefore, it is basically a foregone conclusion.
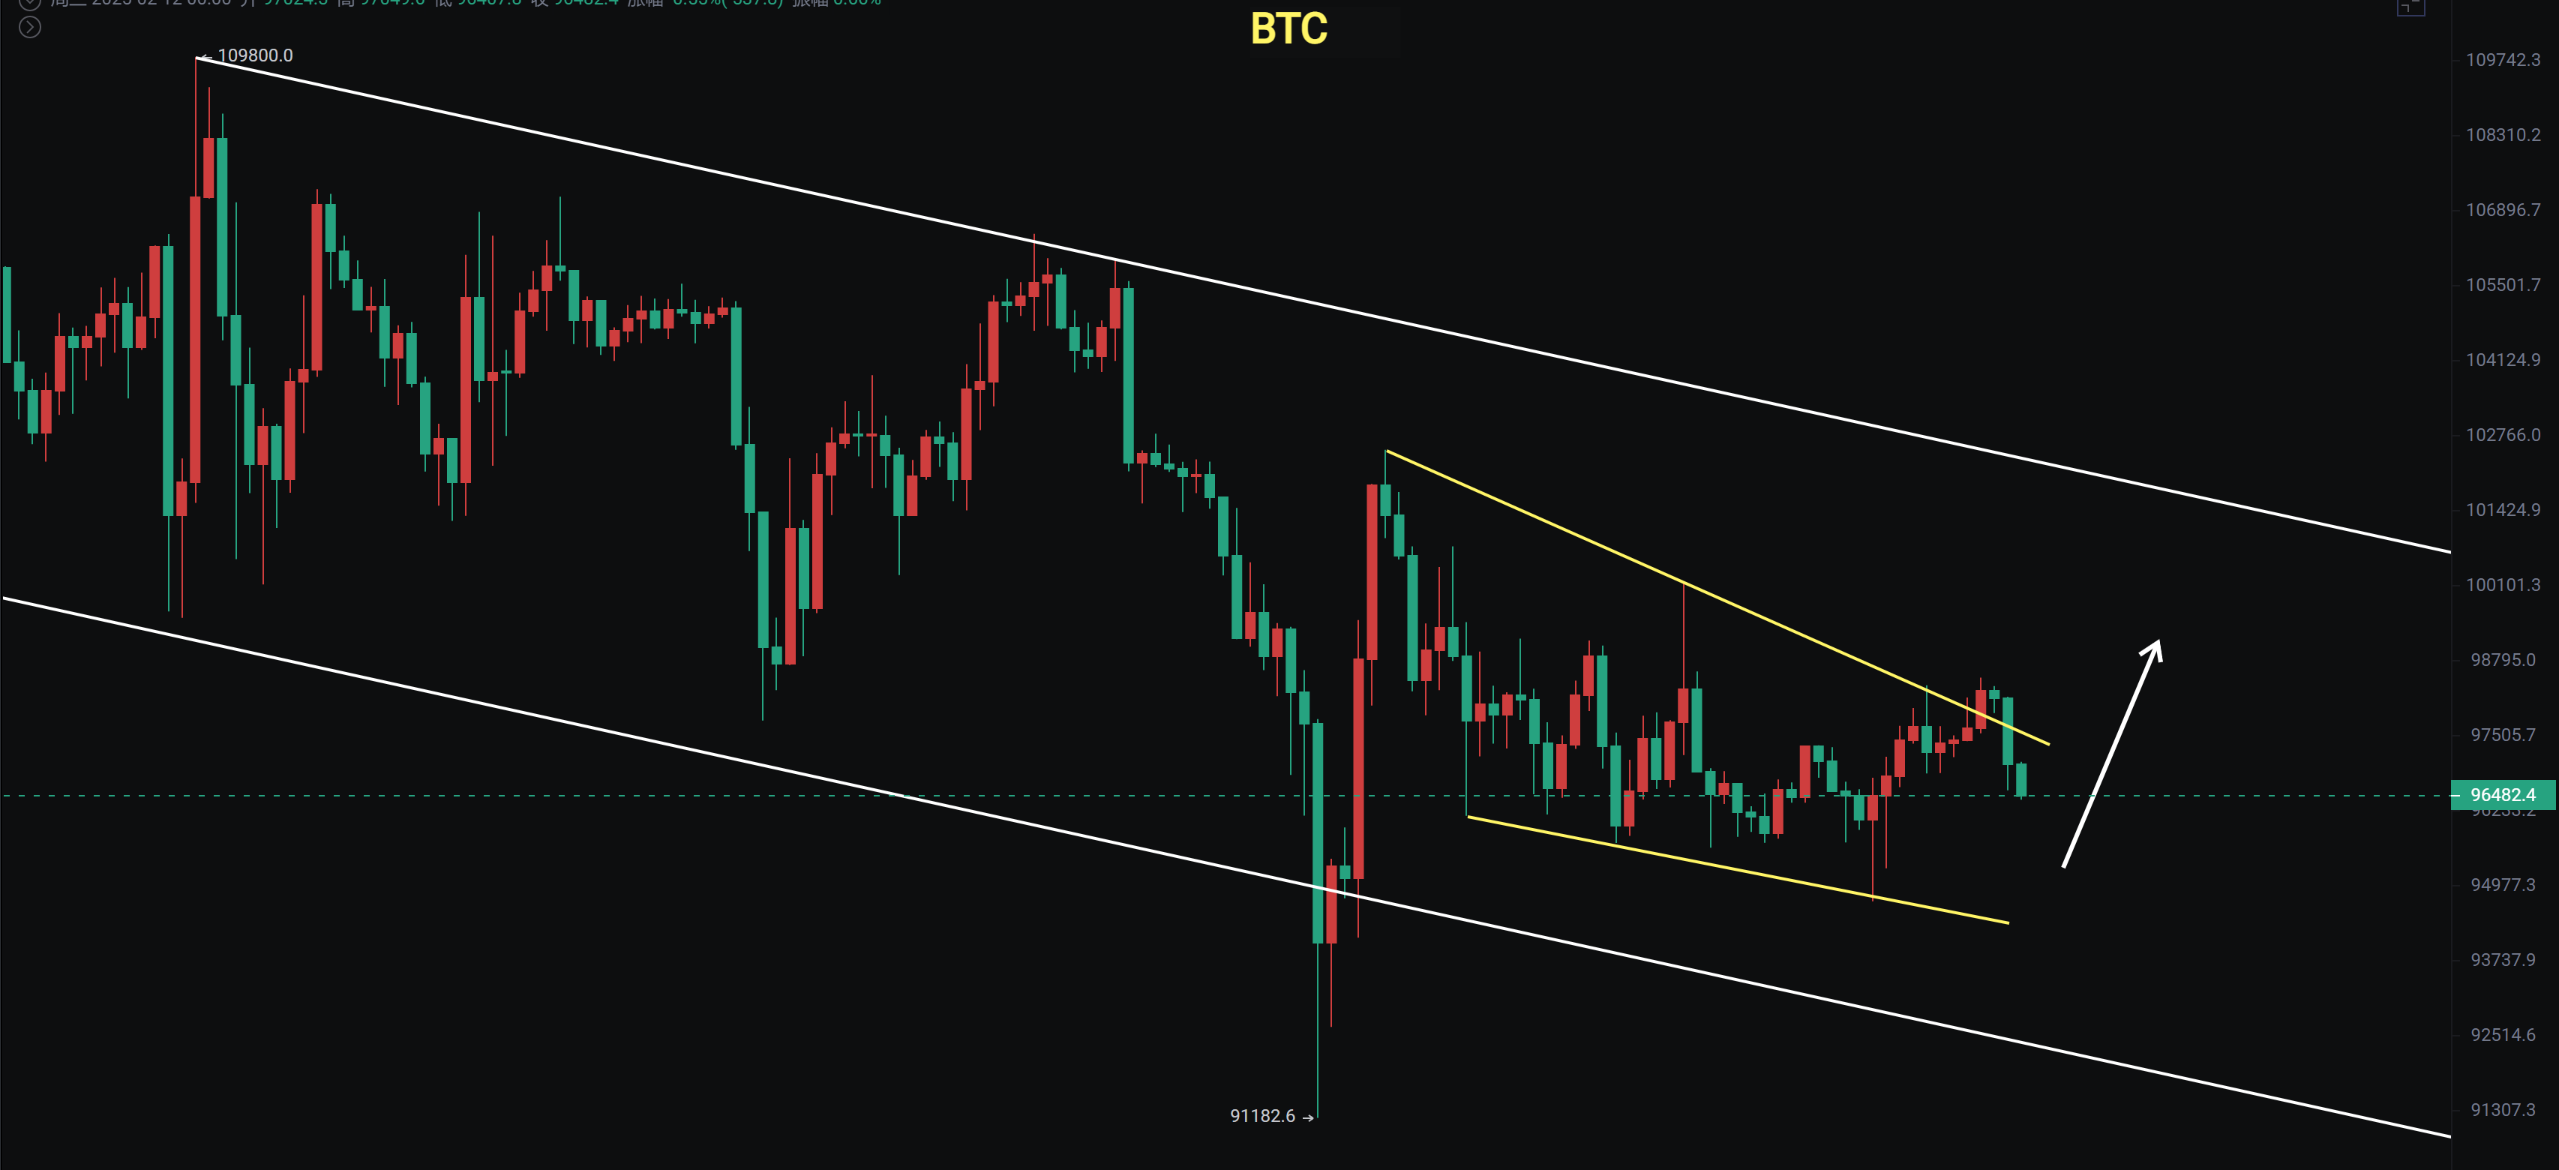
Bitcoin has continued to experience narrow fluctuations on the daily chart, forming six doji candles. During the day, it broke out of a descending wedge but then fell back to test the support level. As of the time of writing, it is testing the support at the 96500 level. If it continues to drop, it will test the bottom support at 95600. If these levels hold, there is still a chance for a rebound.
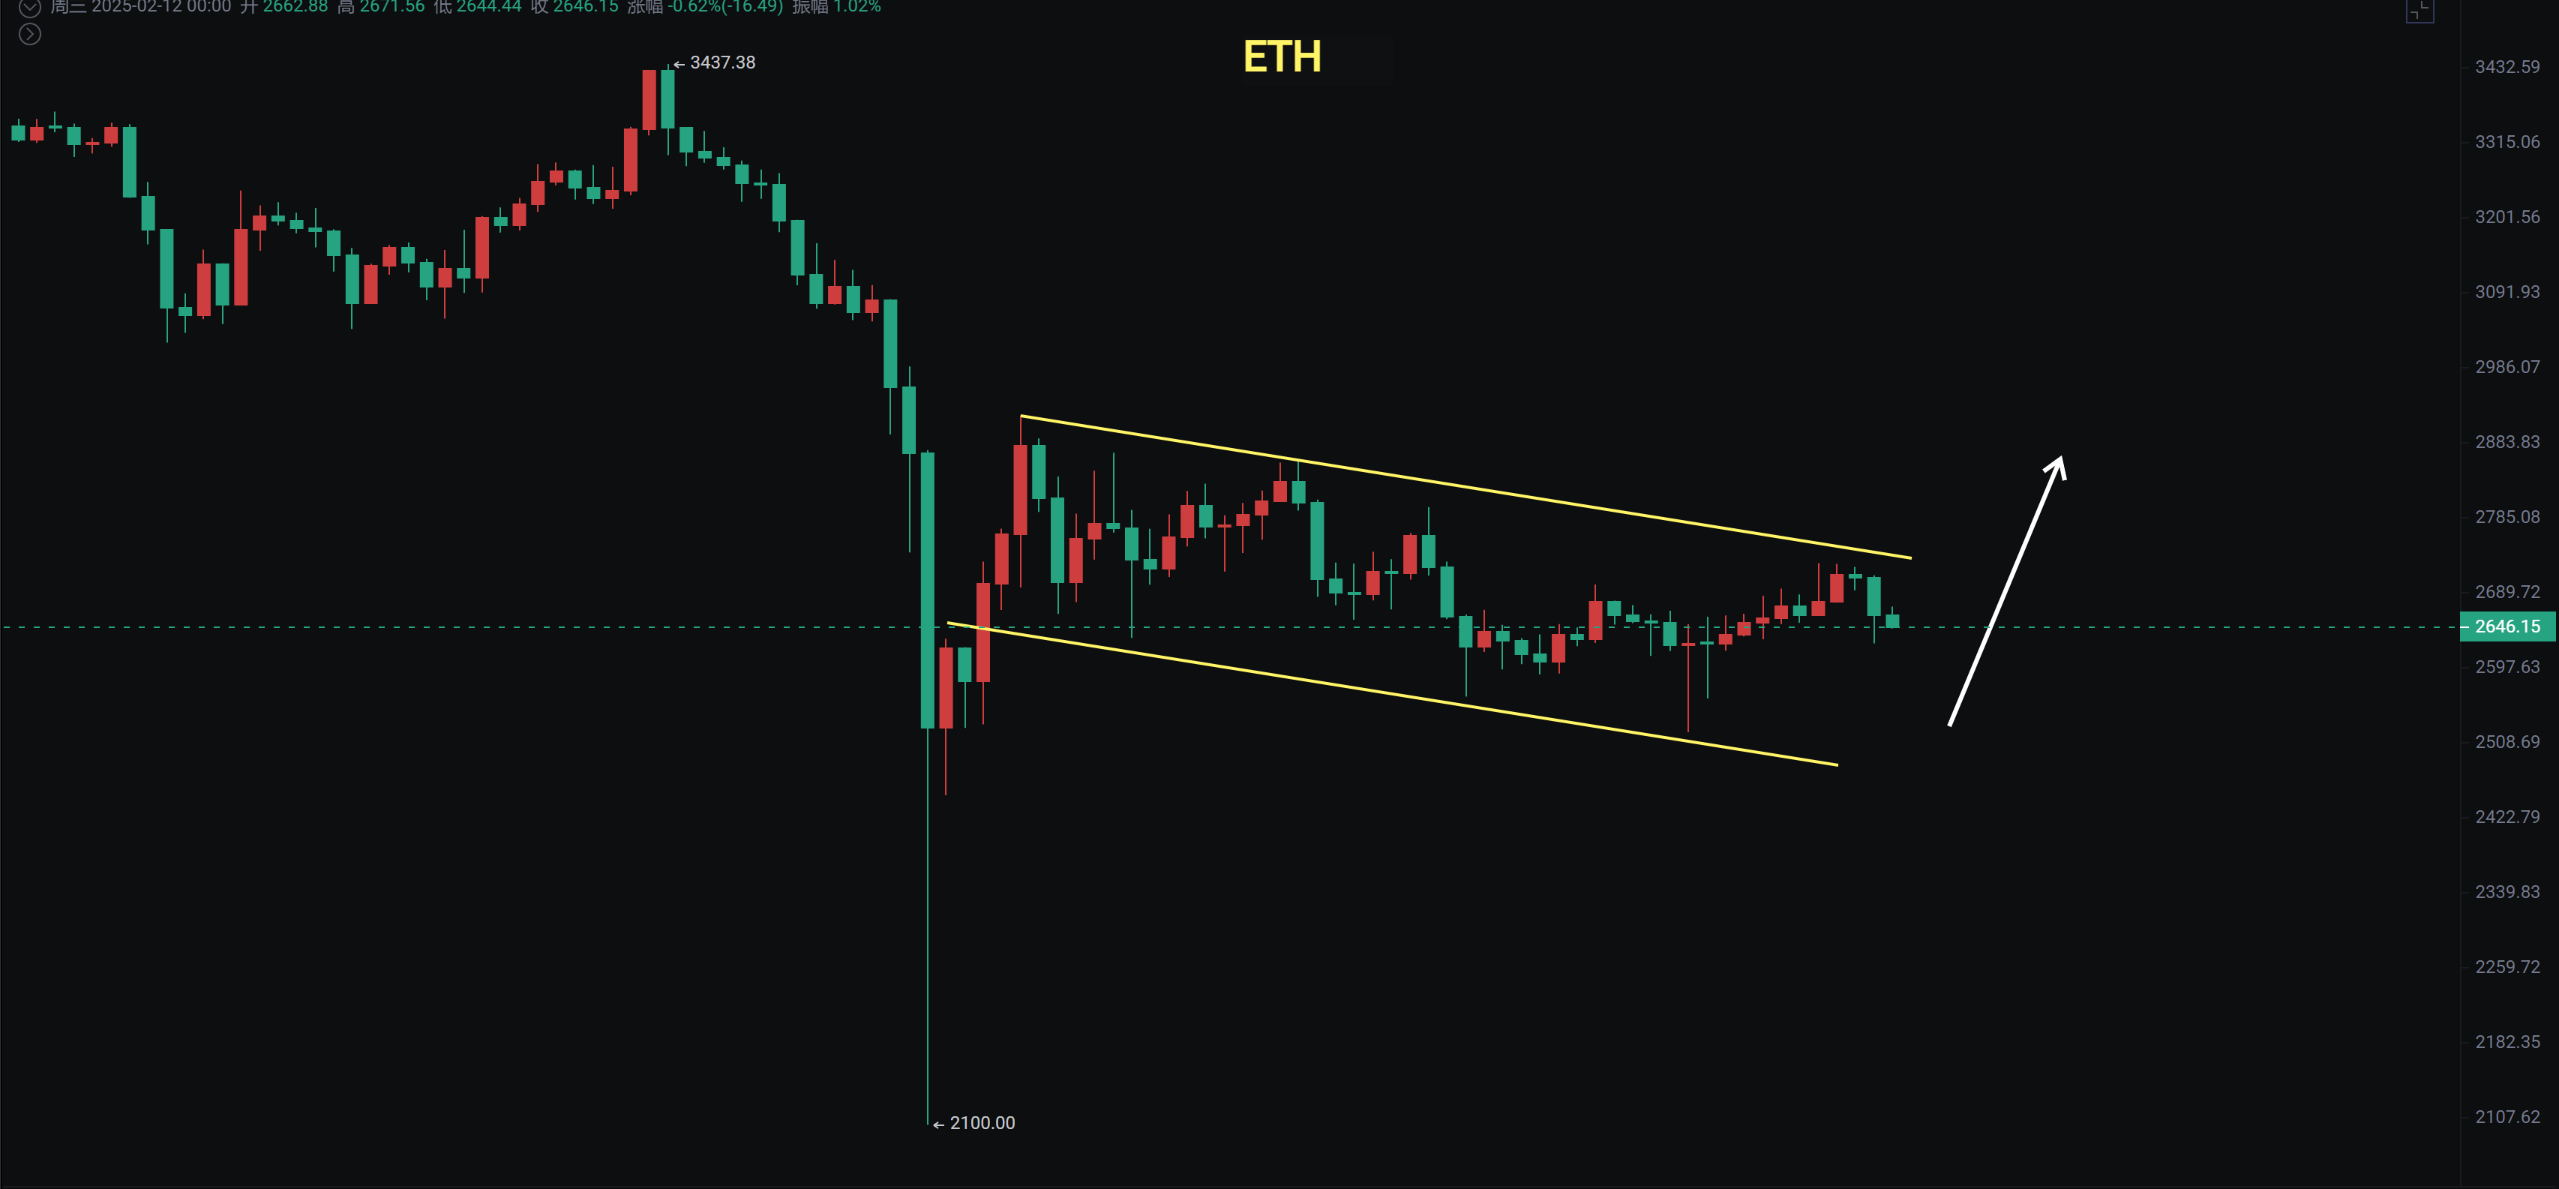
Ethereum also formed a doji on the daily chart, and on the 4-hour chart, it encountered resistance at the descending channel and is currently in a pullback, temporarily looking to test the 2560 support.

The market has not yet broken its pattern. The altcoins that have been oversold are rebounding, and a few days ago, it was suggested to look for the height of the rebound in altcoins, which have a relatively high cost-performance ratio. The young master previously mentioned that for altcoins to break the current gloomy situation, they can only rely on altcoin ETFs to see if they can stimulate market sentiment. Grayscale has submitted a spot ADA ETF application to the New York Stock Exchange, and Nasdaq has submitted 19b-4 application documents for CoinShares' LTC ETF and XRP ETF. Today, ADA and LTC are performing well, along with QTUM, RAY, SUI, and others.
Bitcoin
The daily chart continues to show doji candles with narrow fluctuations between 95600 and 99100. The 4-hour chart just broke out of the descending wedge during the day but fell back again. We are still looking for a rebound supported within the wedge, aiming for a rebound towards 102000 or even 106000.
On the hourly level, the support at 94650 from the downward spike still has some strength. If it does not break, we will continue to look for an upward movement within the wedge. If it breaks, we will stop loss.
Support: Pressure:
Ethereum
The daily chart for Ethereum maintains its operation within a descending channel. During the day, it touched the upper edge of the channel and then pulled back. On the 4-hour chart, we are also looking to see if it can break out of the descending channel with a short-term spike rebound. If it transitions from a decline to a sideways adjustment upwards, we need to be cautious as it often spikes and knocks out some contracts during rebounds.
Support: Pressure:
If you like my views, please like, comment, and share. Let's navigate through the bull and bear markets together!!!
The article is time-sensitive and for reference only, updated in real-time.
Focusing on K-line technical research, sharing global investment opportunities. Public account: Trading Young Master Fusu

免责声明:本文章仅代表作者个人观点,不代表本平台的立场和观点。本文章仅供信息分享,不构成对任何人的任何投资建议。用户与作者之间的任何争议,与本平台无关。如网页中刊载的文章或图片涉及侵权,请提供相关的权利证明和身份证明发送邮件到support@aicoin.com,本平台相关工作人员将会进行核查。


