
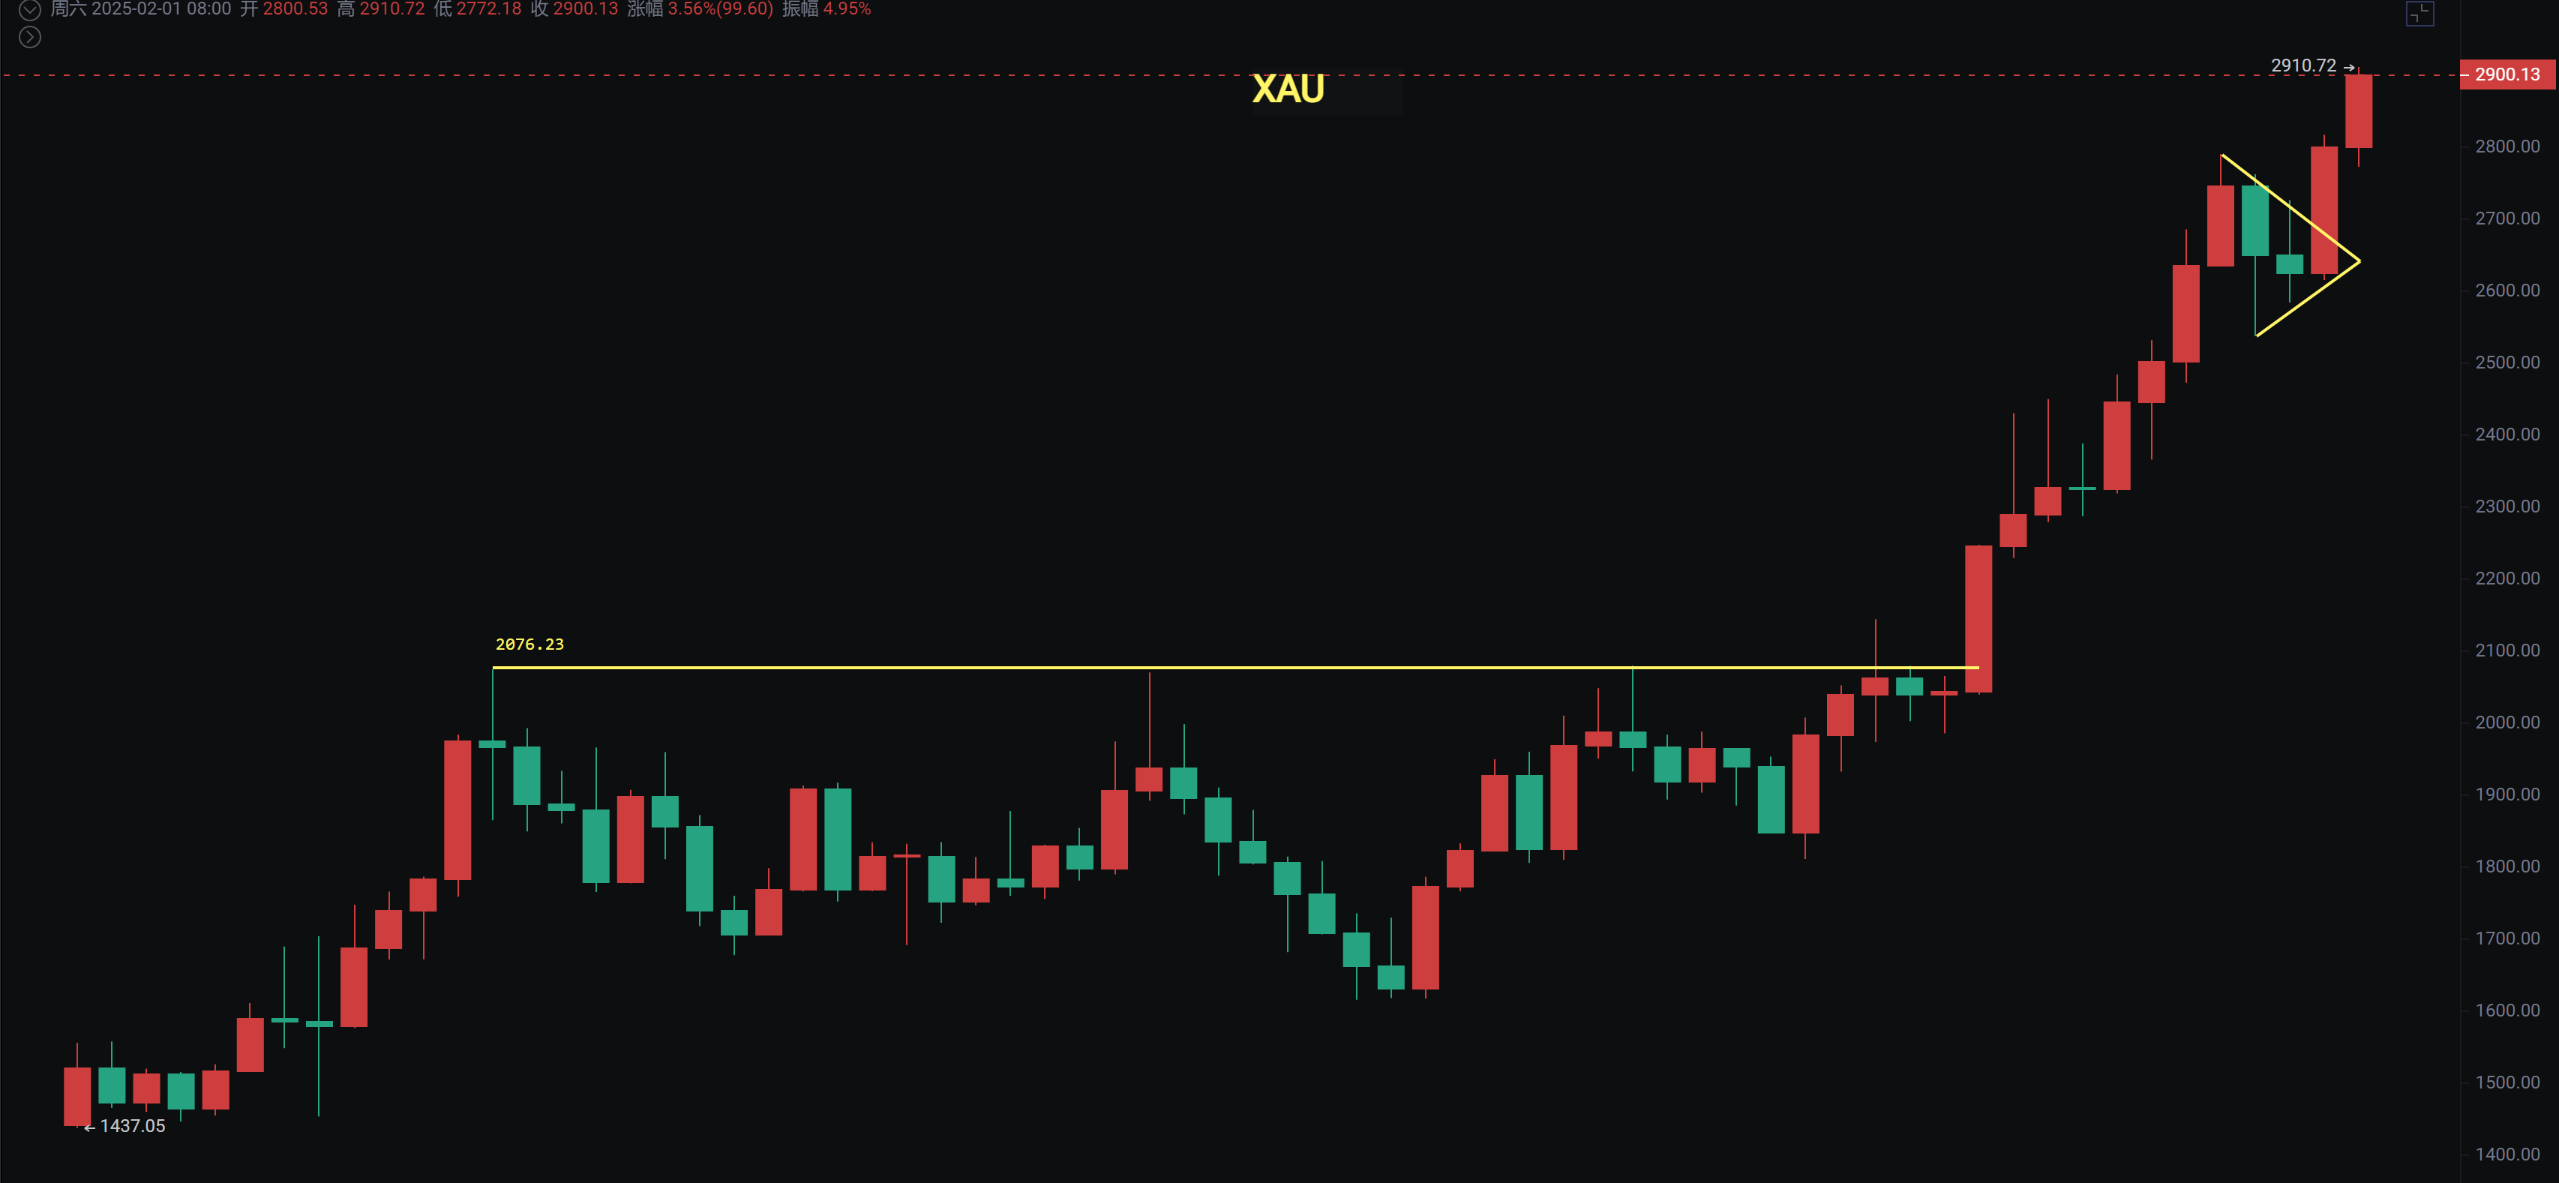
London gold has once again made history, reaching 2910.72. If we consider the 40% increase since breaking the 2020 high at the beginning of 2024, and nearly 80% increase since the end of 2022, those who hoarded physical gold early on are also reaping substantial profits.
Bitcoin has risen from 15,400 to 110,000, an increase of 612%. Although the increase is larger than that of London gold, I believe many people haven't made much money, or Bitcoin profits are offset by losses in Ethereum and altcoins. Many altcoins have been halved or worse, which reflects the current state of the crypto market. Occasionally, there are wealth myths from MEME tokens, but they can also easily go to zero overnight.
Retail investors are losing money, VC institutions are losing money, and even many project teams are at a loss, leading to a very poor wealth effect. This creates a vicious cycle where the less profitable it is, the less people dare to invest. Coupled with expectations of interest rate cuts, economic instability from tariffs, and other factors, the market structure shows BTC rising in steps, then consolidating for months, sometimes even faking a breakdown to wash out before rallying. Strong altcoins make a wave and then drop back, while weak ones can't even rebound and continue to decline. New coins launch only to peak and then enter an endless decline, leaving only MEME tokens with a bit of opportunity.

Bitcoin
Bitcoin's weekly close is a doji star, and it has once again tested the support at 91,000. The weekly chart is getting closer to the middle Bollinger Band; if it doesn't break, there is a chance for a continued rebound. However, we need to pay attention to the height of the rebound. If it cannot reclaim above 102,456 and 106,000, there is a risk of further decline. The MACD is crossing the zero line, and the RSI indicator continues to decline.
The daily chart has shown four consecutive days of doji star oscillation. This is somewhat similar to the previous spike at 88,909. We have been saying since the 5th that we need to wait for a second spike to rebound, as this will give the rebound more strength. The 4-hour chart is still within a descending wedge. If we see a spike between 93,700 and 94,500, we can buy in batches with a stop loss that doesn't break 91,130.
Support: Resistance:

Ethereum
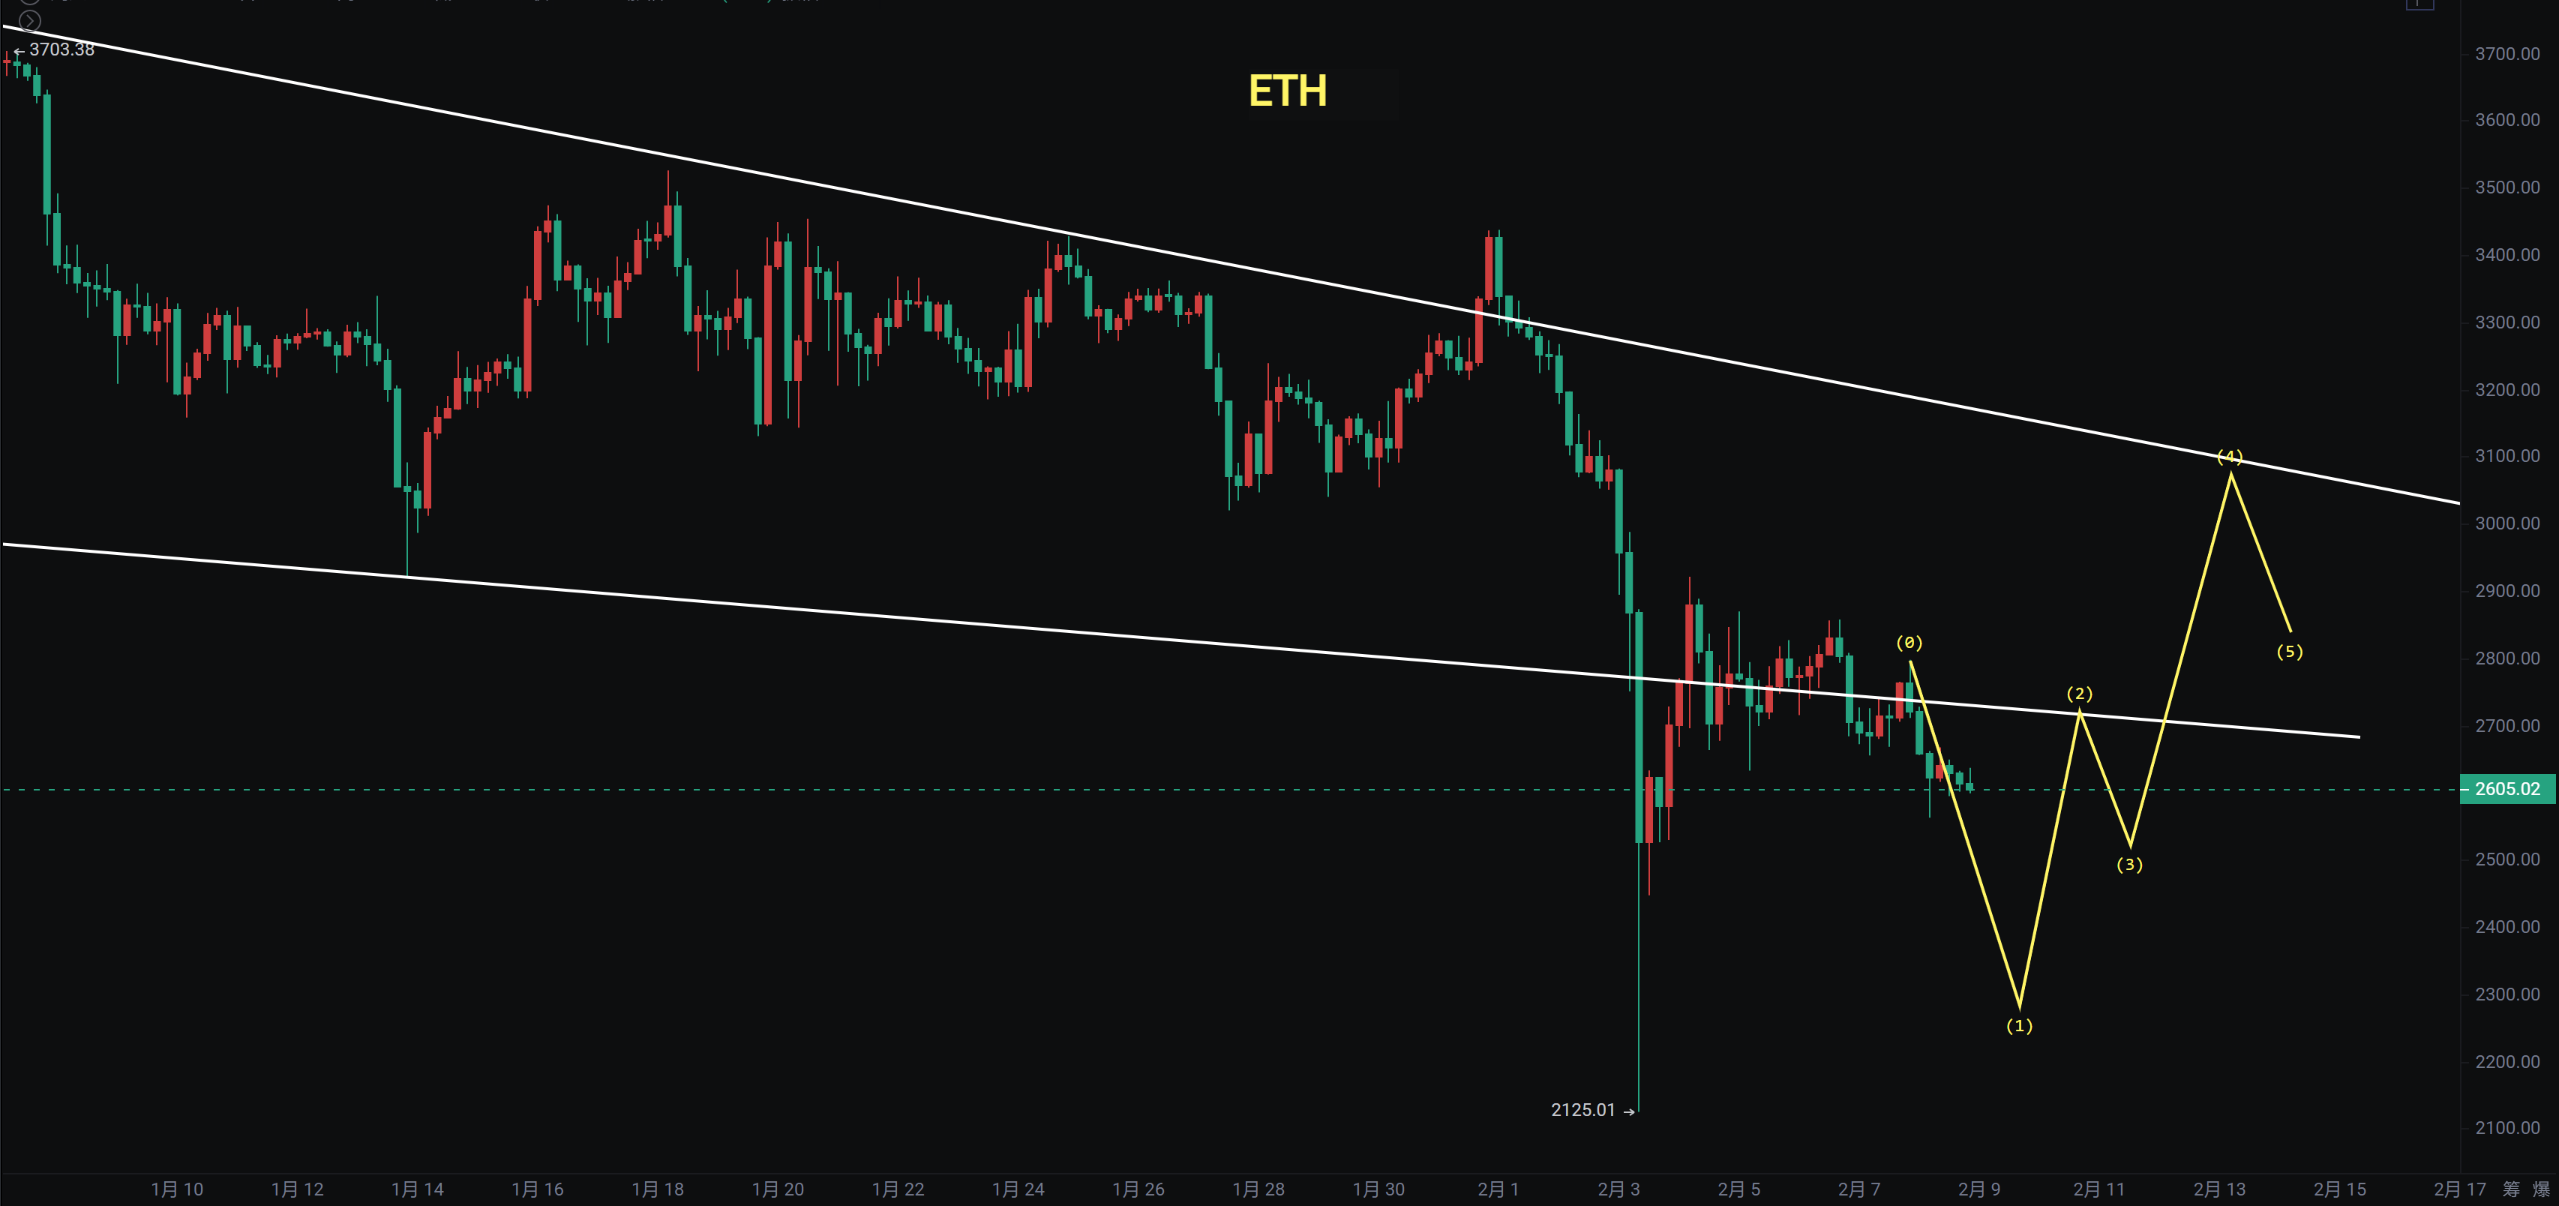
The market sentiment for Ethereum is very negative. The weekly chart has tested the lower Bollinger Band, and the MACD shows a bearish divergence. If the spike at 2,125 doesn't break, it will continue to oscillate within the weekly range. If Bitcoin's adjustment takes longer or retraces more, Ethereum will indeed look very weak, potentially reaching the lower Bollinger Band at around 1,300 to 1,400.
The weekly opening is below 2,800, the bull-bear dividing line. Currently, we are looking at whether a second spike can lead to a rebound. For now, we should operate short-term within the descending channel and buy in batches with a stop loss at 2,125.
Support: Resistance:
If you like my views, please like, comment, and share. Let's navigate through the bull and bear markets together!!!
This article is time-sensitive and for reference only; it is updated in real-time.
Focusing on K-line technical research, we aim to win global investment opportunities. Public account: Trading Prince Fusu

免责声明:本文章仅代表作者个人观点,不代表本平台的立场和观点。本文章仅供信息分享,不构成对任何人的任何投资建议。用户与作者之间的任何争议,与本平台无关。如网页中刊载的文章或图片涉及侵权,请提供相关的权利证明和身份证明发送邮件到support@aicoin.com,本平台相关工作人员将会进行核查。


