
The market continues to be sluggish, with daily candlesticks forming consecutive doji patterns indicating weak rebounds. Ethereum is in a downtrend. I am still following the strategy from the 5th, waiting for a sharp drop to test the lows again. If there is a downward spike followed by a strong rebound, it may rise a bit higher. We will then see if it continues to decline or maintains a high-level consolidation.
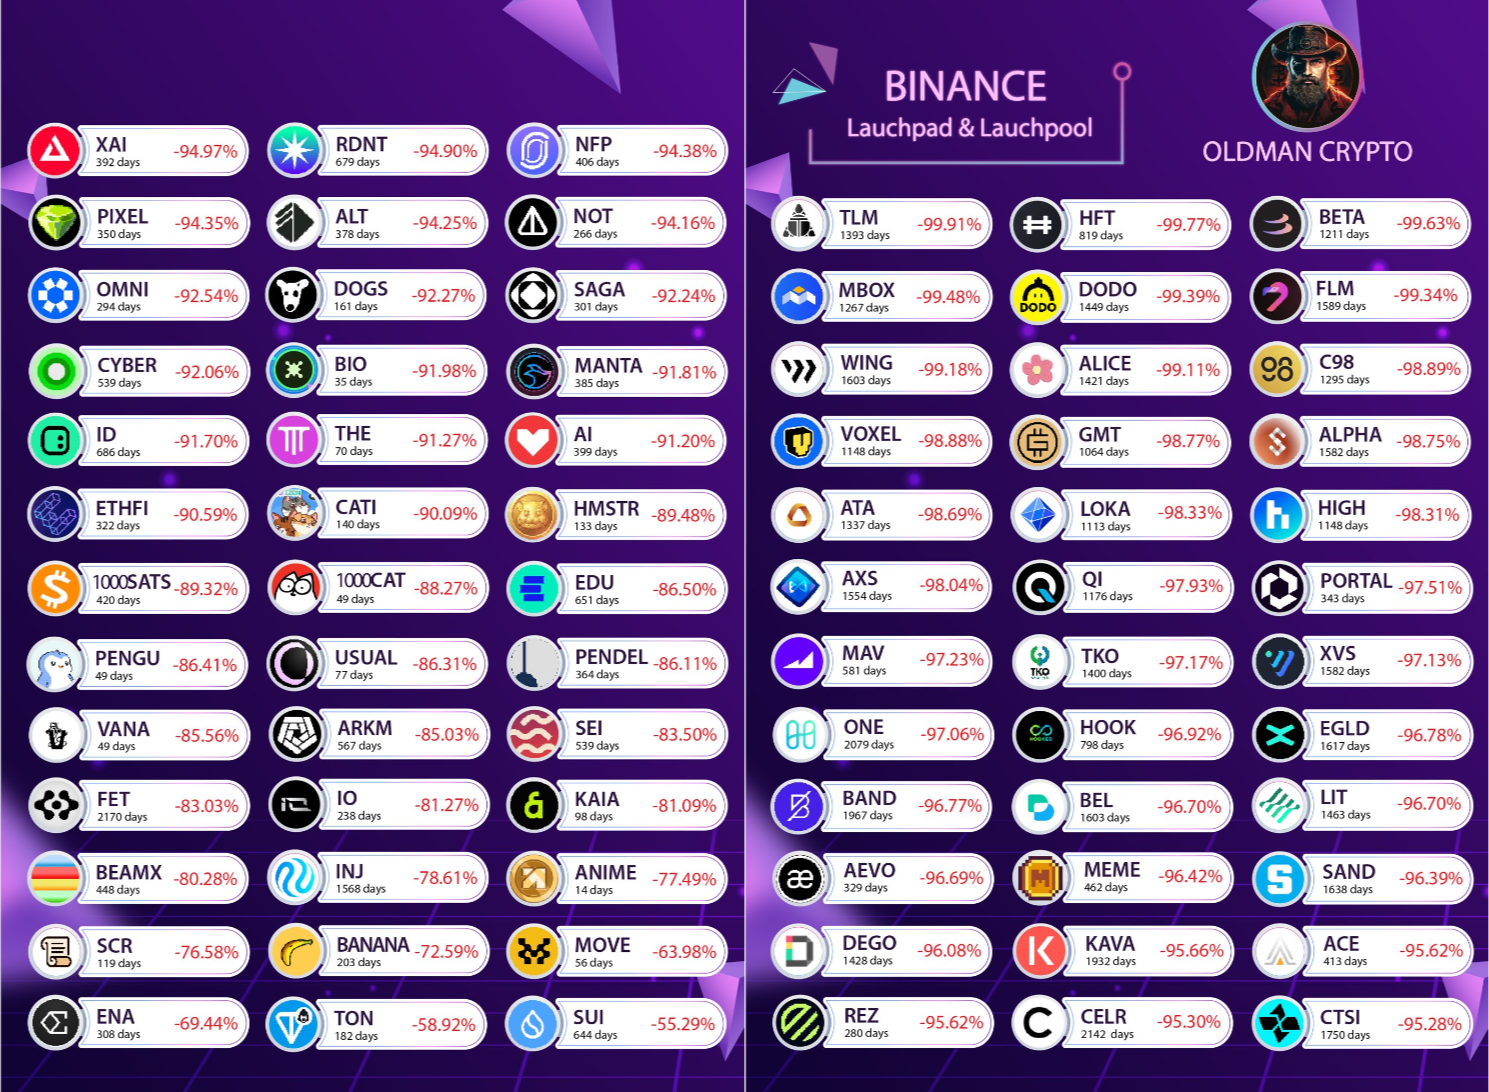
Statistics on Launchpad and Launchpool projects from a certain platform, showing the price drop from historical highs to current prices. Generally, there has been an 80-90% drop. Last year, there were also statistics showing that new coins often dropped 80-90% from their peak right after launch. Many altcoins also experienced a wave of price increase followed by a return to their starting point. I mentioned early on that the altcoin season would see a maximum of 20-30% gains, with a strong polarization where the strong get stronger and the weak get weaker. Choosing coins is a necessary skill.
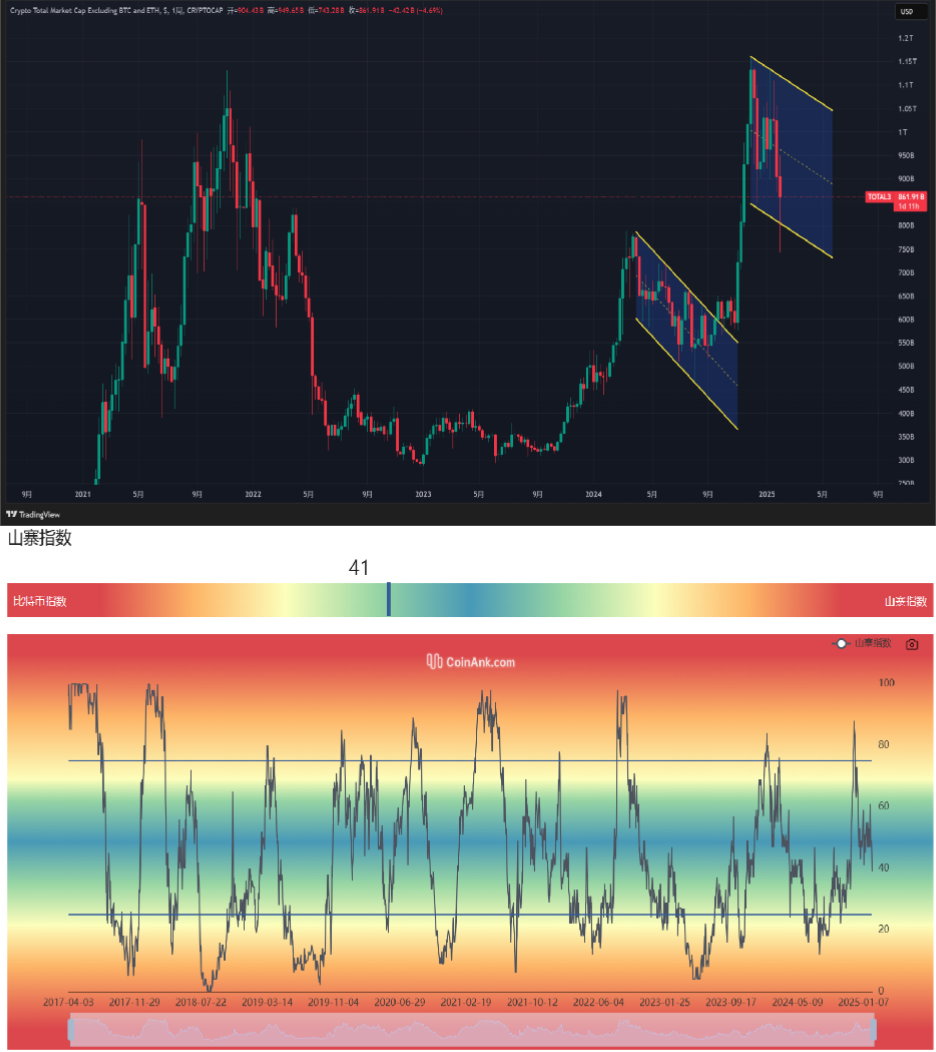
2013 Bull Market: The Initial Rise of Altcoins. Background: Bitcoin first broke the $1,000 mark, with its market cap dominating nearly 100%. As market attention increased, altcoins began to emerge. Quantity Characteristics: In the early days, there were relatively few altcoins, mainly Litecoin (LTC), Ripple (XRP), etc., with a total number possibly only in the dozens.
2017 Bull Market: The ICO Boom Drives Altcoin Explosion. Background: Bitcoin's price soared from about $1,000 to nearly $20,000, and Ethereum's smart contract technology sparked the ICO (Initial Coin Offering) craze. Quantity Characteristics: The number of altcoins rapidly grew to thousands, with Ethereum (ETH), Bitcoin Cash (BCH), etc., becoming mainstream. By the end of 2017, the total number of cryptocurrencies exceeded 1,000.

2021 Bull Market: DeFi and NFTs Foster a Diverse Ecosystem. Background: Bitcoin reached a new high of $64,000, with DeFi (Decentralized Finance) and NFTs (Non-Fungible Tokens) becoming the new narrative focus. Quantity Characteristics: By the end of 2021, the number of cryptocurrencies reached 440,000, growing hundreds of times compared to 2017.
2024-2025 Cycle: Oversupply and Structural Differentiation. Background: Bitcoin attracted institutional funds due to ETF approvals, with its market cap share nearing 60%, while altcoins faced token unlocks and liquidity pressures. Quantity Characteristics: By 2024, the total number of cryptocurrencies surpassed 2.52 million, a 5.7-fold increase from 2021, but most projects performed poorly, with only a few areas like AI and the Solana ecosystem showing localized trends.

Of course, the rise of MEME coins often leads to many projects disappearing within hours of launch. However, the number of altcoins listed on various exchanges is not less than tens of thousands, making it difficult to concentrate funds due to such dispersion. VC coins face resistance from retail investors; rather than being cut by institutions, it is more equitable to chase MEME coins, where life and death are uncertain and wealth is left to fate. VC coins generally drop 80-90%, and while early-stage VCs can still profit, there are also losses. This creates a vicious cycle where investment institutions are less likely to increase their market positions. If altcoins cannot rise, fund management institutions will also face significant issues.
This has similarities with traditional financial markets like the US and Hong Kong stock markets. The US stock market has its "seven golden flowers" and long-standing indices, but there are also many stocks worth just a few cents. The Hong Kong stock market has many penny stocks with no trading volume. Therefore, whether the crypto market will evolve like traditional finance is a historical inevitability; there is nothing new under the sun, and all history is contemporary history. Anyone can predict the future of this world as long as they understand its past well enough.
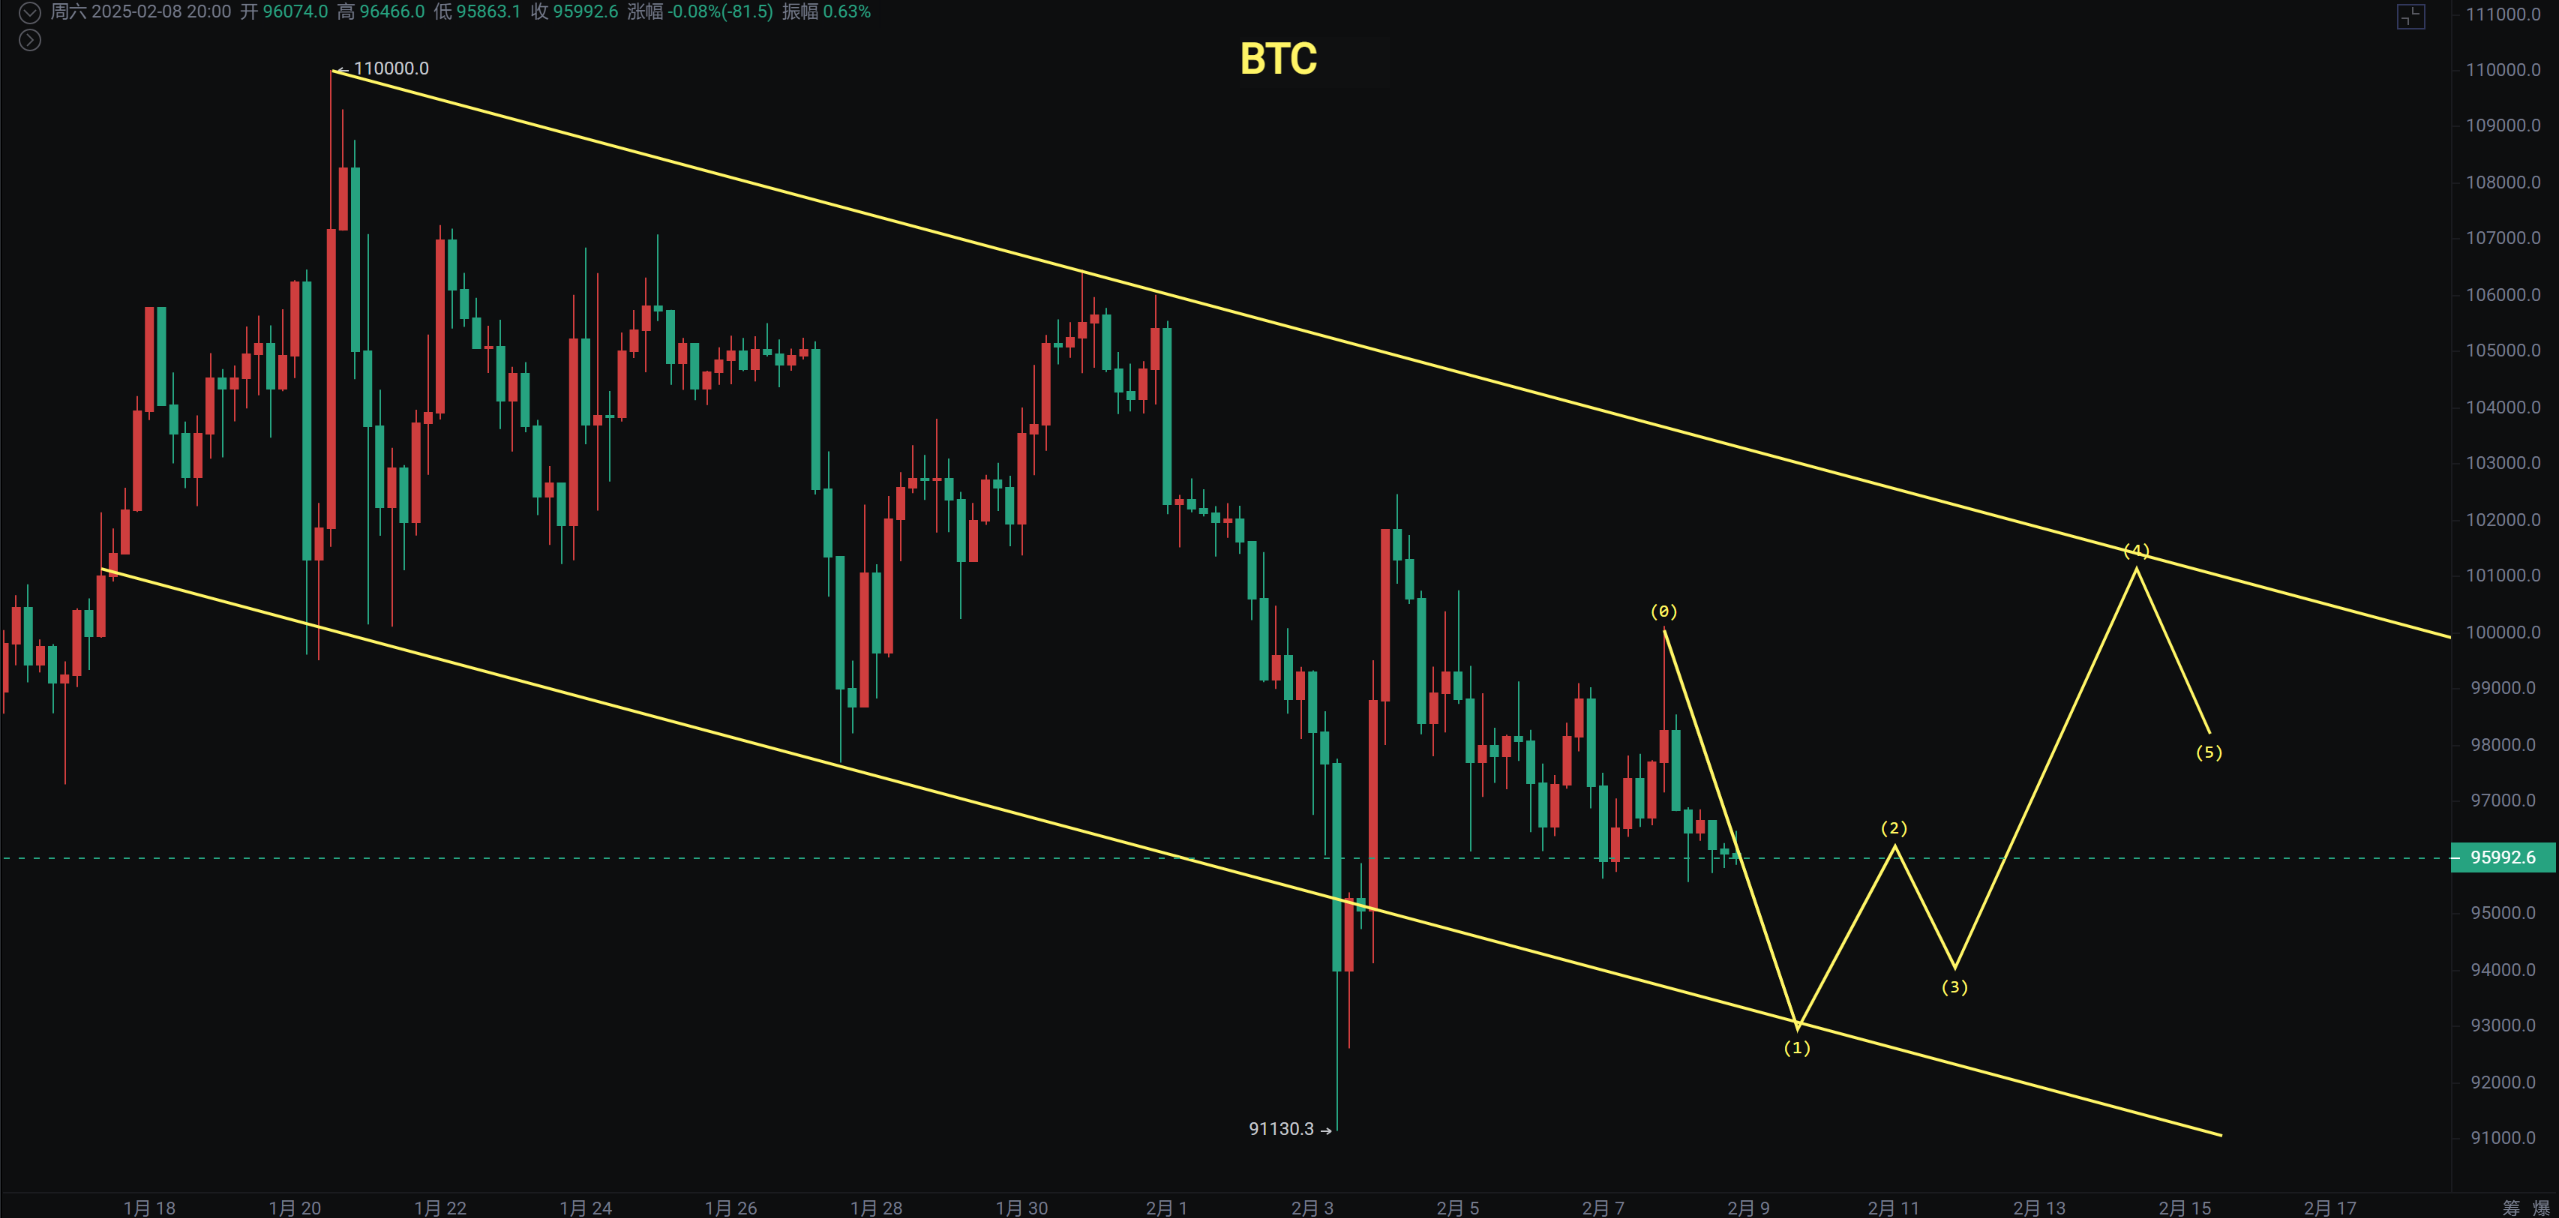
Bitcoin
The weekly chart is likely to form a doji, while the MACD has crossed the zero axis with the fast and slow lines. The daily chart shows a double doji pattern after the spike on February 3, and if the rebound cannot effectively break through the resistance, it will be an invalid rebound.
The 90,000 line is a bullish support, and I still need to observe the strength of the rebound from the second test spike. The daily and 4-hour charts have maintained a downward channel, and the greater risk will depend on whether the rebound can break through this channel; otherwise, the sluggish market will continue.
Support: Resistance:
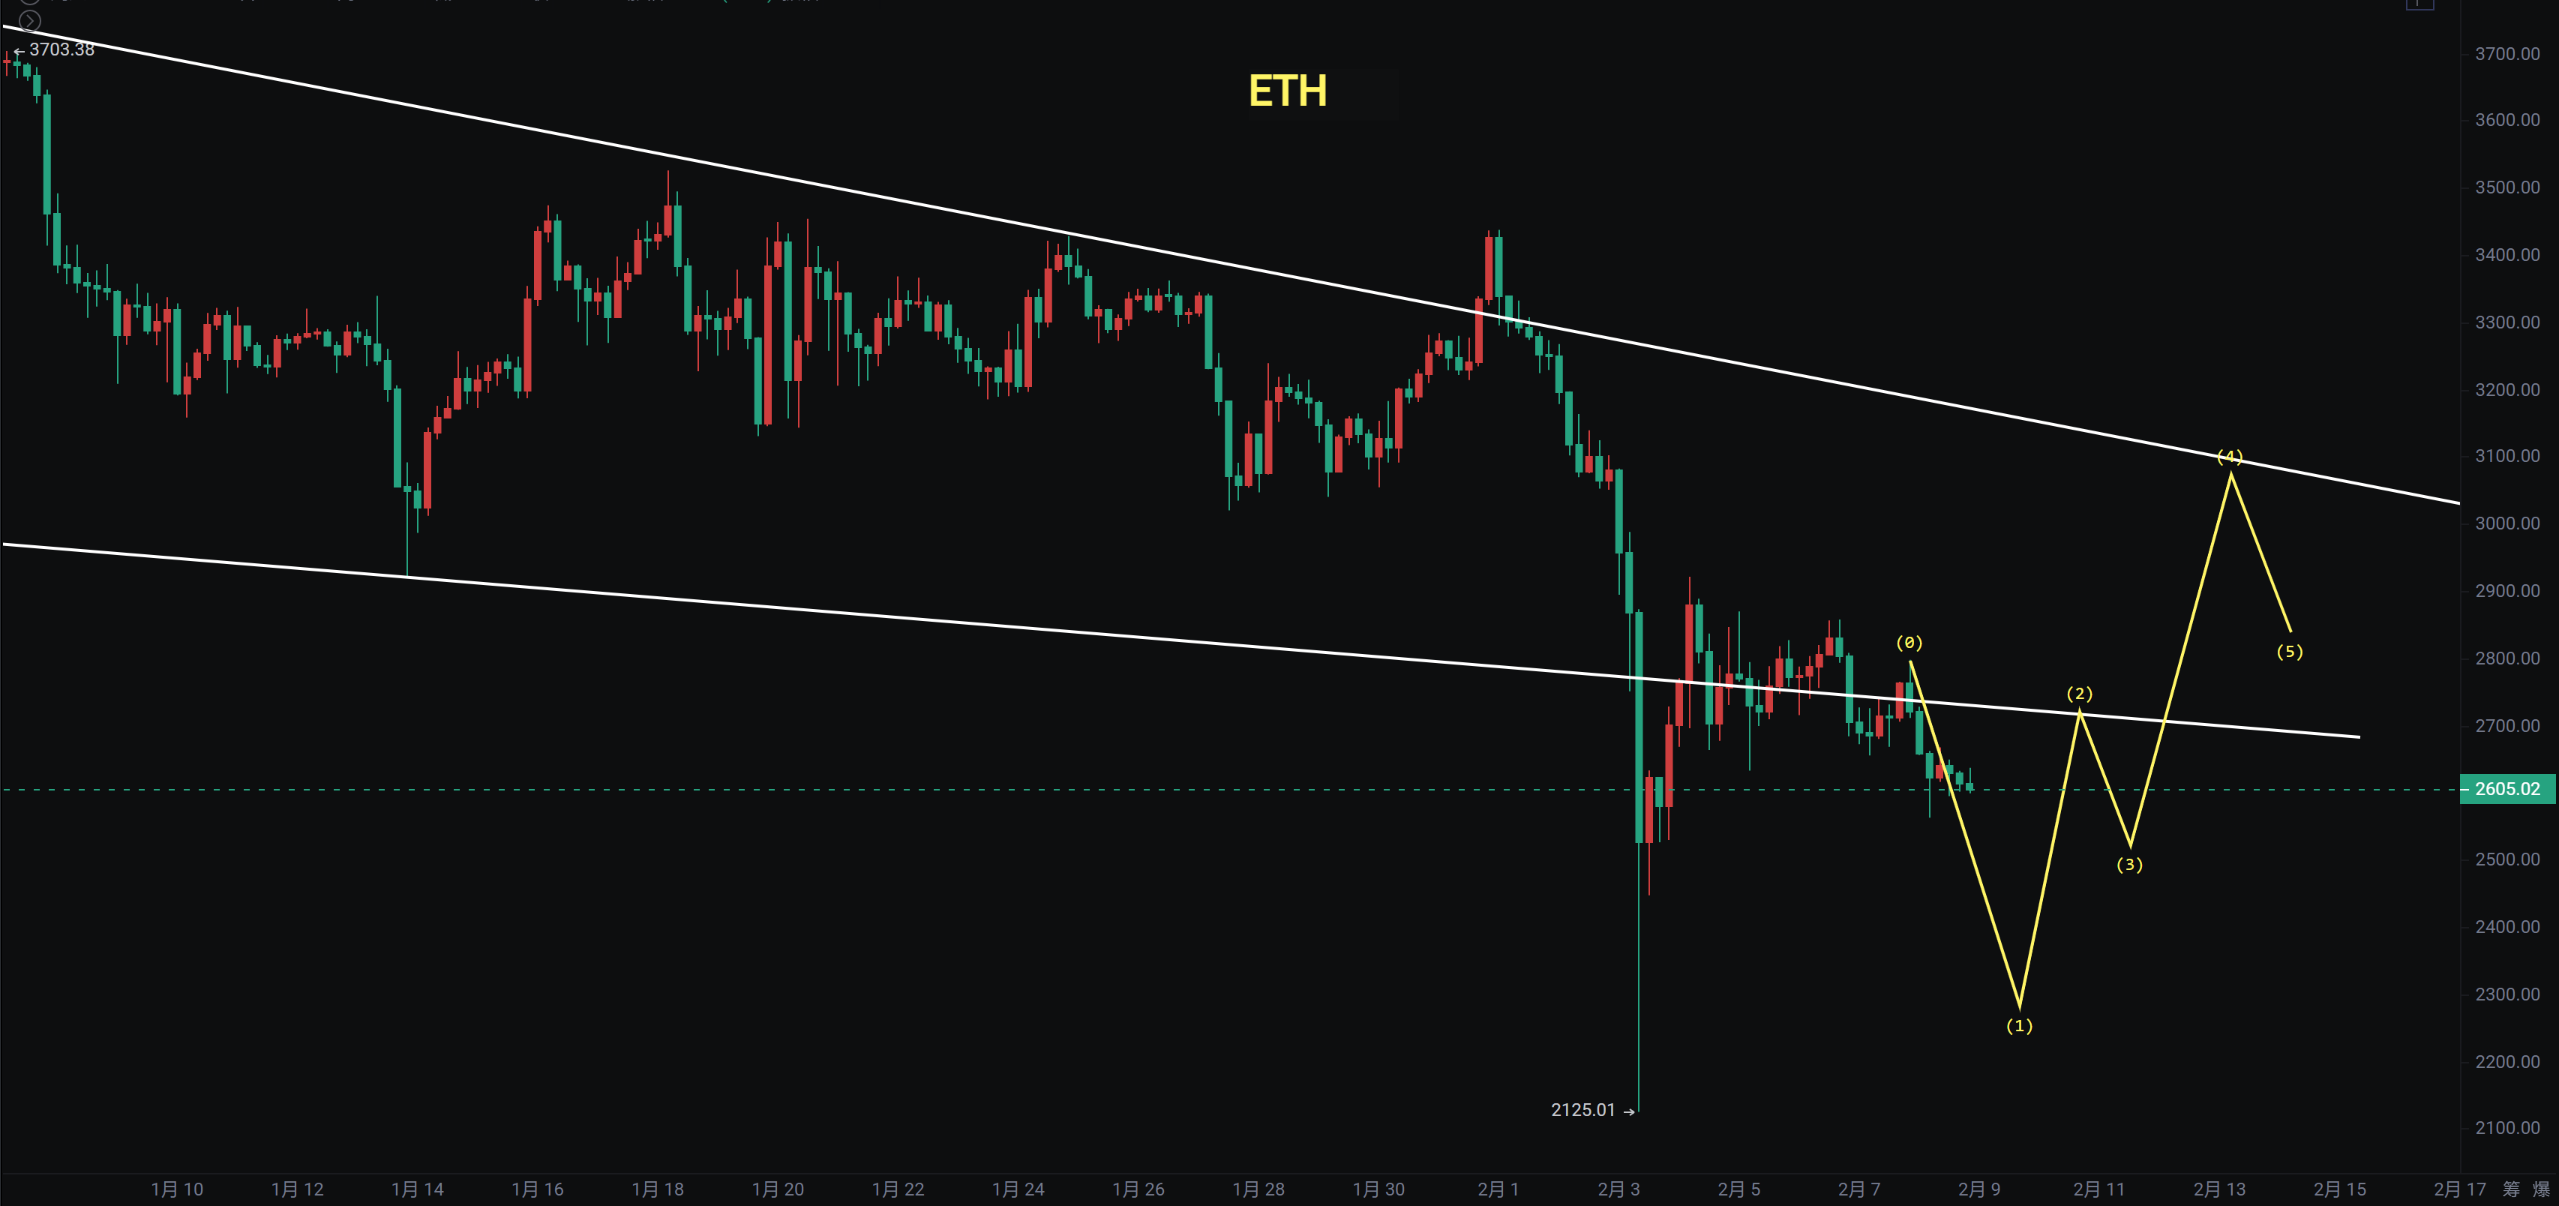
Ethereum
The criticism of Ethereum's decline has not been a one or two-day issue. Since the spike on the daily chart, the price has continued to fall, and the weekly and monthly charts are forming an M-top pattern. Previously, we thought there was a chance for a head-and-shoulders bottom, but a sharp drop has shattered bullish confidence. Bitcoin has always been in a bull market; even if a "black swan" event occurs and it drops to the 8,000 or even 7,000 range, I wouldn't panic. However, if it does happen, it's uncertain where Ethereum will go.
In the short term, I am still looking for rebound opportunities from the second test. From the spike bottom to the false breakout, the rebound has not exceeded 0.618, and I will pay attention to the 0.236 level (2434) or even the spike opportunities in the 2200-2300 range.
Support: Resistance:
Regarding altcoins: I am not aggressive; I usually wait for Bitcoin to have a second test or a right-side entry point. I rarely rush to enter altcoins at low points, so I will continue to wait!
If you like my views, please like, comment, and share. Let's navigate through the bull and bear markets together!!!
The article is time-sensitive and for reference only, with real-time updates.
Focusing on K-line technical research, sharing global investment opportunities. Public account: Trader Gongzi Fusu

免责声明:本文章仅代表作者个人观点,不代表本平台的立场和观点。本文章仅供信息分享,不构成对任何人的任何投资建议。用户与作者之间的任何争议,与本平台无关。如网页中刊载的文章或图片涉及侵权,请提供相关的权利证明和身份证明发送邮件到support@aicoin.com,本平台相关工作人员将会进行核查。


