This article analyzes 15 commonly used indicators for market tops and finds that one-fifth of these indicators have already reached their peak in 2024.
Author: Viee, Core Contributor at Biteye
Every bull market not only creates wealth but also generates countless illusions of wealth. When the market is euphoric, few can remain clear-headed and elegantly "exit at the top." In the face of volatile markets, knowing how to exit near the peak in a timely manner to avoid asset depreciation from deep corrections requires a comprehensive assessment of multiple market indicators.
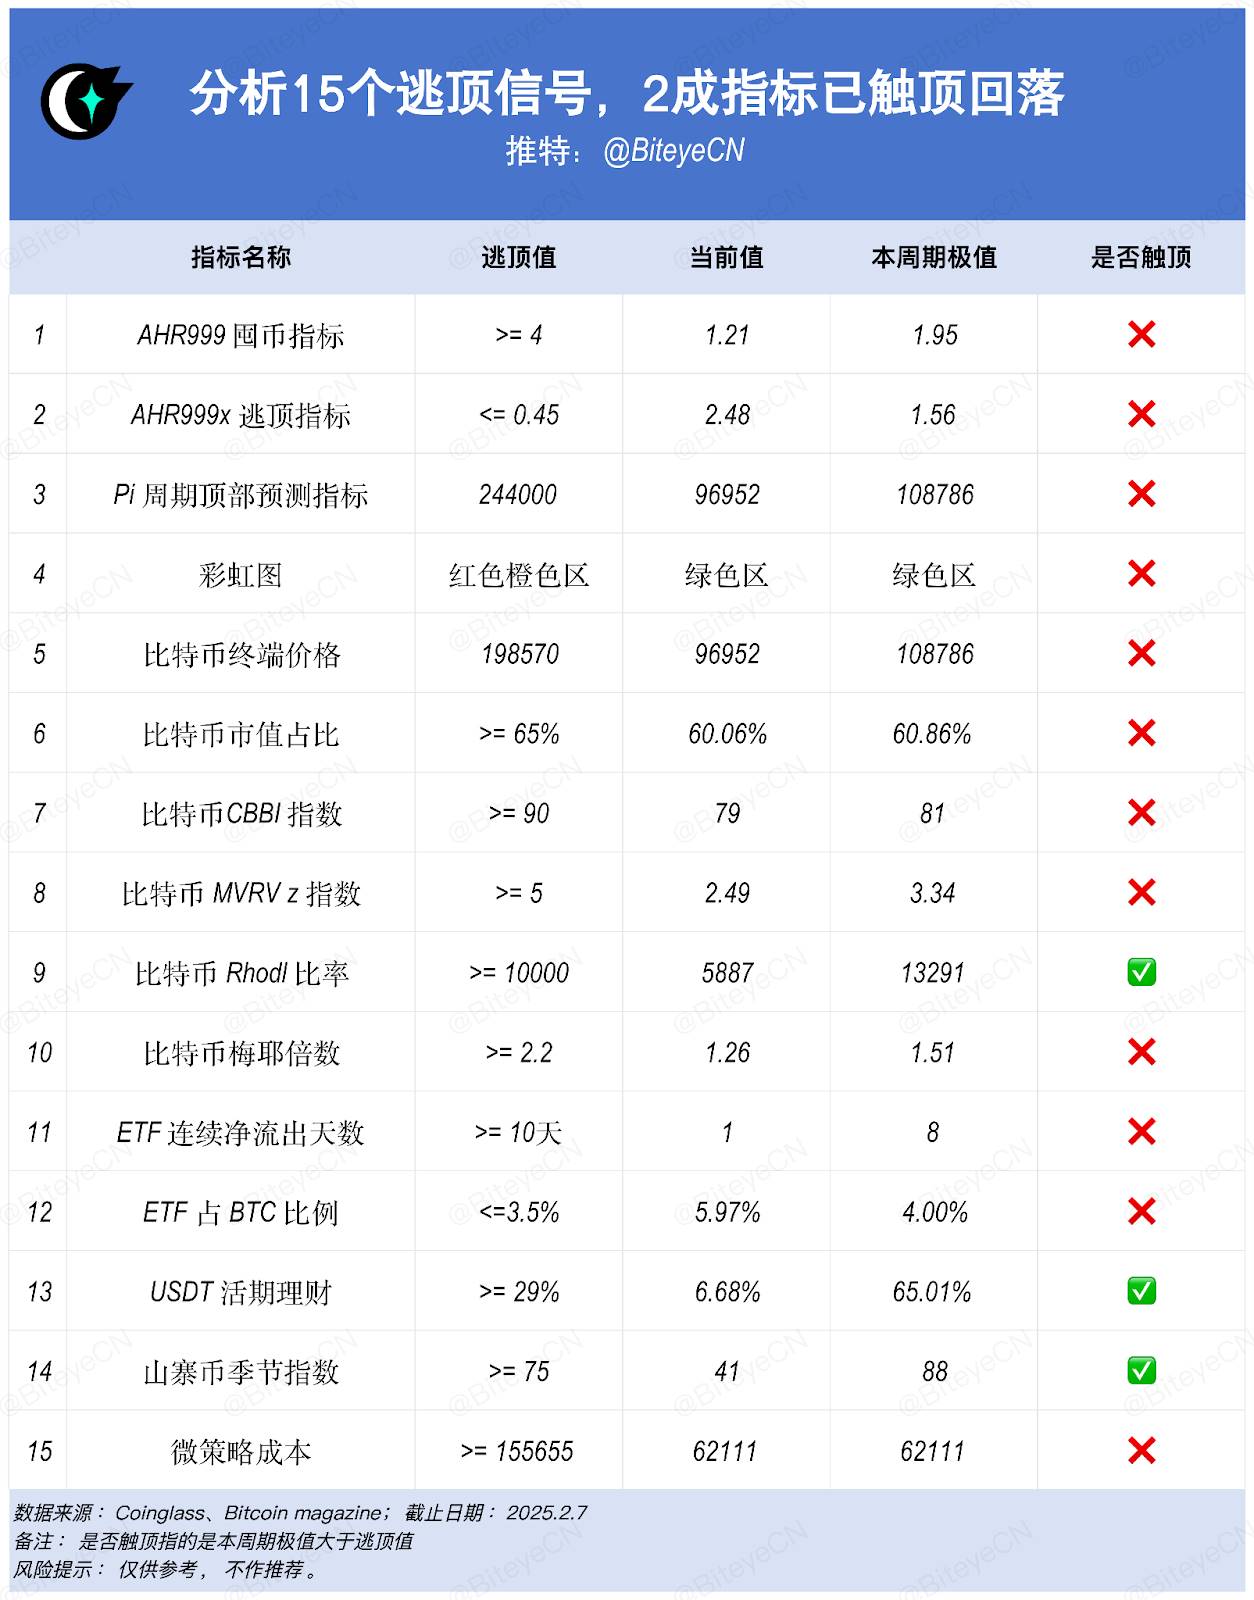
In this article, Biteye analyzes 15 commonly used indicators for market tops and finds that one-fifth of these indicators have reached the escape zone in 2024, specifically: Bitcoin Rhodl Ratio, USDT Spot Financial Management, and Altcoin Season Index. So, how should we respond to the subsequent developments in the market?
1. Indicator Introduction
- AHR999 Accumulation Indicator
This indicator was created by Weibo user ahr999 to assist Bitcoin dollar-cost averaging users in making investment decisions based on timing strategies. The indicator implies the yield of short-term Bitcoin dollar-cost averaging and the deviation of Bitcoin price from expected valuation.
Indicator Range:
4: Suggests significantly reducing positions
1.2-4: Watchful area, remain alert
0.45-1.2: Dollar-cost averaging area, can gradually build positions
0.45: Strong buying area
🔥 Current Status: The indicator value is 1.21, not yet at the peak, in the watchful area, suggesting caution.
Link: https://www.coinglass.com/zh/pro/i/ahr999
- AHR999 Escape Indicator
The AHR999 Escape Indicator is a sister indicator to the accumulation indicator, specifically used to identify market top areas. This indicator assesses whether the market is overheated by observing the degree of price deviation from the long-term trend line. It provided accurate warning signals at the tops of the two major bull markets in 2017 and 2021, making it an important tool to avoid chasing highs.
Indicator Range:
- =0.45: Severely overheated, consider exiting the top
🔥 Current Status: The indicator value is 2.48, and no peak signal has appeared in this cycle.
Link: https://www.coinglass.com/zh/pro/i/ahr999-escape
- Pi Cycle Top Indicator
The Pi Cycle Top Indicator predicts potential market tops by comparing the relationship between the 111-day moving average and the 350-day moving average. Historically, when the moving averages cross, Bitcoin's price is usually close to the cycle top, indicating a potential market reversal.
Signal Features:
Cross of the two lines: Top signal triggered
Rapid divergence: Bearish outlook
Gradual approach: Warning to be cautious
🔥 Current Status: The two moving averages still have a significant distance, and no top signal has appeared yet; the next crossover is expected in October 2025.
Link: https://www.bitcoinmagazinepro.com/charts/pi-cycle-top-prediction/
- Bitcoin Rainbow Chart
The Rainbow Chart is an intuitive long-term valuation model that divides Bitcoin price ranges into nine different colored bands. This model is based on logarithmic regression, considering Bitcoin's long-term growth characteristics and cyclical features. Throughout multiple market cycles, the Rainbow Chart has shown good guiding effects, especially in identifying extreme areas.
Indicator Range:
Red: Bubble area, sell signal
Yellow: Overheated area, remain alert
Green: Healthy area, holding range
Blue: Value area, buying opportunity
🔥 Current Status: The price is in the green area, indicating relatively reasonable valuation, and no top signal has appeared.
Link: https://www.coinglass.com/zh/pro/i/bitcoin-rainbow-chart
- Bitcoin Terminal Price Indicator
The terminal price is the transfer price multiplied by 21. The transfer price requires dividing the days of coins destroyed by the existing Bitcoin supply and its circulation time. This indicator effectively filters out market speculation factors, reflecting the true value of the Bitcoin network.
Signal Features: The closer the Bitcoin price is to the red line, the closer the market is to the top.
🔥 Current Status: Not yet at the peak.
Link: https://www.bitcoinmagazinepro.com/charts/terminal-price/
- Bitcoin Market Cap Dominance
The market cap dominance indicator reflects Bitcoin's dominant position in the entire cryptocurrency market. This indicator is often used to judge market cycles and capital flows; when Bitcoin's market cap dominance decreases, it usually means that funds are starting to shift to altcoins. Historical data shows that changes in Bitcoin's market cap dominance often predict turning points in the entire cryptocurrency market.
Indicator Range:
65%: Bitcoin strong period
40-65%: Balance period
40%: Altcoin active period
🔥 Current Status: The market cap dominance is about 60%, in a relatively balanced range.
Link: https://www.coinglass.com/zh/pro/i/MarketCap
- Bitcoin CBBI Index
CBBI (Combined Bitcoin Binary Index) is a composite index that integrates multiple technical indicators and on-chain data, effectively identifying turning points in bull and bear cycles. Its advantage lies in reducing the limitations of a single indicator through multidimensional data.
Indicator Range: Greater than 90 indicates the market has reached a top.
🔥 Current Status: The index value is 79, showing the market is slightly overheated but not yet at the peak.
Link: https://www.coinglass.com/zh/pro/i/cbbi-index
- Bitcoin MVRV Z Score
The MVRV Z Score is an important on-chain analysis indicator that assesses the market cycle by comparing the deviation of market cap from realized value. When this indicator is too high, it indicates that Bitcoin's market cap is overvalued relative to its actual value, which is unfavorable for Bitcoin's price; conversely, it indicates undervaluation. Based on historical experience, when this indicator is at historical highs, the probability of Bitcoin's price showing a downward trend increases, necessitating caution against chasing highs.
Indicator Range: Greater than 5 indicates the market has reached a top.
🔥 Current Status: The index is 2.5, not yet at the peak.
Link: https://www.coinglass.com/zh/pro/i/bitcoin-mvrv-zscore
- Bitcoin Rhodl Ratio
The Rhodl Ratio is a composite on-chain indicator that assesses market potential turning points by comparing the behavioral characteristics of holders over different periods. When the RHODL ratio begins to approach the red band, it may indicate that the market is overheated. Historically, this has been a good time for investors to take profits in each cycle.
Indicator Range: Approaching the red band may indicate that the market is overheated. Ratio >= 10000 indicates the market is close to the top.
🔥 Current Status: Currently not in the red band; however, this indicator entered the peak zone during November 2024.
Link: https://www.coinglass.com/zh/pro/i/r-hodl-ratio
- Bitcoin Mayer Multiple
The Bitcoin Mayer Multiple is a technical indicator used to analyze the state of the Bitcoin market, proposed by Trace Mayer. It assesses the relative valuation level of the market by comparing Bitcoin's current price with its 200-day moving average (200DMA).
Indicator Range:
Mayer Multiple > 1: Indicates the current Bitcoin price is above its 200-day moving average, and the market may be in an overbought state.
Mayer Multiple = 1: Indicates the current Bitcoin price is below its 200-day moving average, and the market may be in an oversold state.
Mayer Multiple ≈ 1: Indicates the current Bitcoin price is close to its 200-day moving average, and the market may be in a relatively balanced state.
Historically, when the Mayer Multiple exceeds 2.4, it usually indicates that the market is overheated, and a correction or bear market may occur. When the Mayer Multiple is below 0.8, the market may be undervalued, which could be a good buying opportunity.
🔥 Current Status: The index is 1.26, the market is in an overbought state, but not yet at the peak.
Link: https://www.coinglass.com/zh/pro/i/mayer-multiple
- ETF Consecutive Net Outflow Days
This indicator tracks the capital flow of Bitcoin ETFs, and consecutive net outflow days often reflect the confidence of institutional investors. This is a relatively new indicator that has gradually gained market attention since the launch of spot ETFs.
Signal Features:
10 days: Significant bearish signal
5-10 days: Need to be cautious
5 days: Normal fluctuation
🔥 Current Status: Consecutive net outflow for 1 day, within the normal market fluctuation range. The maximum consecutive days in this cycle is 8, with no occurrence of 10 days.
Link: https://www.coinglass.com/zh/bitcoin-etf
- ETF Proportion of BTC
This indicator reflects the proportion of Bitcoin held by ETFs relative to the total circulating supply, used to assess institutional participation. This indicator can reflect the acceptance and depth of participation of traditional financial institutions in Bitcoin.
Signal Features: =3.5% is an escape top indicator, also suggesting low institutional participation.
🔥 Current Status: The proportion is close to 6%, indicating that institutional participation is in a healthy growth phase.
Link: https://www.coinglass.com/zh/bitcoin-etf
- USDT Spot Financial Management
The USDT spot financial management interest rate is an important indicator for measuring market funding costs. This indicator reflects the overall liquidity situation in the cryptocurrency market.
Signal Features: >=29% is the escape top range.
🔥 Current Status: The interest rate is about 6.68%, at a normal level. However, during March 2024, this indicator entered the peak zone, reaching 65%.
Link: https://www.coinglass.com/zh/pro/i/MarginFeeChart
- Altcoin Season Index
This indicator is used to determine whether the market has entered an active altcoin period. By comparing the performance of Bitcoin with major altcoins, it can be assessed whether funds are starting to shift towards higher-risk smaller coins.
Indicator Range:
75: Altcoin season; exceeding 75 indicates the market is close to the top.
25-75: Balance period.
25: Bitcoin dominance period.
🔥 Current Status: The index is 41; however, during December 2024, this indicator entered the peak zone, reaching 88.
Link: https://www.coinglass.com/zh/pro/i/alt-coin-season
- MicroStrategy Cost Indicator
This indicator tracks the average holding cost of Bitcoin for MicroStrategy, serving as a reference benchmark for institutional investors. As MicroStrategy is one of the largest corporate Bitcoin holders, its cost line often becomes an important psychological price point in the market.
Indicator Range:
Current price above cost: Institutional profit range.
Current price close to cost: Support level.
Current price below cost: Potential buying opportunity.
🔥 Current Status: MicroStrategy's average cost is about 60,000, within the institutional profit range.
Link: https://www.coinglass.com/zh/pro/i/micro-strategy-cost
II. Summary
"Bears make you bankrupt, bulls make you poor." Staying rational during market euphoria and exiting gracefully during madness is much more difficult than buying at the bottom. Currently, only some indicators show escape top signals, which does not necessarily indicate that the entire market has peaked. If everyone feels there is a risk of the market peaking, they can also consider:
Setting staggered reduction points, without expecting a perfect top.
Converting profits into stablecoins or fiat currency, rather than shifting to higher-risk altcoins.
Selling early at high levels rather than late. Taking profits is not the end, but a way to accumulate ammunition for the next round.
Remember, every top is an opportunity for some to create wealth, and a trap for most. The market offers equal opportunities to everyone, but those who can seize the opportunity are often the prepared ones.
免责声明:本文章仅代表作者个人观点,不代表本平台的立场和观点。本文章仅供信息分享,不构成对任何人的任何投资建议。用户与作者之间的任何争议,与本平台无关。如网页中刊载的文章或图片涉及侵权,请提供相关的权利证明和身份证明发送邮件到support@aicoin.com,本平台相关工作人员将会进行核查。


